


What follows is a collection of my favorite dollar/commodity charts updated for today's prices. If the Fed continues on the inflation warpath, commodities are in trouble. But the fed ought to be seeing a clear message in these charts: commodities have already broken to the downside after a strong inflationary runup. The implication as I see it is that the Fed is already pretty tight and has probably broken the back of inflation. Plus, with the dollar so strong it's hard to see how the general price level can continue to rise at an unusually rapid pace; inflation by definition is a loss of a currency's purchasing power. That's just not happening in the sensitive commodity markets. Moreover, real estate activity has measurably softened, with 30-yr mortgage rates back up to 6%.
Message: the Fed has pushed up interest rates and the dollar to the point that demand for homes and commodities has taken a beating. This is how the Fed fights inflation. They don't need to do too much more, and they most certainly don't need to crush the economy or put people out of work to get the inflation rate down.
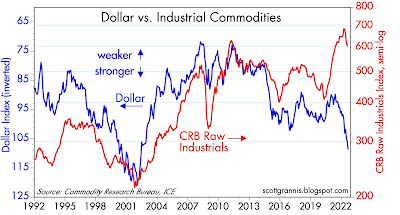

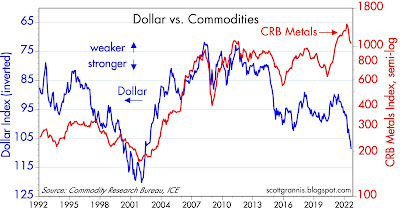
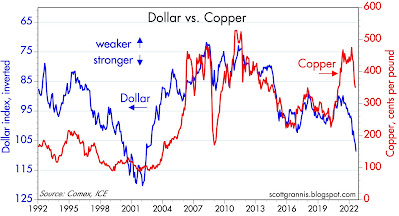
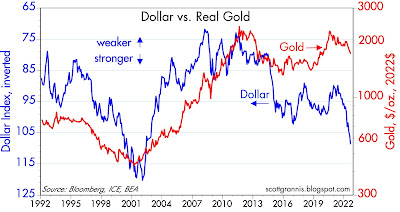
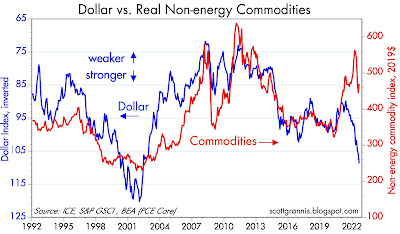


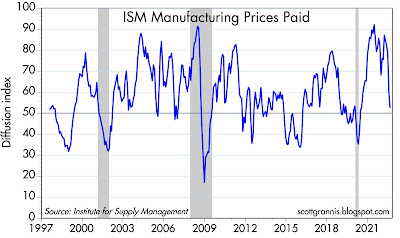
Chart #1

Note the strong, twenty-year correlation between the strength of the dollar and raw industrial commodity prices (Chart #1). I've inverted the value of the dollar to emphasize that a rising dollar almost always coincides with falling commodity prices. The last time the dollar was this strong commodity prices were only about half of what they are today.
It's a similar story for other commodity prices, as shown in Charts 2-7:
Chart #2

Chart #3

Chart #4

Chart #5

Chart #6

Chart #7

Chart #8

As Chart #8 implies, real estate has almost overnight become extremely expensive, given the huge runup in mortgage rates. This rates as one of the biggest shocks to the real estate market that I can remember.
UPDATE (9/1/22): The ISM Prices Paid index, released today, provides more graphic evidence that inflation pressures peaked months ago. The index, which reflects the percentage of respondents reporting paying higher prices for inputs, was 87 as of last March, and has since fallen to 52.5. See Chart #9 below:
Chart #9


23 comments:
Scott thank you for the post. I don’t remember any positive outcome from Powell speeches. He seems this kind of personality.
I notice chart 8 doesn't continue with conventional rates past 2020. curious what the spread is now between jumbo and conventional. in 2/2022, jumbo had been lower...
Good post but disagree. Financial markets are rife with speculation, commodity prices are still WAY too high, and housing is WAY over-valued. We need a recession and crash in commodities and housing on a 2008 level to bring some normalcy back to things. If people lose their homes they should learn not to buy at such stupidly high levels.
You know, if you restrict supply of housing and oil...you might find higher prices.
If government regulations start to restrict the supply of everything...
Sure, monetary policy plays a role. But try building housing almost anywhere along the West Coast....
BTW, I think Scott Grannis is right. Inflation is downtrending already. The Fed and ECB just need to stand by.
I do not know why, since there are plenty of smart people at the ECB, the Fed, the Reserve Bank of Australia, and so on.
Despite the staff-work, they always seem behind the curve.
I think Scott Grannis is right. The FED is already tight. They just need to stay the course.
Re spread between jumbo and conventional rates: the chart does include both throughout, but the spread is now so small that you can't see conventional rates (which on the chart are behind jumbo rates).
“On the liability side of the Fed’s balance sheet, the decrease may stem from either a reduction of reserves held by banks or a reduction in ON RRP take-up or a combination of both”
See: The Fed’s Balance Sheet Runoff and the ON RRP Facility – Liberty Street Economics (newyorkfed.org)
Williams: ""We're going to need to have restrictive policy for some time."
The gap between gdi and gdp has been 3.5% larger than its gdp in 2022. N-gDp is still running too high. The FED needs to drain the money stock and simultaneously increase the velocity of circulation (the 1966 Interest Rate Adjustment Act).
Long chill weekend with fresh Calafia charts to reflect on & full fridge of Cape May Coastal Evacuation... summer storms due in later today ... perfecto. Happy Labor Day!
Amazing how few people feared inflation last year but now scream that inflation is not going away unless the Fed tightens excessively. Inflation is not yet under control but it is headed down and the process will probably take another 12 to 18 months to reach a level that is acceptable but the Fed should quit raising rates by the end of the year.
The contraction of long-term monetary flows, the volume and velocity of money, is at the expense of short-term money flows (the distributed lag effects), the proxy for real output. So, normally this produces a recession. But the data so far this time doesn't support that to happen. There is just too much money in the economy.
Unlike Volker's inflation, this inflation isn't being slowed by a decline in money velocity, or an increase in the demand for money.
el85-23.pdf (frbsf.org)
"this inflation isn't being slowed by a decline in money velocity..."
Historically, recession conditions (often preluded by some kind of tightening, correlated?) have been associated with declines in money velocity. It makes sense as deleveraging occurs, debt and money are retired, but economic activity declines even more, driving velocity down. Irving Fisher eventually figured that out after the new era comments.
Just see the M2 graph from the Fed, which includes the early 80s decline in velocity linked to recessions.
The money demand concept makes sense and can explain a few things. But in our modern world where money has been created (QE and war-like expansion of commercial banks' balance sheets for government debt) in excess of underlying real economic activity, the demand aspect has been unhinged from the supply aspect.
The early 80s frbsf reference and some modern commenters suggest that checkable deposits increased more than 3T during covid because of precautionary behavior? really?
https://fred.stlouisfed.org/series/BOGZ1FL193020005Q#0
I enjoy reading your blog. With quantitative tightening, any thoughts on where the 10 year treasury is going to be in a few years? Will QT continue until Fed balance sheet looks like the "good old days?" Or, will the long rate just follow inflation? Might there be some broader reset of all rates going forward due to historically high reserves exiting banking system?
Great graph Carl. Obviously, the demand for money increased. But also, obviously, Vt increased based on the distributed lag effect of money flows.
^Money velocity (+ or - adjusted for excess reserves) has been coming down for more than 20 years. Why?
Since Q1 2020 to now, money velocity, on a net basis, is at about the same level, despite unprecedented fiscal and monetary easing. Why?
FAST MONEY
Inflation ‘collapse’ will launch powerful market rally, Credit Suisse predicts
PUBLISHED MON, SEP 12 20227:46 PM EDTUPDATED 3 HOURS AGO---CNBC
Well, who knows? But it is nice to read something positive every once in a while....
Markets plunge, Kashkari titillates, Corporate Landlords wail!
(Film @ 11)
PPI, my favorite price indicator, is definitely showing disinflation (since ~ April). The CPI and PCE will show stickier inflation due to shelter (owners equivalent rent).
My indicators are still moderately bearish on the stock, REIT and bond markets; still bullish on commodities (barely).
The "ability" for the Fed to even "control" the economy with their tools is very difficult; due to design of regulations, indicators, etc. I think we will have or are already in a recession (as will be recognized by the powers that be at a later date).
Will the recession be mild or bad?
Post a Comment