


The debate over work requirements for social programs is hot and heavy. I'll chime in there as I don't think even the Wall Street Journal Editorial pages have stated the issue clearly from an economic point of view. As usual, it's getting obfuscated in a moral cloud by both sides: How could you be so heartless as to force unfortunate people to work, vs. how immoral it is to subsidize indolence, and value of the "culture" of self-sufficiency.
Economics, as usual, offers a straightforward value-free way to think about the issue: Incentives. When you put all our social programs together, low income Americans face roughly 100% marginal tax rates. Earn an extra dollar, lose a dollar of benefits. It's not that simple, of course, with multiple cliffs of infinite tax rates (earn an extra cent, lose a program entirely), and depends on how many and which programs people sign up for. But the order of magnitude is right.
Since 1967, average inflation-adjusted transfer payments to low-income households—the bottom 20%—have grown from $9,677 to $45,389. During that same period, the percentage of prime working-age adults in the bottom 20% of income earners who actually worked collapsed from 68% to 36%.
The Foundation for Government Accountability [estimates] that there are four million able-bodied adults without dependents on food stamps, and three in four don’t work at all. Less than 3% work full-time.
It's much more efficient to get people to work by saying "if you earn a dollar, you can keep it," rather than "if you earn a dollar we'll take it away from you but we're going to force you to work."
Is there a better way? I've long played with the idea of limiting help by time rather than by income. That's how unemployment insurance works.
Another wild idea: Good economists all understand that consumption, not income, is the right measure of well being. That's why consumption taxes are a good idea. One advantage of a consumption tax is that it would be easier to condition benefits on consumption rather than income. If you work and save the results, you can keep your benefits.
Wednesday, May 31, 2023
Recommended reading: work requirements and welfare
Thursday, May 25, 2023
It's a 2% growth world
Also released today were estimates of corporate profits for the first quarter, and these were somewhat disappointing, having fallen from a high of 10% of GDP last summer to now 8.7% of GDP. In nominal terms, profits fell 8% from last summer's level to $2.31 trillion. Despite the recent weakness, however, corporate profits as a percentage of GDP are nevertheless rather strong considering they have averaged only 7% of GDP in the post-war period.
Chart #1

Chart #1 compares the level of real GDP to historical trends. The green line represents the trend growth rate the economy averaged from 1965 through 2007 (3.1% per year). The red line is the trend that has held since the current recovery started in mid-2009 (2.1% per year). A one percentage point difference per year doesn't sound like much, but over time it really adds up. If the economy had remained on a 3.1% annual growth path, it would be 25% larger today.
Chart #2

Chart #2 compares the year over year growth of real GDP (blue) to the year over year growth in private sector jobs. Not surprisingly, these two series tend to track each other, since it usually takes more workers to generate more growth. Over long periods, GDP growth tends to be greater than jobs growth because worker productivity tends to average about 1½% per year (i.e., the average worker generates about 1½% more output per year thanks to productivity-enhancing technology and machinery) . What's interesting here is that jobs growth has been stronger than GDP growth in the past year or so. Although the pace of jobs growth has slipped to 2.1% in the most recent six-month period, that could theoretically support real GDP growth of at least 3%. Considering the myriad problems facing the economy these days, it's not unreasonable to expect real GDP growth to remain around 2% per year for at least the next six months—a result not at all out of line with historical experience.
Chart #3
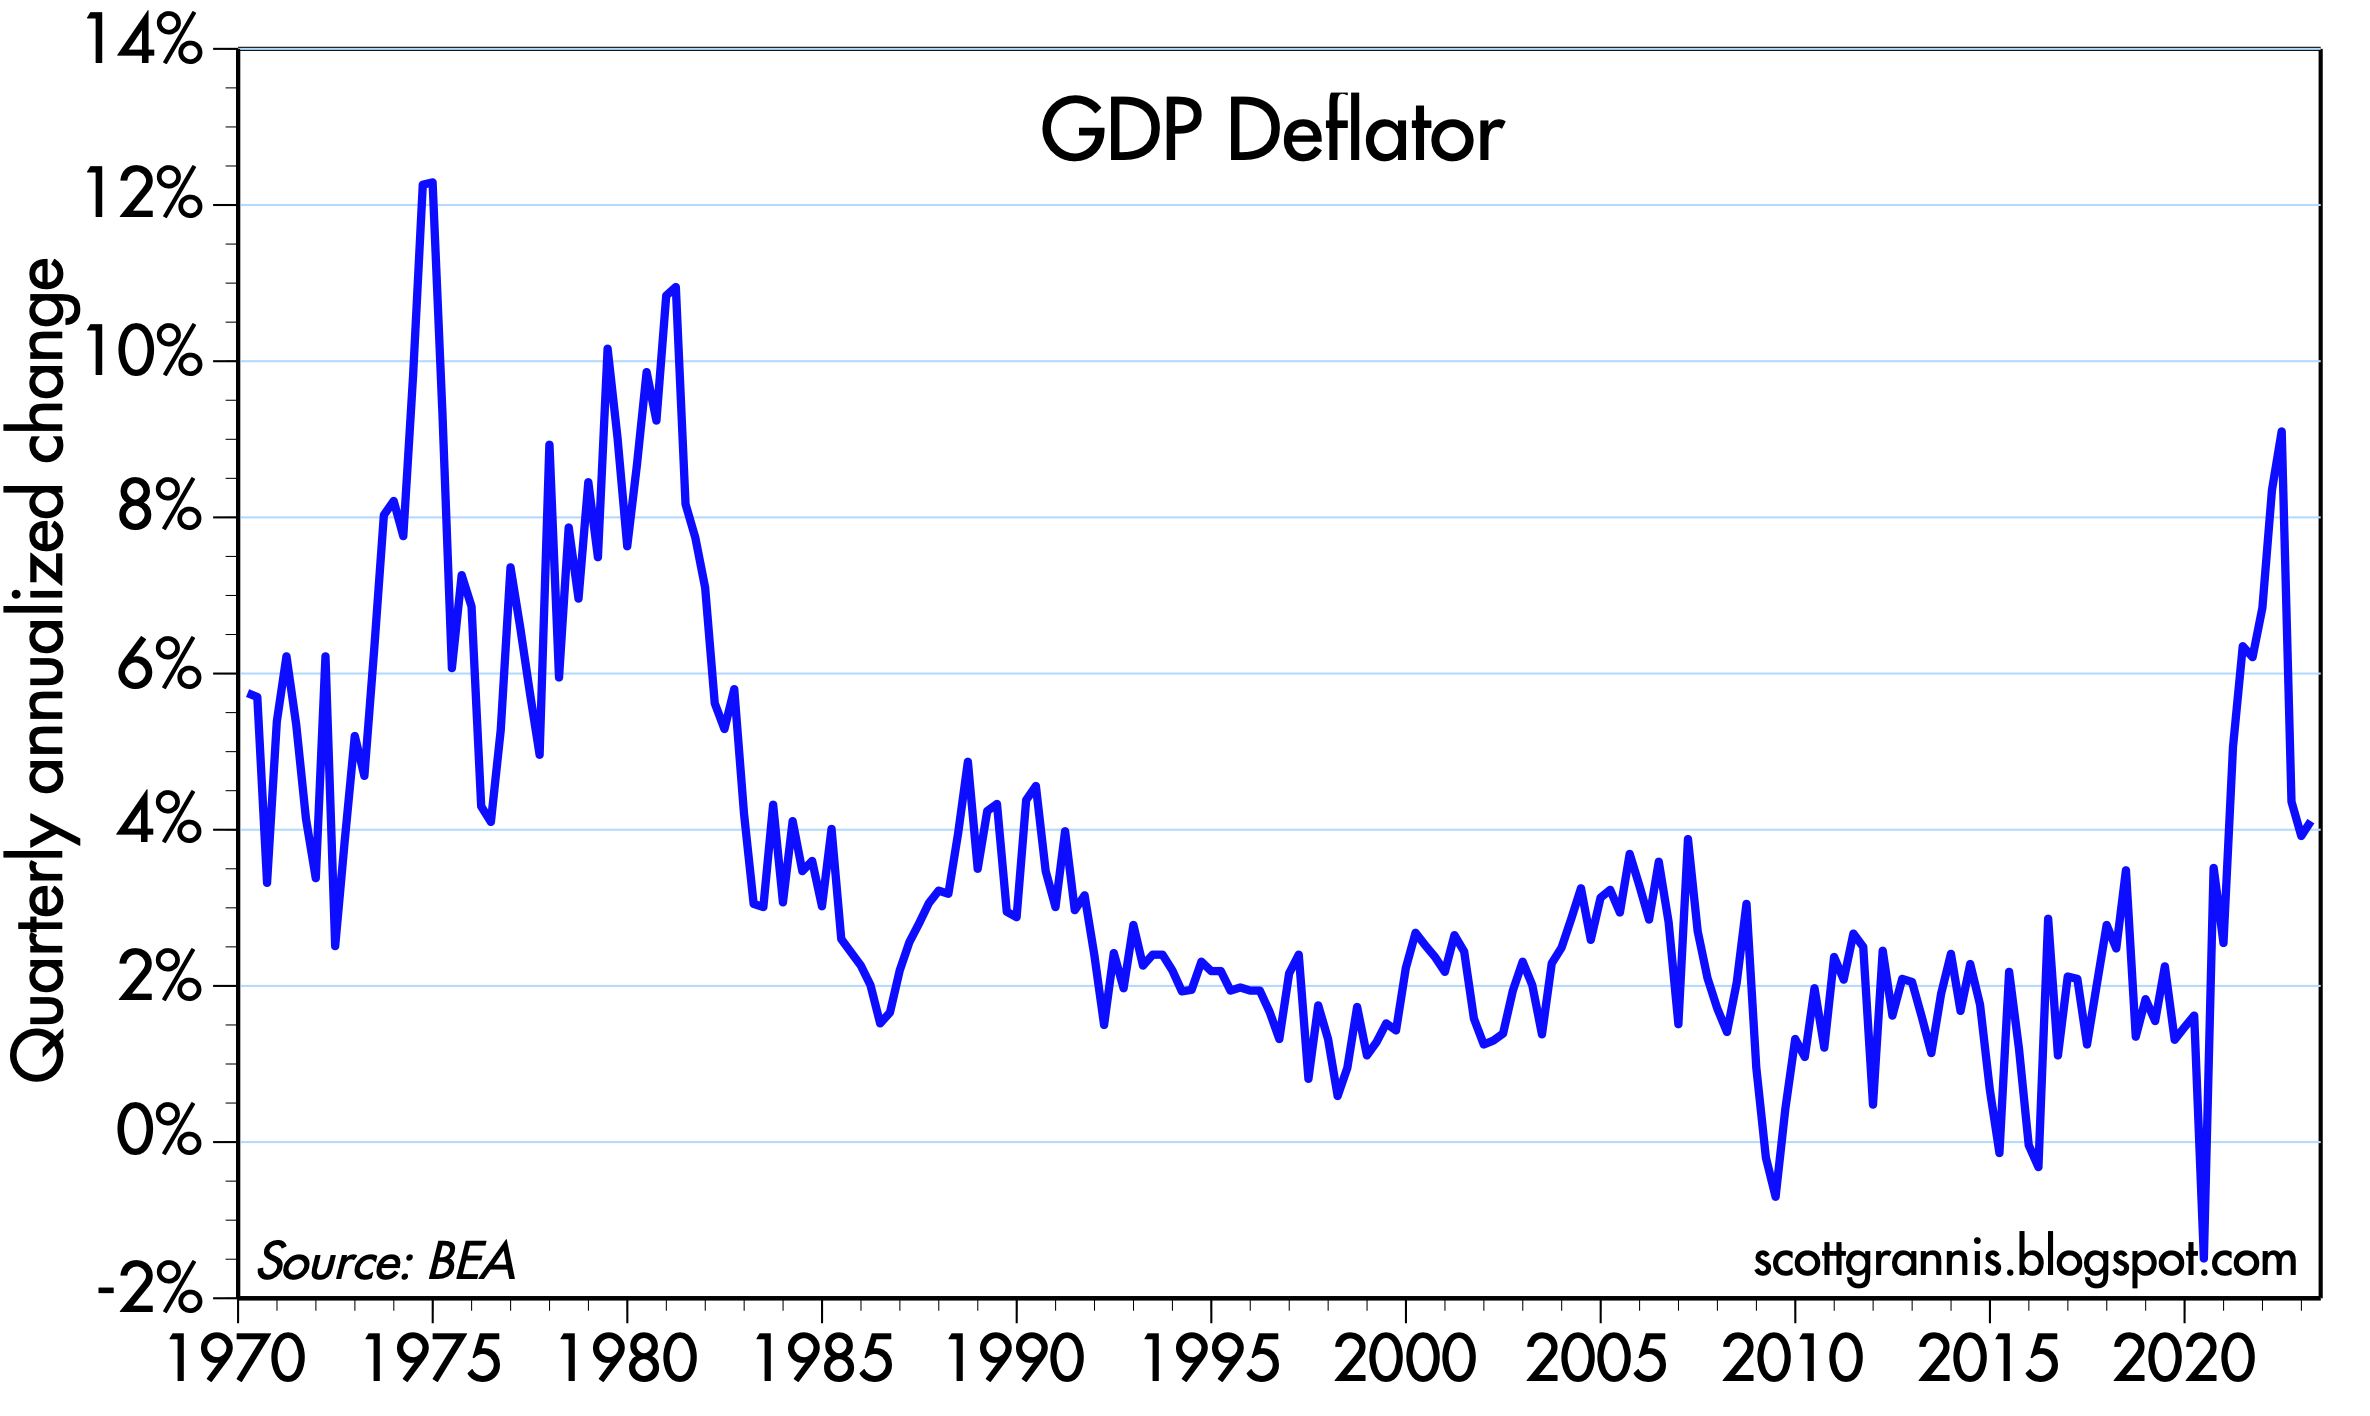
Chart #3 shows the quarterly annualized rate of inflation according to the GDP deflator. Although painful, the recent spike in inflation has been much less, and of much shorter duration, than what we experienced in the 1970s.
Chart #4

Chart #4 shows corporate profits as a percentage of nominal GDP. What stands out to me is that corporate profits during the current business cycle expansion (2009 - today) have been substantially stronger than they were in prior decades, despite the fact that the economy averaged 3.1% annual growth in the pre-2009 period.
Chart #5

My best guess as to why corporate profits have been so strong? I think it's explained to a great degree by globalization. US corporations today can market their products and services to a vastly larger market today than they could a few decades ago, which means that successful businesses can greatly leverage their market reach. World trade volume (Chart #5) has expanded by more than one-third since 2007. And that's just trade in goods; including services (e.g., technology, data, entertainment) the growth would surely be an order of magnitude larger. (sources for this dataset are welcome)
Wednesday, May 24, 2023
A soft landing thanks to surplus M2
My counters: The latest round of Fed tightening has occurred in the wake of a massive and unprecedented increase in the M2 money supply that has been mostly—but not completely—reversed. A $6 trillion jump in M2 was responsible for the recent surge in inflation, but there is still a small "surplus" of M2 that is helping to cushion the otherwise destructive impact of the Fed's massive monetary tightening. In addition, the spending cuts that are proposed should boost confidence and improve the economic outlook because they imply lower tax burdens and a more efficient economy.
In my view, an economic "soft landing" with lower inflation is entirely possible. Soon, it should become obvious that the Fed can begin to relax monetary policy. If the Fed delays too long, however, then the risk of deflation next year will rise.
Chart #1

Chart #1 compares the growth rate of M2 with the year over year rate of inflation according to the Consumer Price Index. I have shifted the CPI line one year to the left, in order to show how changes in M2 growth have preceded changes in inflation. The chart strongly suggests that the CPI should continue to fall over the next 6-9 months.
Chart #2

I have featured Chart #2 for several years now, and it continues to be highly relevant to today's environment. It compares the actual level of M2 (blue line) with the 6% per annum growth rate which prevailed from 1995 through the pre-Covid period. The y-axis is logarithmic, which shows constant rates of growth as straight lines. As of last April, the "gap" or "surplus" amount of M2 relative to its long-term trend was about half what it was at its peak in 12/21. That means, in effect, that about half of the abnormal growth in M2 has fueled higher inflation and a larger economy. However, as Chart #5 below suggests, the effective gap or surplus of M2 could be less than is shown here.
Chart #3

Chart #3 is similar to Chart #2, but it shows only the currency component of M2, which currently represents about 10% of the total. The long-term trend growth rate of currency is 6.6%, slightly higher than M2 because US currency (mainly $100 bills) is increasingly used in developing countries (e.g., Argentina). The "gap" or surplus amount of currency today is only $80 billion by this measure. Both charts suggest that the monetary fuel behind our recent inflation surge is being depleted.
Chart #4
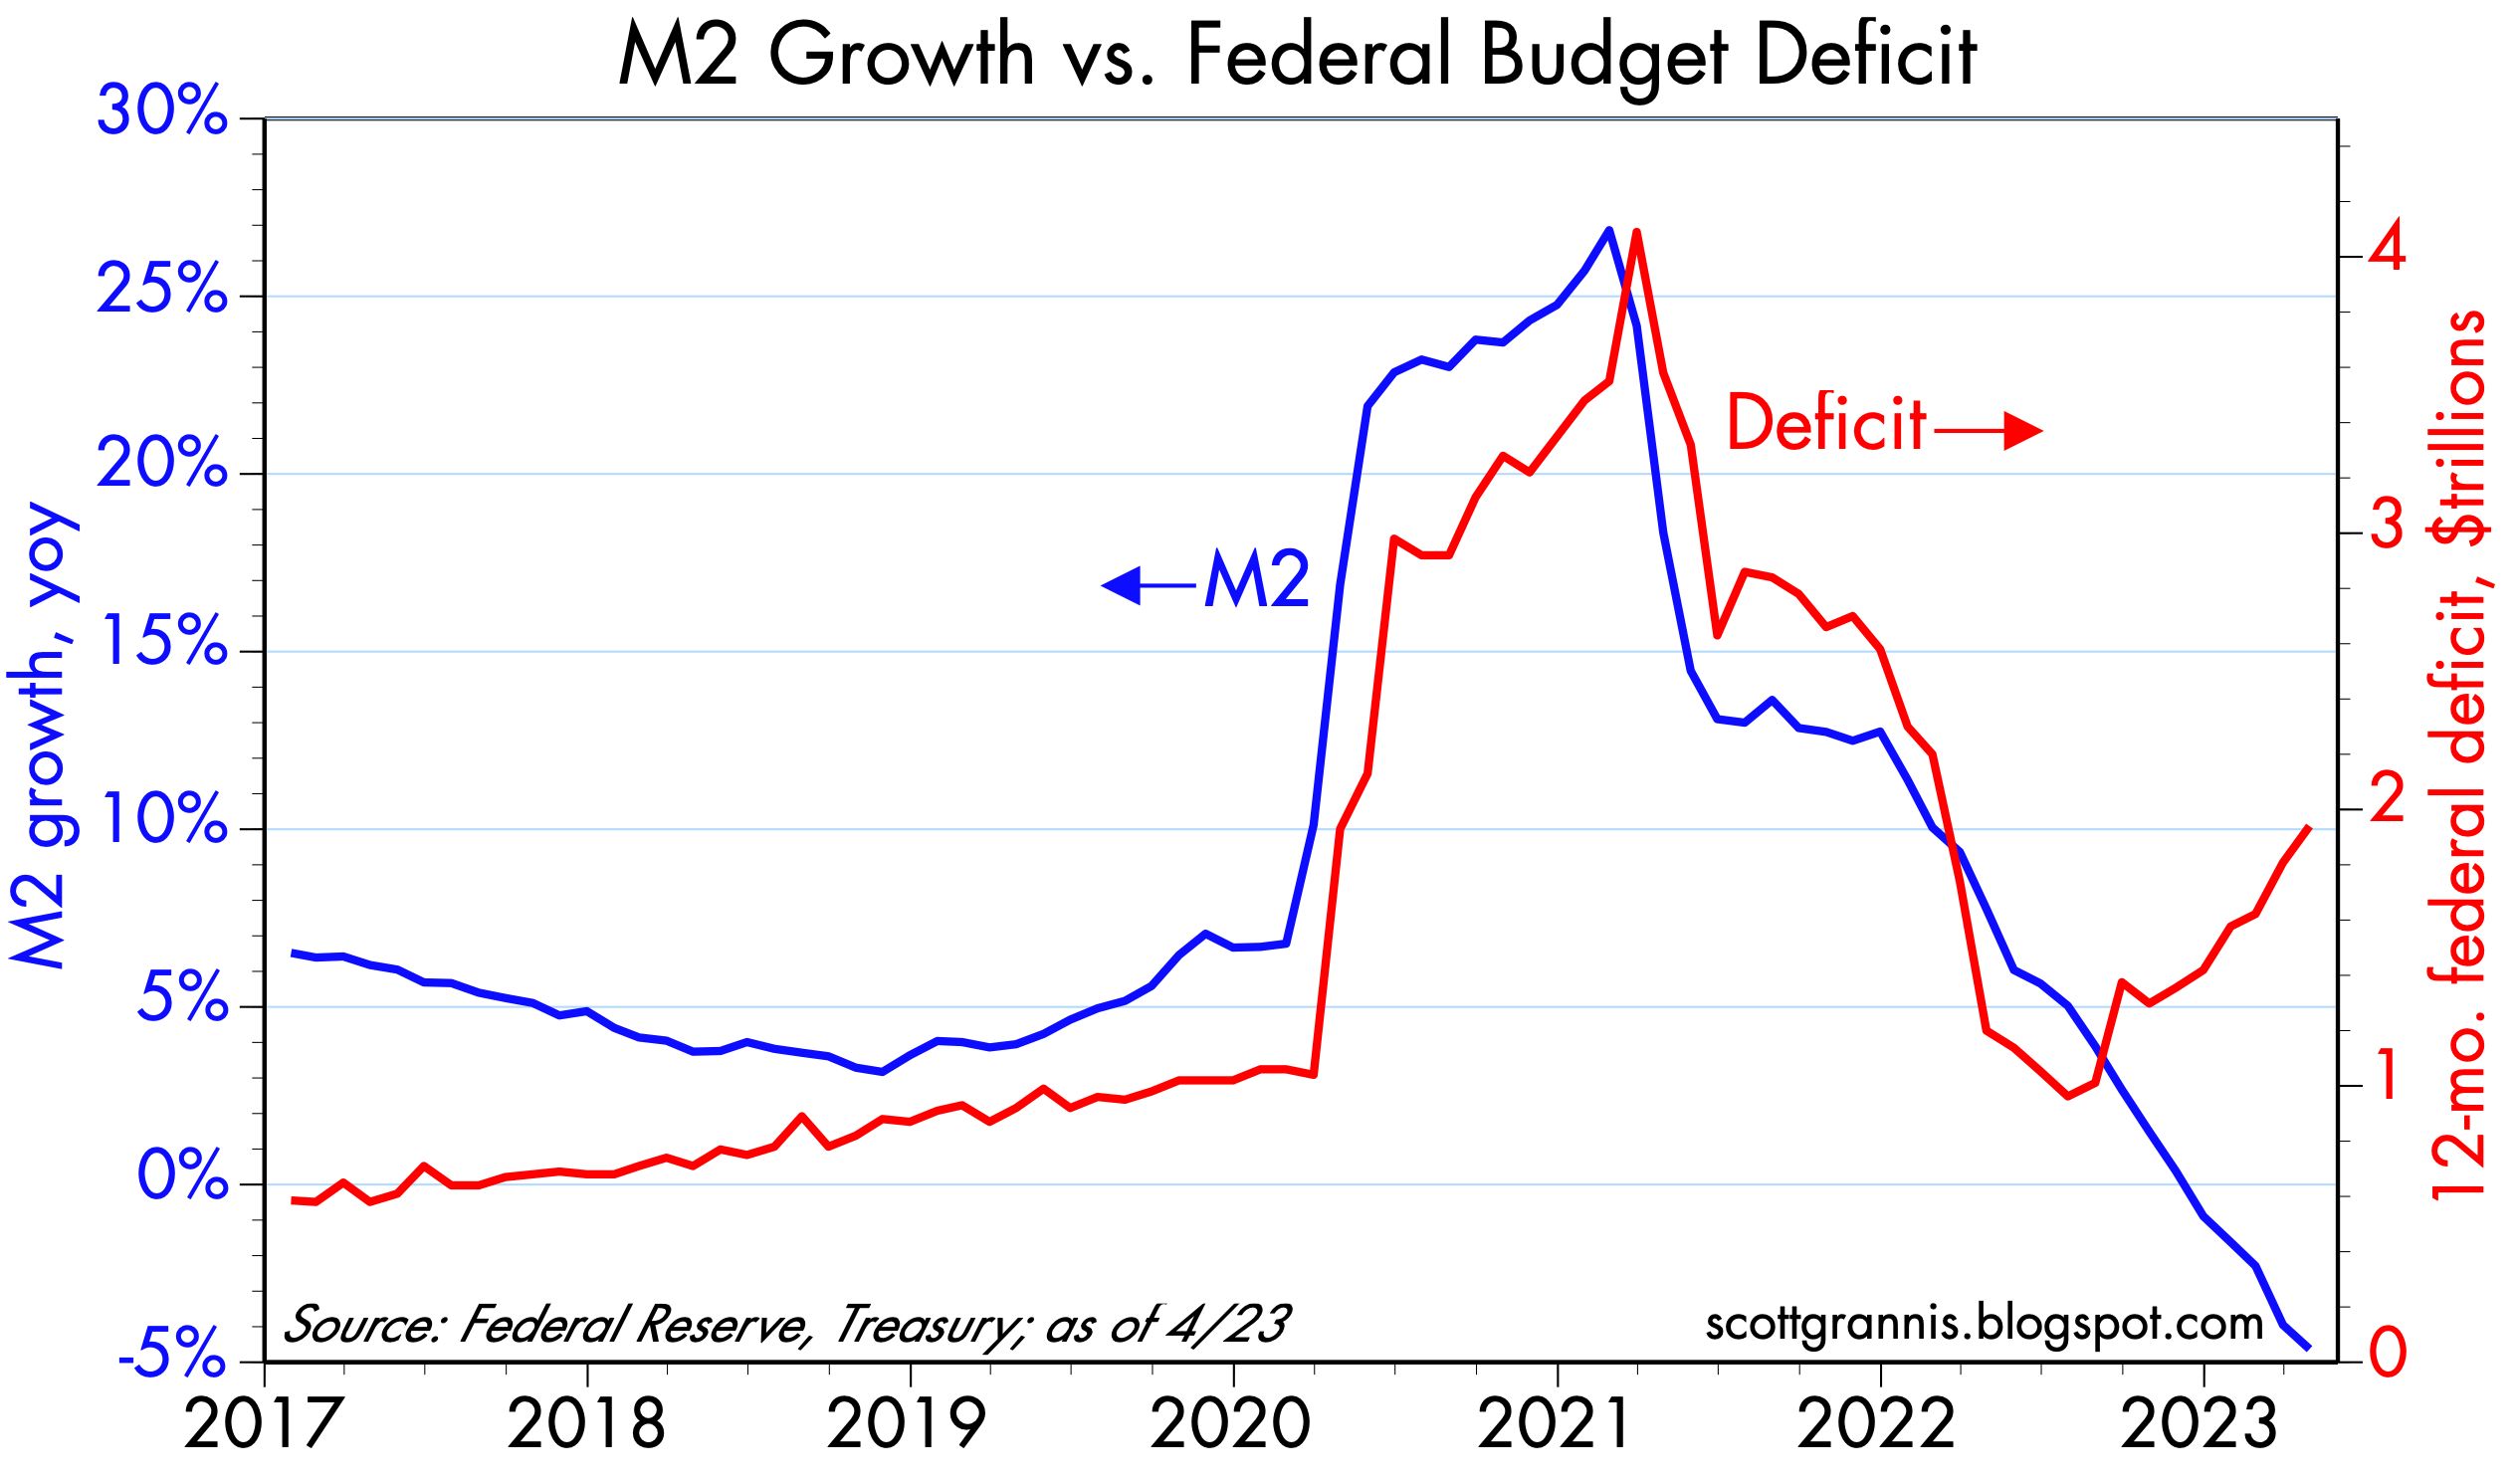
Chart #4 compares the growth of M2 with the level of the federal budget deficit. Here it should be obvious that the roughly $6 trillion of Covid "stimulus" spending was effectively monetized. It's critical also to note that the $1 trillion increase in deficit spending since last July has NOT been monetized. That all but eliminates the threat of further increases in inflation going forward.
Chart #5

Chart #5 shows the ratio of M2 to nominal GDP. It's a good proxy for what I call "money demand," since it can be described as the portion of the average person's annual income that is held in cash or cash equivalents (i.e., currency, bank CDs, time deposits, and savings accounts). Money demand soared as the Covid lockdowns spread and the government showered people with "stimulus" funds. It was hard to spend money back then, and most people were terribly worried about the future, so most of the stimulus checks just sat in people's bank accounts. But once the Covid panic eased, beginning in early 2021, people began to spend the money they had accumulated. Much of that extra spending, coming at a time of supply bottlenecks, sparked higher prices (i.e., inflation) and the rest helped the economy to recover (i.e., it helped fuel renewed growth).
If present trends continue, the demand for money (as calculated in Chart #5) could return to pre-Covid levels by the end of this year. That further implies that the "surplus" of M2 could essentially disappear within the next 7 months, having been entirely absorbed by rising prices and a larger economy.
Technical note: money demand as shown here (M2 divided by nominal GDP) is the inverse of money velocity. Plunging money demand is the same as soaring money velocity. Instead of sitting in bank deposits, money these days is circulating more rapidly and thus supporting a rising level of nominal GDP.
Friday, May 12, 2023
Inflation is so over
Today the bond market is convinced that there will be no more Fed rate hikes. Yet the Fed insists that inflation has not fallen by enough, so that warrants continued monetary restraint; some governors even argue that further rate hikes might be necessary, even as evidence of economic weakness builds. Chalk this up to one more example of how the bond market is usually smarter than the Fed. Fed mistakes like this have been the proximate cause of every recession in my lifetime. This is yet one more reason why individuals—and especially committees like the FOMC—are never as smart as they should be. By extension, bureaucrats are rarely smarter than the collective wisdom of those they are supposed to oversee. Which is why at heart I'm a Libertarian—government should be limited as much as possible.
Simple logic says that if inflation is clearly decelerating, no further rate hikes are necessary. When you apply the brakes when approaching a red light, you don't take the pressure off until after you've stopped—you start easing up before you come to a stop. The evidence in the charts that follow make a strong case for rate cuts starting NOW, because inflation has already declined by enough.
Chart #1

Chart #1 compares the year over year change in the CPI (red) to the 6-mo. annualized change (blue). When inflation dynamics change, that show up first using a shorter time frame. Compared to a year ago, prices are up about 5%, but over the past six months, the CPI is rising at only a 3.3% rate. In the current disinflationary environment, it is essential to look at the rate of change in prices over a shorter time frame— one year is too long.
Chart #2

Chart #2 compares the 6-mo. annualized change in the CPI to the same change in the ex-shelter version of the CPI (shelter costs account for about one-third of the total CPI). Over the past six months, CPI less shelter is up at a mere 1% annualized rate.
Chart #3

Chart #3 shows the 1- and 3-month annualized rate of change in Owner's Equivalent Rent, the main component of shelter costs in the CPI. By either measure, shelter inflation has peaked and is beginning to decline, but only very recently.
Chart #4

If the Fed doesn't ease up on the monetary brakes soon, we could be seeing some deflation before too long.
Chart #5

Chart #5 shows inflation at the producer level (the first part of the inflation pipeline) over the last year and the last 6 months. Inflation by this measure has collapsed to a mere 0.6% over the past six months!
Chart #6

Chart #7

Charts #6 and #7 are the most important charts that hardly anyone is looking at these days. What they show is that our recent surge in inflation was caused by a surge in deficit spending from 2020 through 2021. As much as $6 trillion of Covid "emergency" spending was effectively monetized, as it accumulated in the nation's savings and deposit accounts (M2). Once people started to spend the money, beginning in early 2022, inflation took off. A ton of extra money was printed, and about a year later, inflation started to rise. Now that the extra money is disappearing, inflation is slowing significantly.
The best news here is that the third round of deficit spending that began last summer, and has now pushed the 12-month deficit from $1 trillion to almost $2 trillion, has not been monetized at all. This all but ensures that inflation is on its way out. The fires of inflation have been extinguished; only embers remain, and they are already flickering out.
How long before the FOMC realizes all this?
Monday, May 8, 2023
Swap and credit spreads still say no recession
At this point it's almost perceived wisdom that the economy will soon slip into a recession, with the only doubt being the degree of severity. I remain skeptical, however. It's true that the Fed is very tight and the yield curve is very inverted—both being classical precursors to recessions in the past. But there are other precursors to recession that are not present today, namely wide and rising swap and credit spreads. And while some observers note with concern the unprecedented decline in the M2 money supply over the past year, I view it as a welcome return to something more normal—after all, M2 is still significantly higher than its historical trend vs nominal GDP. To be sure, the growth in private sector payrolls has slowed in recent months, and appears likely to slow further (from 4-5% a year ago to now 2%), but it's still far from being in recession territory.
I also think there's a good chance that the market is overlooking the fact that the current round of Fed tightening is unique in one important respect: the Fed is pushing short-term interest rates higher directly, without draining bank reserves (as they always did in the past). That means that this time around there has been no shortage of liquidity in the banking system, and that's a big deal. Liquidity (e.g., ample amounts of cash and an abundance of risk-free, interest-bearing securities like bank reserves and T-bills) is essential to functioning and efficient markets. Efficient markets, in turn, function as "shock absorbers" for all sorts of ups and downs in the economy. Are you comfortable holding certain high-yielding corporate bonds but afraid that all bonds will lose value in a rising-rate environment? Then use the swap market to neutralize the risk of higher rates while still retaining exposure to the companies you like. Swap spreads are pretty low these days, and that means you can easily swap out of the risk you are uncomfortable with. Efficient markets allow people to tailor their risk profile to suit their particular appetite for risk, instead of just bailing out of everything. Liquid and efficient markets are like being in an open-air theater when someone yells "fire!" There's no panic, because there are no crowded doors you have to exit through.
All eyes will be on Wednesday's April CPI release, with most expecting to see no change in the year over year measure (5.0%). I think there's a decent chance of seeing 4.8%, which would also mean that over the past six months, inflation will have been rising at a mere 3.1% annualized rate. If I'm right, it will likely be because the increase in homeowners equivalent rent will be decelerating, as it began to last month. (See this post for details.) An easing of inflation would go a long way to restoring faith in the future, since the market would view the Fed's job as mostly done—with declining short-term interest rates breathing life into most areas of the economy.
Here are a few charts to illustrate these points:
Chart #1

Chart #2

Chart #1 shows the level of 2-yr swap spreads. In normal times, this spread trades between 15 and 35 bps. Today it was smack in the middle of that range. Thus there is no sign of any unusual stress in the bond market, and to judge by this fact, liquidity is still abundant. This spread has spiked to 60 bps or more in advance of past recession, as Chart #2 shows.
Chart #3

Chart #3 shows the level of Credit Default Swap spreads. This is a highly liquid barometer of the health of corporate profits (tight spreads indicate strong profits, rising spreads indicate deterirorating profits). As with swap spreads, there is no sign of distress here. Indeed, the market seems to have largely brushed off the risk associated with the collapse of Silicon Valley Bank last March.
Chart #4

Chart #4 is Bloomberg's index of financial conditions. It aggregates all sorts of sensitive, market-driven indicators (see the components listed at the bottom of the chart). Today, financial conditions appear pretty much normal, whereas they reliably decline in advance of recessions.
Finally, my contrarian instincts perk up whenever I hear almost everyone warning about an impending recession.
Subscribe to:
Posts (Atom)
