Wednesday, May 25, 2022

M2 growth slows: light at the end of the inflation tunnel


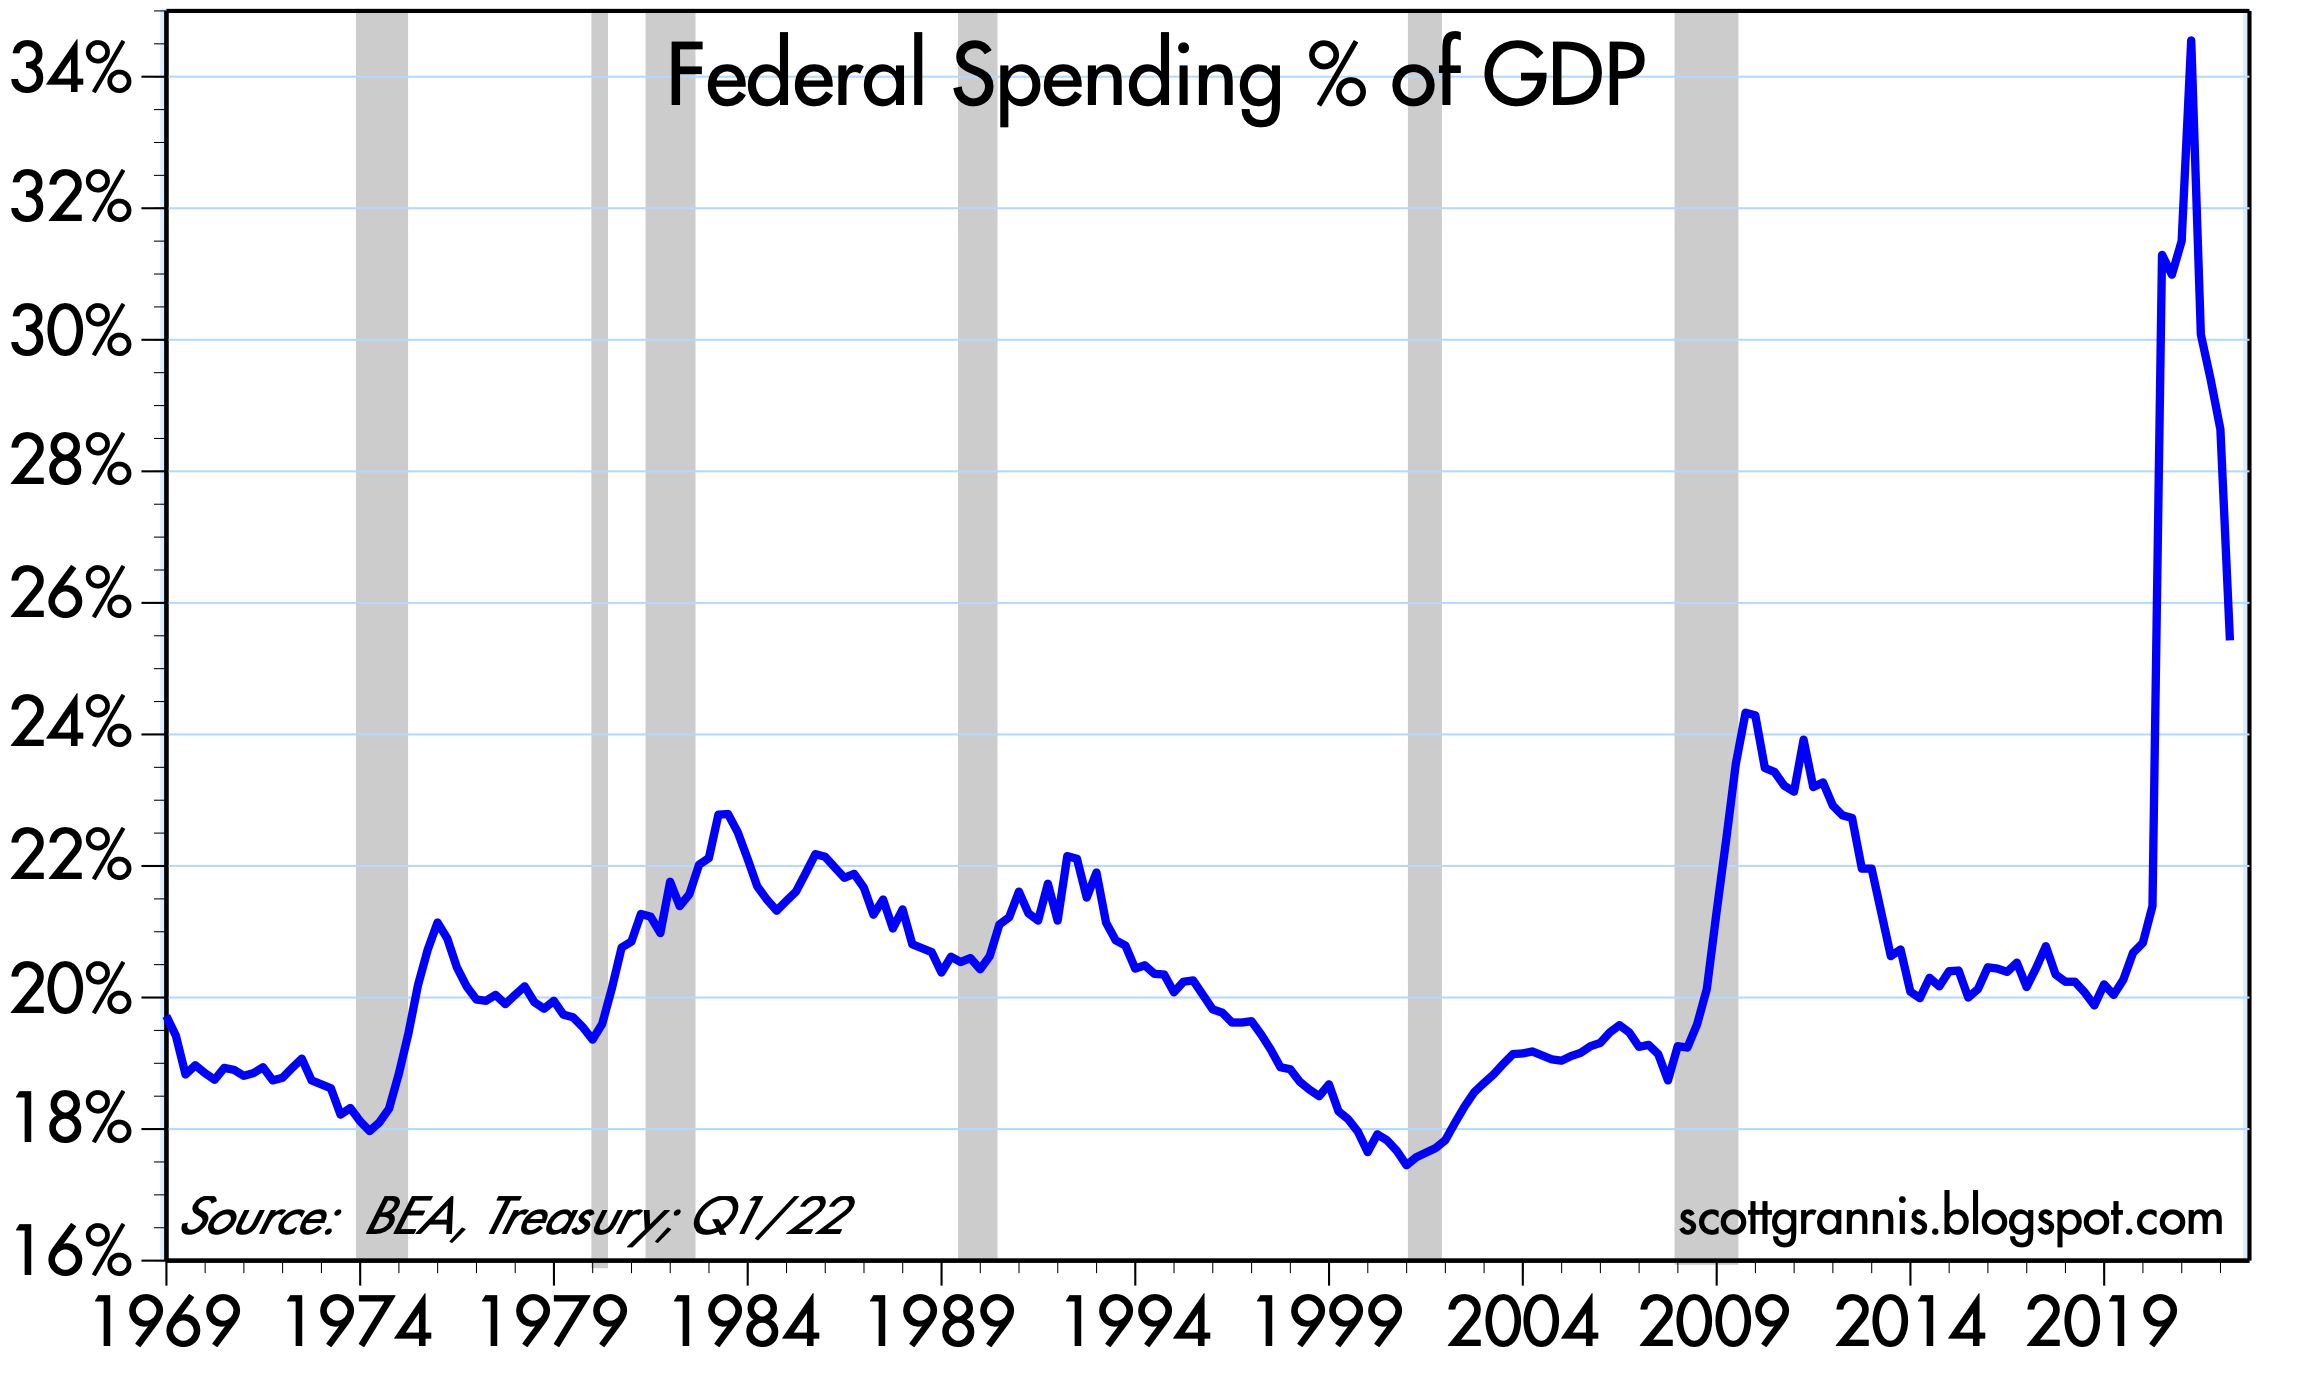
I've been covering the explosive growth of M2 for almost two years now, and I'm very happy to report that M2 is no longer exploding. In fact, its annualized growth rate over the past 3 months has fallen to a mere 1.3%, down from its all-time, year-over-year high of 26.9% in February of last year. The source of the unprecedented M2 growth now looks almost certain to have been the frenzied federal spending which followed in the wake of the Covid shutdowns. That spending was effectively monetized by the Fed and the banking system, which in turn fueled an enormous increase in demand relative to output. All transpired in line with Milton Friedman's theory: "Inflation is always and everywhere a monetary phenomenon, in the sense that it cannot occur without a more rapid increase in the quantity of money than in output."

Now, in the absence of any further Covid "stimulus" payments, and thanks to surging tax revenues (see my last post for more details), the Fed's decision to raise interest rates and shrink its balance sheet, all but ensure that there will be at least no further fuel poured on the still-raging inflation fire which was sparked about a year ago. In that sense it may be said that our current inflation episode will likely prove to be "transitory." But since we also know that inflation responds to excess money with a "long and variable lag," we are likely to see uncomfortably high inflation for at least the next year or so. How high and exactly for how long is anyone's guess at this point, but at least we can now see some light at the end of the inflation tunnel. 

Not surprisingly, the bond market has figured this out. Inflation expectations have cooled in the past two months: the 5-year breakeven inflation rate embodied in the TIPS market has dropped from a high of 3.7% to now 2.9%. At the same time, the bond market has adjusted downward its expectation for the peak in the Federal funds rate. Thus the market now expects the Fed to raise its target rate to a maximum of about 3% a year or so from now, instead of 3.5% by the end of next year. To my mind this seems quite optimistic. But if the bond market is right then the economy is unlikely to suffer much and the equity market correction underway may be nearing an end.
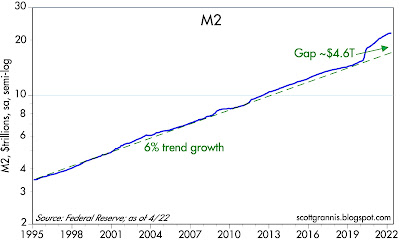
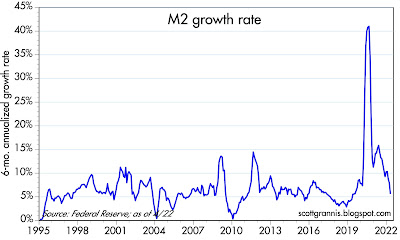
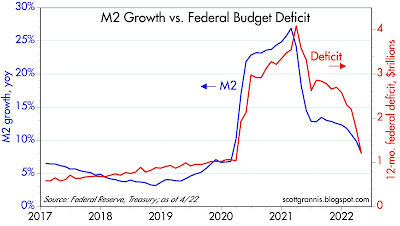
Chart #1

Chart #1 shows the level of the M2 money supply as of the end of April (data released yesterday). As growth slows relative to its long-term 6% trend, the "gap" is shrinking. But it may take at least a year or two before it disappears, so I repeat what I said earlier this month: "M2 still has a lot of inflation potential."

Chart #2

Chart #2 shows the year over year growth rate of M2. As noted above, M2 has hardly grown at all for the past three months, and the budget deficit is very likely to continue shrinking, so the year over year rate is almost certain to approach zero.

Chart #3

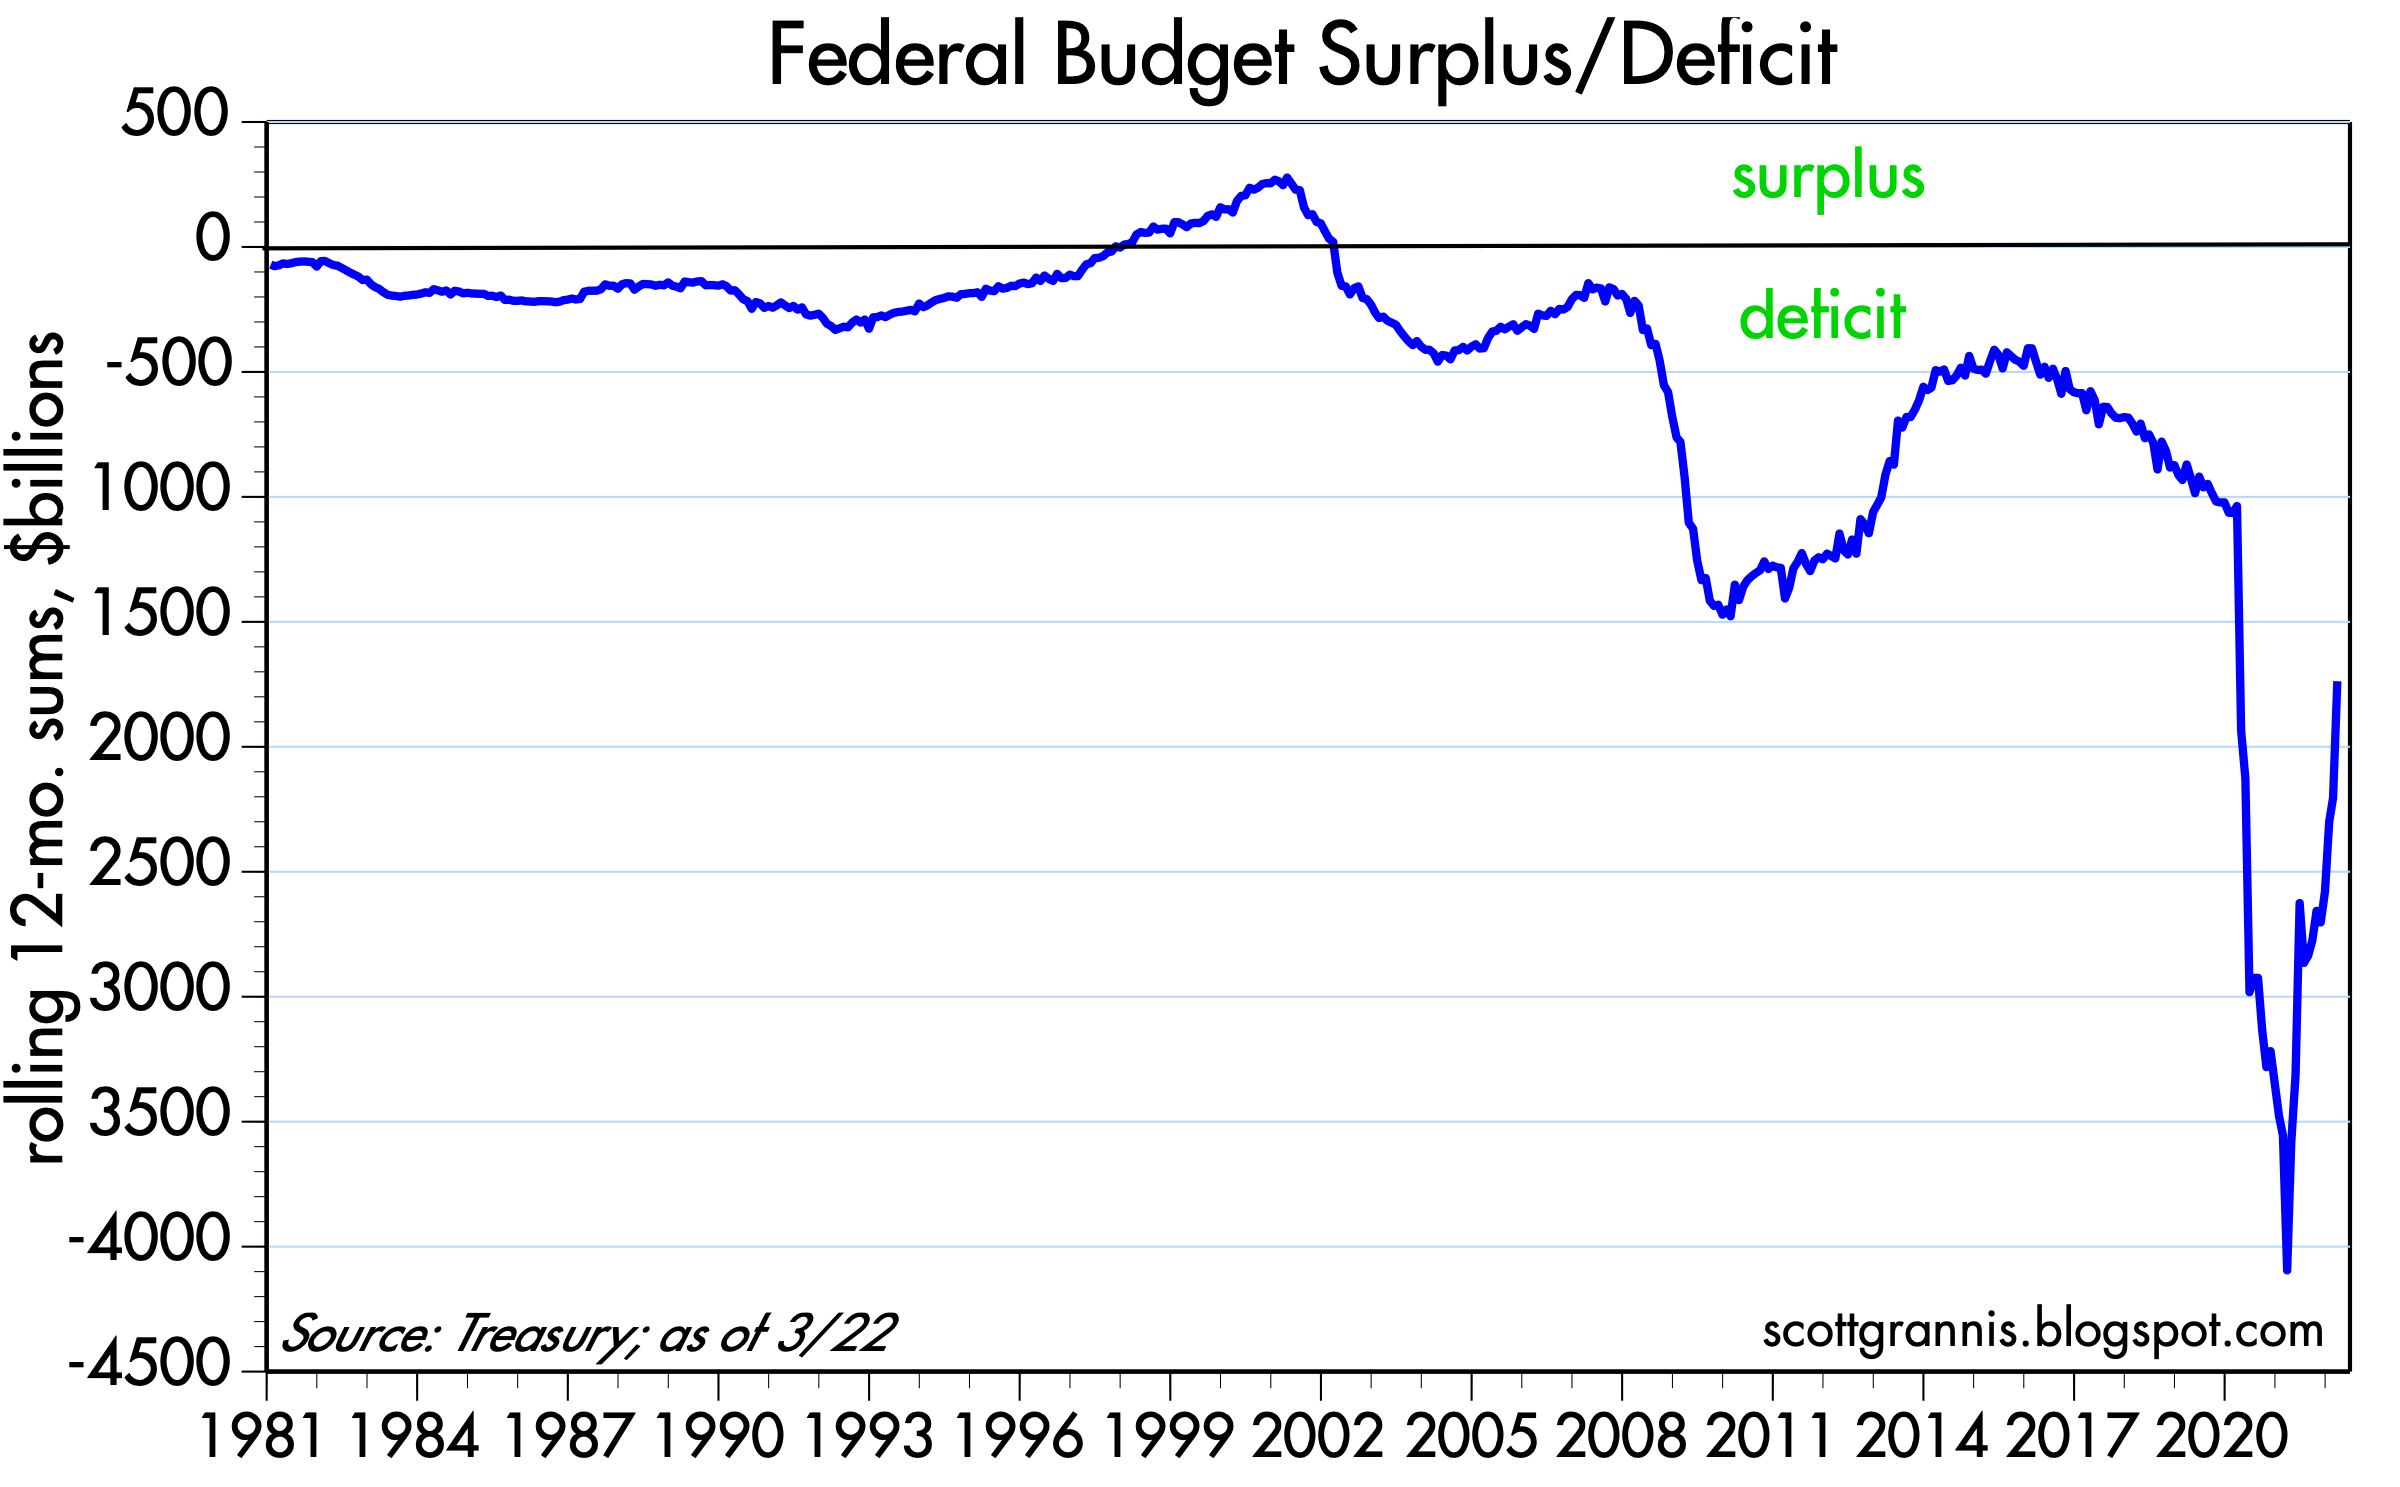
Chart #3 compares the growth of M2 to the level of the federal budget deficit. This is powerful evidence that the deficit was effectively financed by "money printing."

I hasten to add that this is arguably the first time in modern history that this has happened. Did the Fed allow this to happen? How exactly did M2 increase so explosively? Under our fractional reserve banking system, only banks can create new, spendable money; the Fed can only create bank reserves, which in turn are necessary for banks to create new money. Is Powell now being lauded for mopping up the mess he created? We don't know the full story yet, but I'm sure it will emerge.

Monday, May 16, 2022

No need to raise taxes!


In my experience, politicians are almost always late to the party. At a time like now when tax revenues to Treasury are soaring, why is anyone talking about raising tax rates? 

Chart #1

Chart #1 shows the major sources of federal revenues. As should be obvious, the biggest gains by far have come from the tax on individuals' income. In the 12 months ended April '22, individual income tax receipts were 31% higher than they were for the 12 months ended April '21. The increase had nothing to do with higher tax rates, and everything to do with strong gains in employment and nominal income, plus a bonanza due to realized capital gains in the stock market. 

Chart #2

Chart #2 shows the history of federal spending and federal revenues, as measured by rolling 12-month sums.  Thanks to surging revenues and plunging spending, the deficit over the previous 12 months has fallen from a peak of $4.1 trillion in March '21 to $1.2 trillion in April '22.

Biden is correct to say that the deficit has plunged more under his administration than it did in any other, but he is wrong to imply that it was due to anything he did. His Covid-related emerging spending in the early months of his administration boosted the deficit to its all-time record, and his failure to pass "Build Back Better" (i.e., his failure to spend even more) allowed spending to decline. His failure to boost income tax rates helped the economy to recover, and that in turn boosted tax revenues. In other words, he "succeeded" in bringing down the deficit because he failed to make it worse.

If gridlock prevents Congress from spending more and raising tax rates, it is reasonable to expect the deficit to continue to decline, as the economy continues to recover from the ill effects of Covid and the depressing effects of too much spending.

Wednesday, May 4, 2022

M2 still has a lot of inflation potential

The growth of the M2 money supply has slowed in recent months (thank goodness!), and today's FOMC announcement was less aggressive than the market had feared. Stocks surged in a sigh of relief. As I said last February, Fed tightening is not a near-term threat. Regardless, I still think the Fed and the bond market are behind the curve. And as I point out in this post, the level of M2 is still full of inflationary potential.

Chart #1

Chart #1 shows the 6-month annualized growth of the M2 money supply as of the end of the first quarter. After registering double-digit growth rates for the past two years—an astonishing development without precedent in U.S. history—M2 growth has slowed to an 8% annual rate over the past six months, and a 6.2% rate over the past three months. For reference, M2 growth averaged about 6% a year from 1995 through early 2020. So, with growth rates back to "normal" is this a reason to cheer? Hardly. If growth hadn't slowed, that would have been very disturbing; as it is, the cumulative growth of M2 is still mind-boggling and very likely to fuel uncomfortably high inflation for the foreseeable future. 

Chart #2

Chart #2 shows the level of M2 plotted against its 6% per annum long-term trend rate of growth, using a logarithmic y-axis so that a straight line on the chart represents a constant rate of growth. This chart, which I have been featuring for many months, tells an astounding story that is still almost completely overlooked by most economic and financial market observers. Among the numerous articles on the subject of inflation, you'll find that fewer than one in ten even mention the money supply. To my knowledge there are only a handful of reputable economists that see it they way I do: Steve Hanke, John Cochrane, Brian Wesbury, Ed Yardeni, and Bill Dudley.

A few things to note in the chart: M2 is now about $4.8 trillion larger than it would have been with a continuation of 6% annual growth. Put another way, M2 today is running about 28% above trend, which equates to more than four years of normal growth. If you were to have asked any monetarist back in 1995 about the consequences of such a rate of M2 growth, they would undoubtedly have said your question was too preposterous to even consider. Regardless, this chart provides all the evidence one needs to explain why inflation in the past year has far surpassed expectations—and is likely to continue to do so. 

Chart #3

Chart #4

Arguably, both the 2020 surge and the recent slowdown in M2 growth had a lot to do with huge swings in government spending, as shown in Chart #3. The surge in spending was all about Covid relief and "stimulus," and it was entirely financed by issuing new debt, most of which was effectively monetized by the banking system. Fortunately, the government is no longer flooding the economy with relief checks, and Biden's absurd "Build Back Better" initiative is dead, so there is unlikely to be much more monetization. Meanwhile, tax revenues are soaring: federal revenues in the past 12 months are up 27% from the year-ago period, with the result that the deficit has collapsed (Chart #4). The rolling 12-month federal deficit was $1.04 trillion just before Covid; it peaked at $4.1 trillion one year ago, and has since fallen to $1.74 trillion. It's good that the spending and printing spree has subsided, but the legacy of debt and monetary expansion is still with us. 

Chart #5

Chart #5 shows the demand for M2, which technically is referred to as the inverse of M2 velocity. (See this post from last January for a more detailed explanation.) Money demand (M2/GDP) is a decent proxy for the percent of the average person's annual income that he or she wants to hold in the form of cash, checking and savings accounts (which together comprise M2, the sum of all readily-spendable money). For many years the country's currency and bank deposit holdings were 55-60% of annual income. Yet now they are a staggering 90%. Money demand typically rises during times of turmoil, and this was quite obvious in the wake of the Great Recession of 2007-2009. It was even more so in the wake of the disastrous Covid lockdowns. It's only natural that people should want to stockpile money in times of great uncertainty.

But now that things are getting back to normal and the economy has largely recovered from the disastrous Covid lockdowns and restrictions, we are likely to see a decline in money demand. And indeed there has already been a decline of about 4% since the initial surge in Q2/21. On the margin, people are no longer desirous of holding so much money, so they are trying to spend down their money balances, and that is what is fueling the resurgence of consumer demand. For more details, see my post from last year: "Argentine inflation lessons for the U.S."

There are two ways for M2/GDP to decline: 1) slower M2 growth and/or 2) faster nominal GDP growth, which almost certainly entails higher inflation (because nominal GDP has two components: real growth and inflation, and real growth is unlikely to increase by more than 2 or 3% per year). If the Fed stays behind the curve (i.e., by not raising rates enough), then higher inflation will work to reduce the ratio of M2 to GDP. 

Today the FOMC announced plans to shrink its balance sheet starting next month, but they are not very aggressive, and will be accomplished mainly by not reinvesting maturing securities. Outright sales of securities, when they do occur, won't be large and should be easily digested by the bond market. The Fed also announced a 50 bps rise in short-term rates (the overnight funds rate is now 1%) and plans to raise rates in 25 and 50 bps increments in a cautious fashion. The bond market currently expects the funds rate to top out around 3¼ - 3½% in a year or so. All told, rate hikes will be quite modest as will the reduction of the Fed's balance sheet. Will that do the trick? We'll have to wait and see, but the Fed is still far from taking aggressive steps to curtail M2 growth and/or to shore up money demand. 

Interesting math exercise: Suppose M2 continues to grow at 6% per year, the public reduces its money balances to the pre-Covid level of 70% of GDP over the next three years, and real GDP grows by 2% per year. What would the annualized inflation rate be for the next three years? Answer: about 10%. That gives you an idea of the inflationary potential of the current level and growth rate of M2.