


The stock market rally that began in mid-June has been driven almost exclusively by the realization that the risk of the Fed over-tightening in order to fight inflation has declined meaningfully. That realization, in turn, has been driven by a growing body of evidence which points to a perceptible lessening of inflation pressures: an impressive slowdown in the growth of M2 this year (which I last documented here), a rather impressive selloff in the commodity markets (Chart #5 in this post), and a distinct cooling of the real estate market (a sudden slackening in housing demand has allowed mortgage rates to decline from 6% to 5% in just the last month). At the same time, there is very little evidence to suggest that the economy is in distress: swap spreads remain relatively low (i.e., liquidity is abundant, the opposite of what we would expect to see if monetary policy were actually tight), and credit spreads are only moderately elevated (i.e., the outlook for corporate profits remains healthy), and of course jobs growth remains robust (July job creation was surprisingly strong).
In any event, the debate over whether the economy is in a recession hardly matters. If inflation is cooling, the Fed has no reason to raise rates until the economy collapses. If the bond market is right (and it usually is), then the Fed is likely to raise rates from today's 2.5% to a peak of maybe 3.25% in the next 6 months or so, and that is simply not the stuff of which recessions are made.
Chart #1

Chart #1 shows that business activity in the all-important service sector of the economy (the source of about 75% of GDP) remains healthy. Not booming, but well above levels that would be consistent with a recession.
Chart #2

Since the vast majority of commodity prices having fallen significantly from their recent highs, a much smaller number of manufacturers now are reporting paying higher prices (Chart #2).
Chart #3
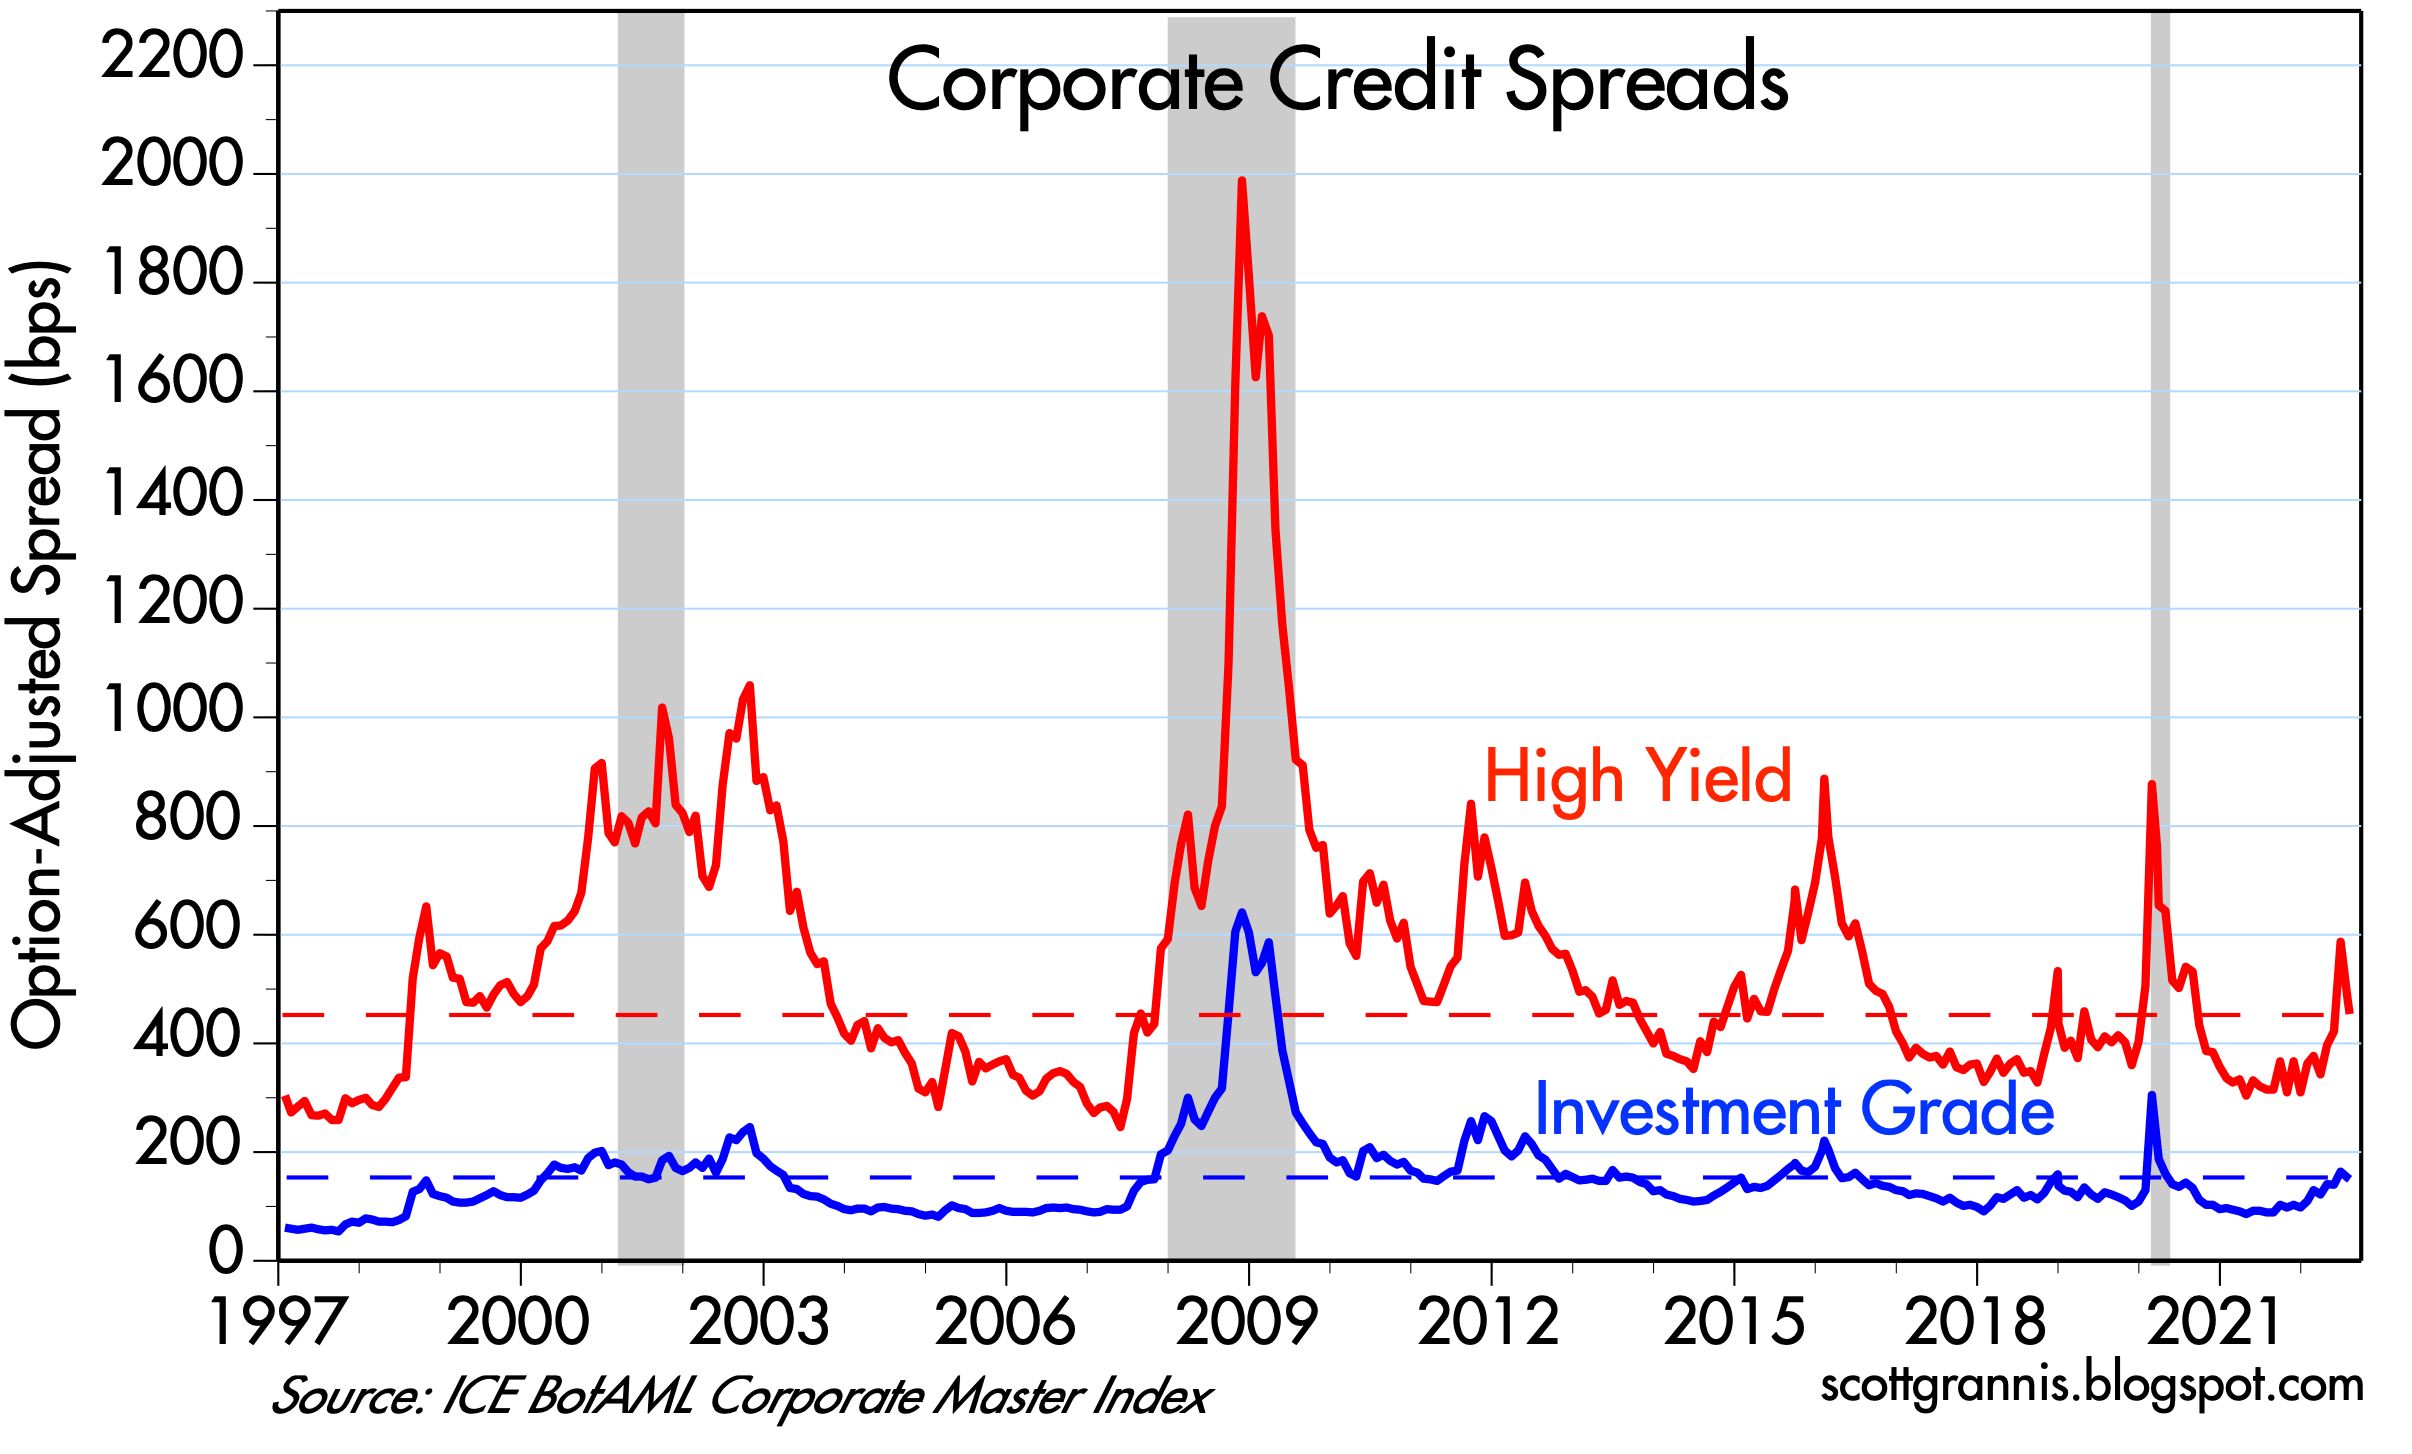
Chart #3 shows the level of spreads of investment grade and high yield corporate debt. This is the difference between the yields on corporate bonds and the yield on comparable maturity Treasury bonds, an excellent indicator of corporate credit risk, which in turn is heavily influenced by the outlook for the economy and corporate profits. This is pretty good evidence that the economy is not in a recession. (I'm no fan of Biden, but he is not crazy when he claims the economy is not in recession.)
Chart #4
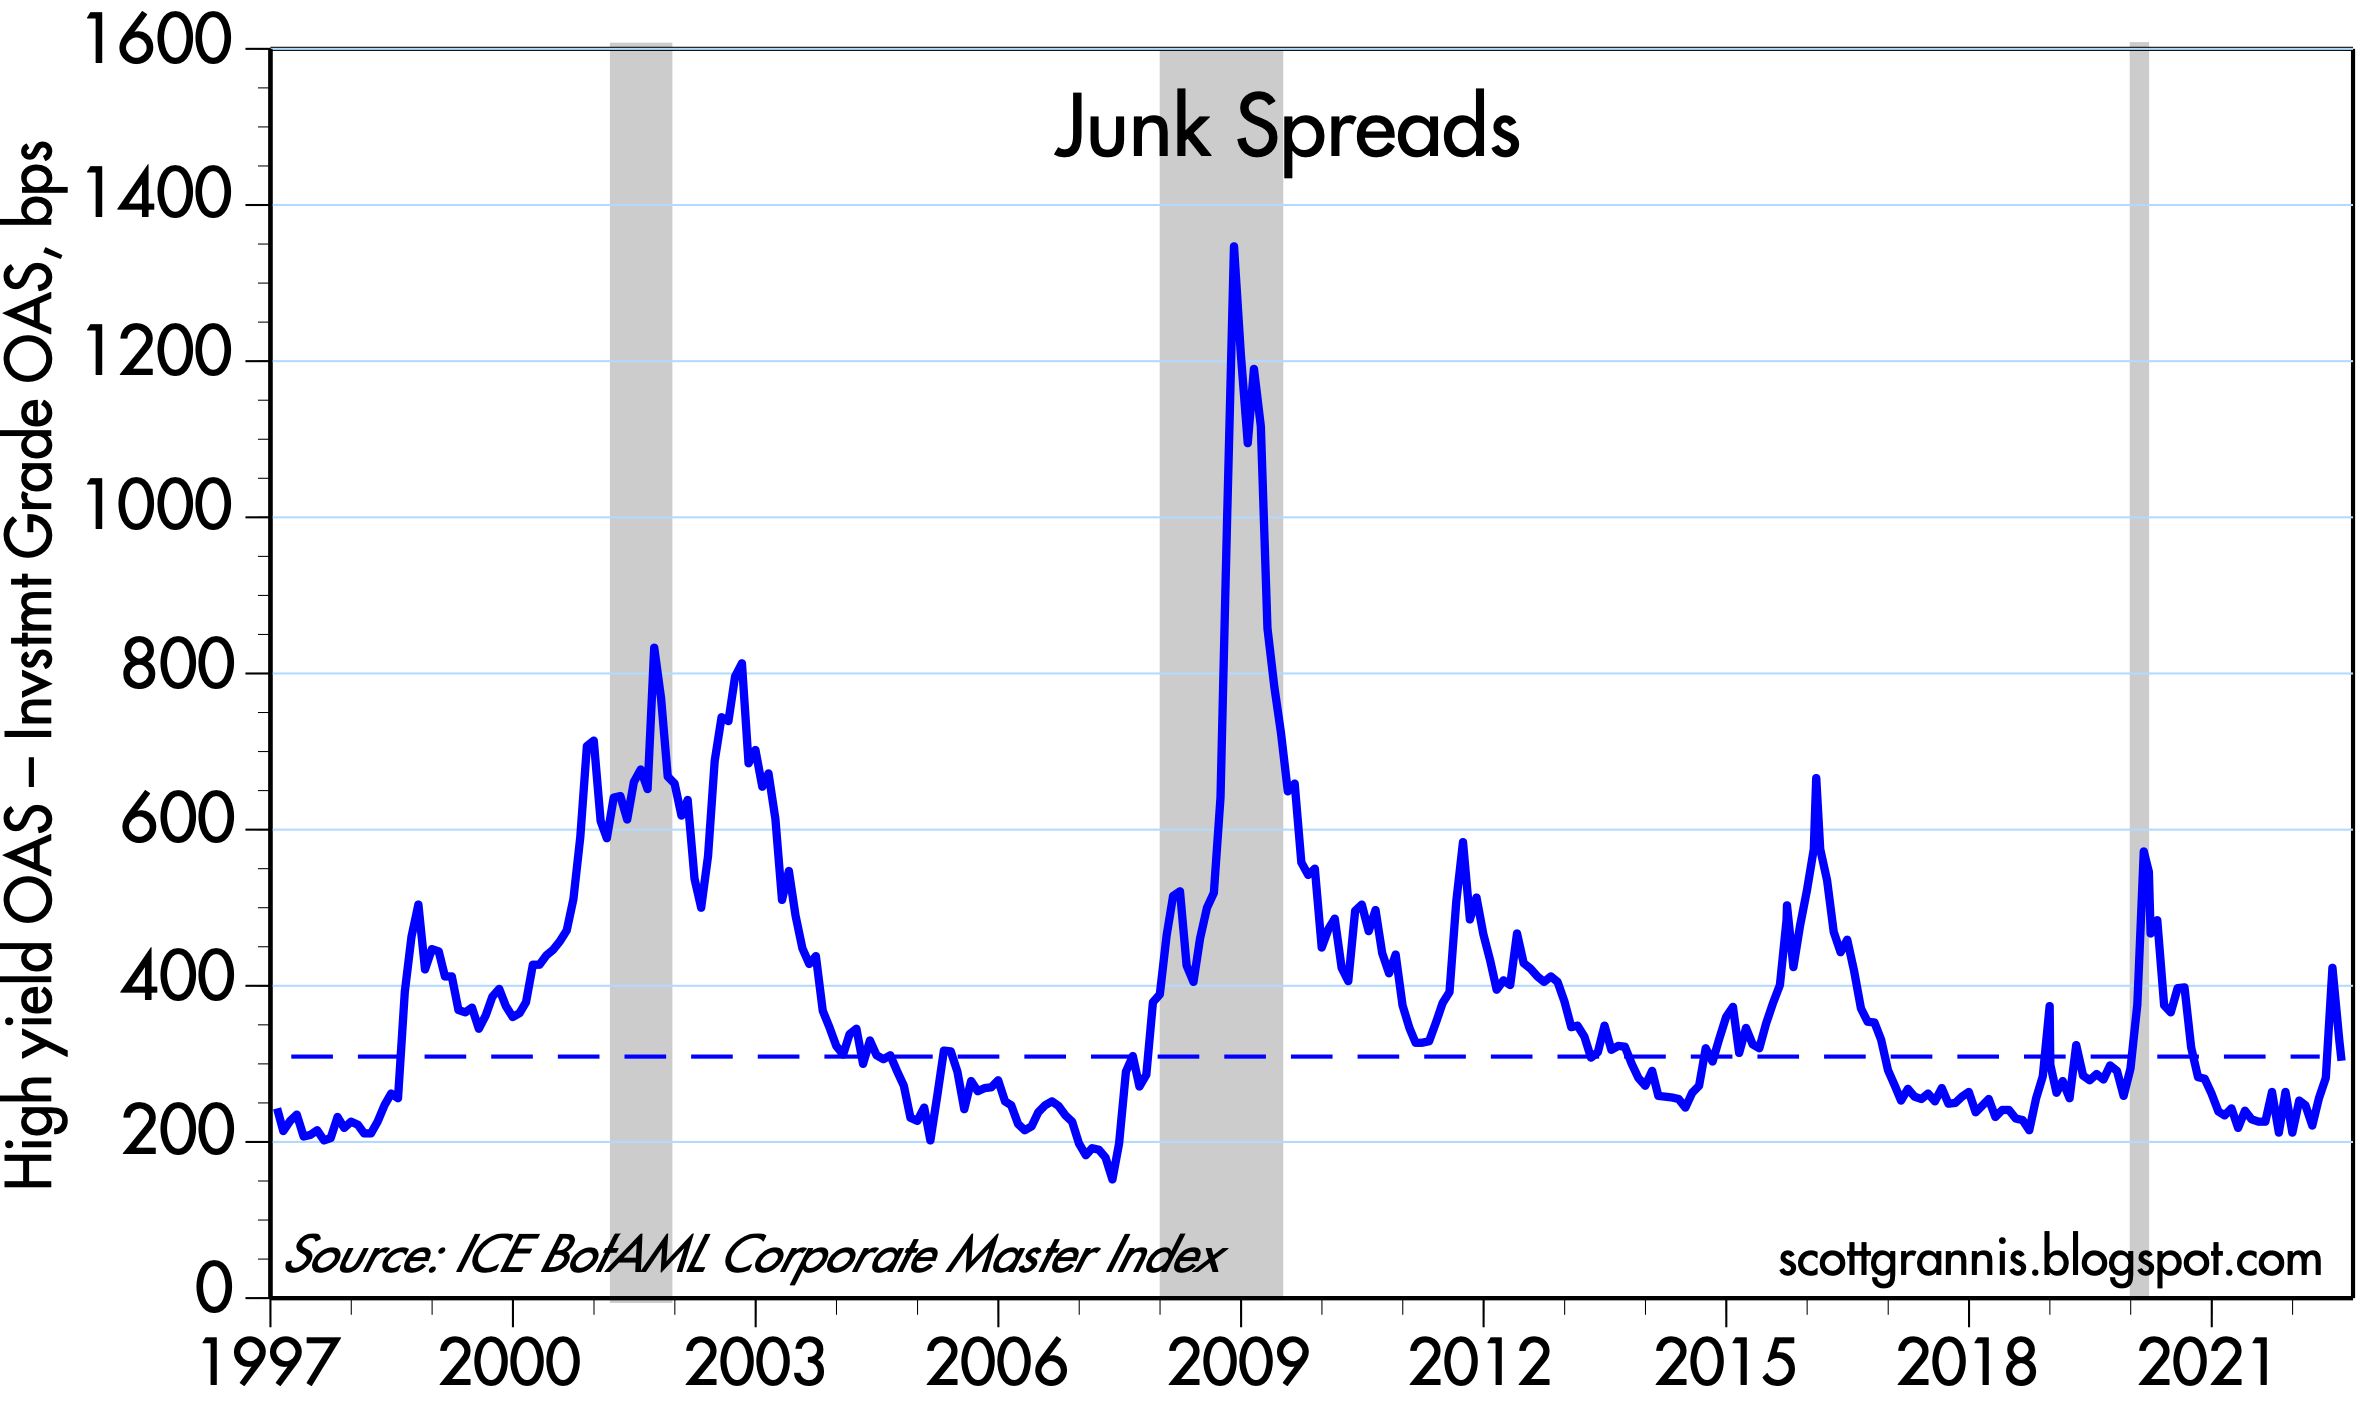
Chart #4 is simply the difference between the two lines in Chart #3, which is commonly referred to as the "junk spread." Today, junk bonds (corporate bonds rated below investment grade) are priced to a fairly modest level of risk to the economy. If we were in a typical recession they would be substantially higher.
Chart #5

Chart #5 compares the number of jobs in the private and public sectors of the economy. Private sector jobs have now fully recovered from their pre-Covid levels, but they have yet to make significant gains. In the absence of the Covid shutdowns, they would likely be at least 3-5 million higher. Public sector jobs, in contrast, haven't budged for over a decade! That's progress in my book; private sector jobs are much more productive than public sector jobs.
Chart #6

Chart #6 shows the level of the civilian work force—the portion of the population that is of working age and willing to work. This is an excellent example of the failure to thrive. Today's workforce is at least 18 million people smaller than it might have been with different incentives. Meager growth in the number of people working or willing to work translates directly into subpar growth for the economy as a whole (most small business owners continue to report that one of their biggest problems is being unable to fill job openings).
Things could be better, but they could also be a lot worse.

9 comments:
Excellent post - love this blog! Thanks.
NBER’s Business Cycle Dating Procedure: Frequently Asked Questions
https://www.nber.org/business-cycle-dating-procedure-frequently-asked-questions
The monetary authorities just don’t get the benefits of N-gDp targeting.
https://www.federalreserve.gov/monetarypolicy/files/FOMC20161014memo02.pdf#:~:text=With%20a%20sufficiently%20large%20quantity%20of%20reserves%20in,reserve%20targets%20would%20help%20support%20the%20same%20objectives.
Authorized for public release by the FOMC Secretariat on 1/14/2022
“With a sufficiently large quantity of reserves in the banking system, the Federal Reserve could choose to set reserve requirements to zero as they are not needed for interest rate control.”
"The neutral rate of interest (also called the long-run equilibrium interest rate, the natural rate and, to insiders, r-star or r*) is the short-term interest rate that would prevail when the economy is at full employment and stable inflation: the rate at which monetary policy is neither contractionary nor expansionary."
By dismissing the importance of money, it will guarantee that the FED will always be behind the curve. Interest is the price of credit. The price of money is the reciprocal of the price level.
Scott, another nice presentation. Any thoughts on Wednesday’s CPI number? The consensus seems to be 8.7% which implies a drop of .4% for the month. Yet core inflation is forecast to be up .6% and is a big piece of the CPI. Last years July CPI was up.5%. So overall inflation for July would have to be flat to get to 8.7%. There are so many lagging and adjusted numbers, I am at a loss.
re July CPI: the market expects CPI to rise by 0.2% in July, which would result in 8.7% year over year. Core CPI is expected to rise 0.5%, for 6.1% year over year. The reason for smaller rise in the headline CPI vs core CPI is primarily gasoline, which is down 20% in the past two months. I don't have a reason to think market expectations are off. The big-picture take on this is that we have probably seen the peak in inflation pressures and thus the year over year comparisons are going to be declining in coming months.
Scott, thank you for your reply. It sounds logical but I am uncertain as the FED and experts have been wrong literally 100% of the time the last 12 months with their underestimation of inflation. Except for gasoline I see no items with declines in July. Yes gasoline has fallen 20% from its spike peak just over $5/gallon on 13 June. That is significant and very visible to all Americans. Eyeballing the charts though suggests that the average price of gasoline for June was $4.75-$4.80/gallon, so 4-5% of that 20% drop is in the June CPI number. It also appears that for July, the average price of gasoline was in the vicinity of $4.35-$4.40 so the actual drop in July for the CPI is 10% or less. With gasoline accounting for 4% of the CPI it’s significant, but not huge. Appreciate immensely your excellent work and look forward to tomorrow’s report.
Scott, let's say inflation has peaked (seems likely), and relatively quickly drops to, for example, 5-6% p.a. But based on partially baked-in inflationary psychology, it stubbornly hovers around that mid single digit rate for longer than expected. Let's also assume GDP growth is in non-recession-but-weak range of 1% or so. In that scenario, does the bond market's prediction of Fed cutting rates in 2nd half of 2023 come to pass? Are current treasury yields (either short, medium, or long-term) rational in that environment? Everyone is talking about inflation having peaked. I can buy that. But I'm not hearing people talk about what happens if the inflation floor remains stubbornly/unacceptably high. That's why my personal opinion is that long-term treasury yields are likely to prove too low. Thank you.
Mark: it's hard to dispute your argument since I'm in your camp, having speculated that while inflation pressures have peaked, we won't see much of a decline this year. I too wonder if the market will stumble in the presence of persistently high—albeit falling—inflation. History shows the market does a good, if not perfect, job of "looking across the valley of uncertainty." Meanwhile, I'm hoping that M2 growth remains very low, and that the demand for holding all the M2 remains strong. If the House passes the IRA, economic growth will remain sluggish and inflation pressures may increase somewhat; knowing that, many are likely going to be content to sit on an unusually large amount of cash for longer.
July CPI came in better than expected (i.e., lower). Further confirmation that inflation pressures have peaked. Very good news. The Fed may raise rates one more time, then if M2 is well-behaved, they will be done. The only cloud on the horizon right now is Biden's IRA, which is about the dumbest thing he and the Dems could do at this point. This will create headwinds to future growth, unfortunately, unless by some miracle some congress people decide to abandon the sinking Biden ship.
Post a Comment