Wednesday, February 24, 2021

Reflation update: it continues!

The reflation theme is alive, well, and prospering. Today, Fed Chairman Powell himself told the world that.

He sees a long road to recovery, he's not concerned about rising prices, and he plans to keep short-term rates low for a long time.

And it's not just stocks that are benefiting. Here is a modest collection of charts that I'm currently tracking with interest:

Chart #1

As Chart #1 shows, copper prices are exploding to the upside even as gold prices hold relatively steady. The world is rebuilding and speculators are jumping on the commodity price bandwagon. The dollar is somewhat weak, but I think the chart tells us that a weaker dollar is not telling the whole story. Today the dollar is only slightly weaker than its average over the period of this chart, but copper prices (adjusted for inflation) are much higher than their average. Gold, by the way, is not looking good even though the world is reflating. That can only suggest that gold hit an all-time high several years ago in anticipation of what we are seeing today.

Chart #2

Chart #2 compares 10-yr Treasury yields (red line) to the ratio of copper to gold prices (a good proxy for global growth expectations). This reaffirms the view that we're in a reflation. Not only are inflation expectations rising, but industrial commodity prices are too, as is construction activity in general. 10-yr Treasury yields are up because the world is feeling a little less concerned about the economy remaining weak forever. More inflation and more growth mean higher yields, it's that simple. And yields have plenty of room on the upside (i.e., bonds are a terrible investment these days).

Chart #3

Chart #3 updates a chart I haven't featured for a long time. Given all the weakness in the economy in the past year, I was surprised to see that commercial real estate prices last December reached a new all-time high. Malls may be empty and downtown businesses and restaurants may be abandoned, but no one is giving up on the idea that we'll get back to normal before too long. Easy money, low borrowing costs, and the fact that life is not going to go dormant anytime soon all add up to the expectation that the physical side of the economy is going to be picking up for the foreseeable future. SPG (Simon Property Group) has more than doubled since early November. 

Chart #4

Chart #4 is a perennial classic that shows how equities are performing relative to gold prices. Typically, equities underperform in times of hardship and outperform in times of plenty. This ratio has a ways to go before it returns to the 5-handle highs last seen in 2000. 

Chart #5

Chart #5 is also a long-time favorite that I haven't featured in awhile. As I see it, the equity market tends to lead truck tonnage (a proxy for the health of the physical economy). Equities are effectively pricing in a full recovery and the eventual attainment of new all-time highs for GDP. This may worry the bears, however, but I would argue that the economy won't be at serious risk of a downturn until the Fed tightens by a ton, the yield curve flattens, and real yields rise significantly. And we're a long ways from those things happening.

This is not to say, however, that I see real GDP growth averaging more than 2% per year in the years to come. Things are definitely improving right now, but I think one's enthusiasm should not go unchecked. The policies favored by the Biden administration are not going to optimize economic health or maximize economic growth. And a multi-trillion dollar "stimulus" plan is going to do just the opposite of stimulating the economy. I'm hoping that clearer head prevail in Congress. Beware economic "stimulus" plans: they never work and they usually just make things worse. The government simply cannot spend money more efficiently than letting people spend their own money.

Chart #6

Chart #6 shows the makeup of inflation expectations that are priced into the bond market. Inflation is expected to average almost 2.5% per year for the next 5 years. We've seen something like this before, but nothing much worse than that. (I think we'll end up seeing worse.) Note especially the extremely low level of real yields (blue line). This can mean two things: 1) the market expects economic growth to be sluggish for the foreseeable future and that means low real yields in general, and/or 2) since TIPS are the safest and surest way to protect against inflation (TIPS pay a coupon equal to their real yield plus the rate of CPI inflation), and since the Fed is pledging to keep short-term rates very low for a long time, the Fed is effectively putting an artificially low cap on the level of all real yields, which forces investors to pay artificially high prices—and receive artificially low real yields in exchange—for inflation hedges. I'm inclined to think that both forces are working at present.
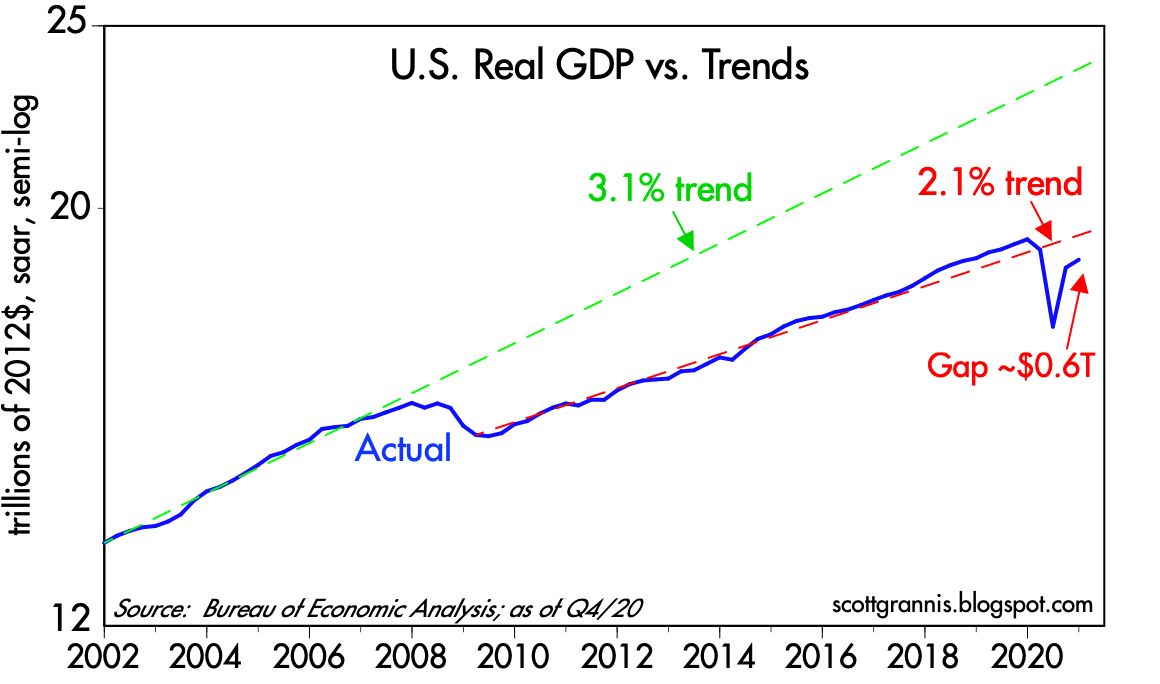
Chart #7

Chart #7 has been featured regularly for a long time. The market's level of fear (red line) is elevated but not excessively so, which allows equity prices to drift irregularly higher, hitting air pockets of panic along the way. Over the 3+ year period shown in the chart, an investment in the S&P 500 has produced an annualized total return of about 15% per year (including reinvested dividends). Not bad, considering all the air pockets and potholes along the way! 

Of course that also suggests that one should keep their hopes for the future from running wild. Stocks can't go up like this forever. 

UPDATE: (Feb 25th) As Chart #8 shows, capital goods orders (the precursor of future productivity gains and thus an excellent leading indicator of economic growth) have surged in recent months, far exceeding expectations and breaking out of a prolonged slump. This is perhaps the most optimistic chart in my basket.

Chart #8


Tuesday, February 16, 2021

It's all about reflation now


Just about the entire world economy is in the grips of reflation. What's reflation? My definition of reflation is when economic activity and prices are all moving higher. Economic growth is returning to almost every country in the world, and almost all commodity prices are rising. Reported inflation is still "tame," but inflation expectations are rising. The Fed has determined that they want inflation to be higher, and they are getting their wish.

This now poses an excruciating dilemma for most investors: while it is certainly nice for prices and economic growth to be increasing, this creates significant risks for fixed income investors, since eventually interest rates will have to rise as well. 10-yr Treasury yields have already risen from a low of 0.5% to now just over 1.3%, but they will have to go much higher still to be competitive with inflation, which will soon be running at a solid 2% per year, on the way to perhaps 3-4%. But as interest rates rise commensurate with the return of inflation, that will subtract significant support from equity prices. And once the Fed decides that inflation has moved up by "enough," whatever this is, then short-term interest rates are almost surely going to rise, and significantly. That's otherwise know as "tight" money, which has traditionally been anathema to the equity market, and eventually to the economy.

The Fed's current monetary policy stance, in short, is not sustainable. Sooner or later they will be yanking the punchbowl. Many observers realize this, but no one knows how long the current situation can last. The Fed has convinced the bond market that short-term interest rates are going to be pegged at extraordinarily low levels for the next two years. I sincerely doubt the Fed will be able to stick to this promise.

And then there is the issue of fiscal policy, which seems almost like a runaway train under the leadership of  President Biden (with an assist from not-so-conservative Republicans). Our national debt is now 100% of GDP and likely to rise further if Biden gets his wish. That sounds outrageous, but it's not really a problem—for now, at least—because the cost of servicing that debt is very low, a mere 2.3% of GDP, thanks to extremely low interest rates (courtesy of the Fed).

The thing to worry about is the direction of fiscal policy, which will almost certainly bring us higher taxes, increased regulatory burdens, and more expensive energy. 

To be fair, higher inflation combined with today's very low interest rates will lighten Treasury's debt burden significantly over time. Treasury reaps a bonanza with every bond it sells, since interest costs are less than inflation across almost the entire yield curve, while inflation lifts income and revenue streams which in turn increase tax revenues. A good deal of today's debt can be paid off with cheaper dollars tomorrow. Of course, that also means that those holding Treasury debt are losing money every year—in the form of lost purchasing power. Bond investors don't like that, but most institutional fixed-income investors don't have the ability to dump bonds in favor of higher-yielding equities. So it's like watching a train wreck in slow motion. 

Unfortunately, it's never a good idea for the public sector to "steal" money from the private sector via an inflation tax. Argentina has been doing that for generations now, and the economy and its people are a wreck. People catch on: capital leaves for safer locations, money is poured into inflation hedges, and long-term investment projects face higher hurdles because of greater uncertainty. The poor and the ignorant among us suffer the most. Already we see commodity prices, real estate values and equity markets levitating. 

Potential disaster is not imminent, but it is certainly on the horizon. No one with foresight is sleeping easy these days.

Some charts to round out the story:

Chart #1

For the past three decades there has been an impressive correlation between 10-yr Treasury yields (the benchmark for nearly all global bond yields) and the ratio of copper to gold prices, as shown in Chart #1. Copper prices rise as global economic activity picks up, and although you might expect gold to rise with inflation expectations, that is not always the case. In fact, it could be argued that gold prices rose some years ago in anticipation of the rising inflation that we are seeing today. Moreover, stirrings of economic life and higher interest rates pose challenges to holding gold, since it pays no interest or dividends and must be stored. This chart suggests that interest rates are only just beginning to turn higher. Copper and nearly every other commodity are up quite strongly since last March; crude oil prices have nearly tripled over the same period. 

Chart #2

As Chart #2 shows, for the past 15 years gold prices have been highly correlated with the price of 5-yr TIPS (the chart uses the inverse of their real yield as a proxy for their price). It also suggests that gold tends to lead TIPS prices. Gold prices started to decline last year, and recently we have seen signs that TIPS prices are beginning to decline (i.e., real yields are starting to rise after hitting the extremely low level of almost -2%). Real yields also tend to rise as economic activity picks up. It all ties together.

Chart #3

Chart #3 shows two measures of corporate credit spreads, which are a good barometer of the outlook for corporate profits. A growing economy and rising prices are good news for most businesses, and the outlook for corporate profits is robust; that's why spreads are quite narrow.

Chart #4

Chart #4 compares the nominal and real yields of 5-yr Treasuries; the difference between the two is the market's expectation for what the CPI is going to average over the next 5 years. Here we see that inflation expectations have soared since last March, and now exceed 2.3%. For reference, the CPI ex-energy has risen about 2% per year for the past decade. 

Chart #5

On the pessimistic side of the ledger we have a big and fairly recent decline in small business confidence, as shown in Chart #5. Confidence soared following the election of Trump in late 2016, and it has almost completely reversed thanks to Biden's promise of higher taxes and more regulations. The economy is is likely to continue growing, but it's not going to be growing at a gangbuster level. I discussed this in my previous post, and I continue to think that 2% annual growth is the best we're going to see for the next several years.

Chart #6

Chart #6 shows how much the current level of air travel has dropped from the same period a year ago (i.e., pre-Covid). Air travel has not improved very well in recent months and is still almost 60% below the levels of a year ago. This speaks to the lack of confidence on the part of consumers and individuals in general. It's reasonable to expect things to improve for the rest of the year, but it will likely take a long time to get back to what used to be "normal" levels.

Chart #7

Chart #7 shows the number of daily new Covid cases in the US as of yesterday. Things are really improving! And not just in the US: most countries around the world are seeing similar improvement, and this can only get better as vaccinations spread. My friend Brian Wesbury has a nice collection of Covid-related charts and factoids here, one of which shows that more than 40% of the US population has most likely already acquired Covid-19 immunity. In the US, daily new cases are down 65% in the past month, and in California, daily new cases are down a whopping 80% over the same period. Why aren't we hearing more about this? This is fantastic news, so why is Biden still preaching doom and why are so many teachers still afraid to go back to school?

Chart #8

Chart #8 shows why Fed tightening has invariably led to recessions. Fed tightening happens when real yields rise (blue line) and the yield curve flattens (red line). Note that every recession on this chart has been preceded by a big increase in real yields and a big flattening or inversion of the yield curve. It should also be clear that these two critical predictors of recession are nowhere close to the point at which we should become worried. As I said before, disaster is not imminent, but it is on the horizon.

Chart #9

Chart #9 shows that the current burden of federal debt is historically low, despite the fact that federal debt equals 100% of GDP, a level not seen since the days of WW II. It's all about today's very, very low interest rates. A cynic might argue that the Fed is keeping interest rates extremely low in order to bail out Treasury and support politicians' urge to pass "stimulus" bills which threaten to add yet more trillions to our national debt. (But do remember that fiscal "stimulus" of the sort that hands out money and subsidies and tax breaks to favored groups and industries does almost nothing to create real stimulus. Real stimulus requires policies which create incentives for people to work and invest more. Sadly, no one is even thinking about genuine stimulus these days. Old-fashioned "stimulus" such as Congress is currently considering will only sap the economy's strength over time.) 

Chart #10

Finally, Chart #10 shows the current state of the equity market. Fear is still out there, but not excessively so, and so prices continue to drift higher. 

Once again I'd like to recommend subscribing to my friend Steve Moore's excellent (and free) newsletter, which you can sign up for here.

Monday, February 8, 2021

The (destructive) power of transfer payments

This post is meant to be a companion piece to my previous post, particularly in regards to why it is that the economy has lost so much of its growth potential.


The first of these two charts shows the ratio of transfer payments (e.g., social security, welfare, unemployment insurance, Covid-related payments) to disposable personal income. Thanks to government edicts which effectively prohibited large swaths of the population form working, the government "naturally" felt obligated to take care of those individuals by boosting weekly unemployment payments and sending out one-time checks to countless millions. The result was a literal explosion of government spending that approached $3 trillion dollars. 

The second chart shows the labor force participation rate (i.e., the ratio of those working to the working age population).

To me, the interpretation of these charts is obvious: when the government pays you more for not working, you get fewer people working. Fewer people working means a smaller economy, and that goes a long way to explaining why it is that the current outlook for future economic growth is grim, as I explained in my previous post.

Corollary: As government spending consumes a greater portion of economic output, economic growth becomes weaker. 


Wednesday, February 3, 2021

Keep on borrowing and buying

Despite a catastrophic decline in GDP in the first half of last year, the US economy managed to stage an almost complete rebound in the second half. By the end of 2020 the economy was only 2.5% smaller than its year-end 2019 level. Most observers expect at least a few more strong quarters of growth, which will almost certainly allow the economy to break new high ground within the next several months.

Unfortunately, economic growth is not about to set any long-term records. For 50 years, from 1966 through 2007, the US economy grew at an average annualized rate of about 3.1%—a great and dynamic expansion which saw the economy almost quintuple in size. The came the Great Recession of 2008-9. Not only did the economy fail to recover to that long-term 3.1% trend in subsequent years—for the first time ever, following a recession—it went on to post only slightly more than 2.1% annual growth in the decade from 2009 through early 2019. It was the weakest economic expansion on record, and it looks set to continue for the foreseeable future, I'm sorry to say.

Chart #1

Chart #1 uses the magic of a logarithmic y-axis to show how the US economy followed a 3.1% annualized growth track for 50 years. (With a logarithmic y-axis, a line with a constant slope represents a constant rate of growth.) Then, beginning in 2009, it managed to grow only 2.1% per year for the subsequent decade. (See this post for more details as to why.) We've been living in a sub-par recovery since I first anticipated it back in early 2009, thanks to too much regulation, high taxes, and too much government spending. Those same forces will act as headwinds for the economy in the years to come, with Biden promising a virtual replay of all of Obama's anti-growth policies—and possibly even more. Slow growth has left the economy substantially weaker and smaller (by about $4.5 trillion per year, as shown by the gap between the blue and green lines) than it might have been had the prior 3.1% growth trend persisted. 

Chart #2

Chart #2 is similar to Chart #1, but it zooms in on just the past two decades. The green line shows the same 3.1% trend growth rate that features in the first chart. The dashed red line shows the trend that persisted throughout the Obama years and into Trump's first year. Note how the economy perked up a bit in 2018 and 2019 as Trump's policies boosted growth above the 2.1%, a period which culminated in record-breaking real household median income growth, as shown in Chart #3.

Chart #3

The US economy would need to grow by 5.2% (after inflation) this year in order to reattain its 2.1% trend growth by the end of this year (see Chart #2). Most analysts are optimistic, but few, if any, expect growth to exceed 5%. I wouldn't be surprised if it did, however, but I would not expect to see more than 2% annual growth beyond this year, especially if Biden manages to implement his green energy policies and higher taxes on wealth and business. Looking long-term, we're likely to be stuck in a slow-growth world, much as we've seen over the past decade or so.

Chart #4

Near term, though, growth should be pleasantly robust, as the economy emerges from its Covid travails and a return of confidence boosts consumer confidence and business investment (see Chart #4, which shows capital goods orders, which are a good proxy for business investment). There's a lot of slack in the economy that will be put back to work as the Covid problem slowly recedes; already, daily new Covid cases are declining nearly everywhere and vaccinations are proceeding at an impressive pace. At the same time, Covid-related restrictions have forced the economy to do more with fewer resources, thus providing a one-time boost to productivity, which surged at a 7.5% annualized pace in the second and third quarters of last year and likely closed out the year on an unusually strong note.

Chart #5

Not all is sweetness and light, however. Chart #5 compares the real yield on 5-yr TIPS to the 2-yr annualized growth rate of GDP—not surprisingly, real yields tend to track the real growth potential of the economy. With 5-yr real yields now abysmally low (-1.8%), we can infer that the market sees very little growth potential for the US economy in the years ahead. A charitable interpretation of this chart would suggest the market expects real economic growth to average about 1-2% per year for the foreseeable future. Thus, although my expectation for 2% annual growth seems rather modest in an historical context, I'm only essentially agreeing with the market's expectations.

This modest growth outlook would ordinarily not provide much support for equity prices. However, in the context of a zero-percent cash environment, equities still have a better expected return than cash or cash equivalents. And with the Fed seemingly determined to keep short-term rates very low for a long time (the market currently expects the Fed funds target rate to remain roughly unchanged for the next two years), the inflation-adjusted return on holding cash is going to be negative for a long time. Holding cash is virtually guaranteed to be a losing strategy in terms of purchasing power. And that effectively boosts the demand for just about anything and everything other than cash and short-term bonds. Equity, commodity, and real estate prices are all rising, and that's not surprising given the Fed's policy stance.

Chart $6

A final note: inflation expectations embedded in TIPS and Treasury prices are now approaching 2.33%, as Chart #6 shows. This cannot go on much longer, I fear. Sooner or later Treasury yields are going to have to start rising. But in the meantime, it pays to borrow, since interest rates are so low relative to inflation, and it pays to buy, since expected returns on non-cash assets are much higher. It's not unreasonable to think we are in the early stages of an inflating "asset bubble."

All of these considerations leave me nervously optimistic about the long-term outlook for equities. I don't think the Fed's desire to boost inflation is consistent with a long-term healthy economic outlook, because higher inflation will eventually undermine confidence and the economy. Unprecedented monetary expansion in recent years has not yet resulted in any significant increase in inflation, but only because the demand for cash has been extremely strong. Sooner or later the Fed will get its way and money demand will fall (market sages are fond of saying you should never bet against the Fed's ability to get what it wants, and I think they are right). But just how long the Fed can undermine the world's demand for cash and avoid an unhealthy increase in inflation is really the only issue at this point. If the Fed doesn't thread this needle just right, inflation expectations could become "unmoored," and that eventually would lead to a significant tightening of monetary policy which in turn would most likely result in yet another recession somewhere down the road.

Meanwhile, "borrow and buy" should continue to be your mantra, even if it makes you nervous.