


Yesterday (I'm writing this in Maui just before midnight Aug. 24th) the Fed released the July '22 M2 statistics, and they couldn't have been better. Year over year growth has fallen from a high of 27% in February 2021 (unprecedented!!) to now just 5.3%. On a 6-mo. annualized basis, M2 growth is a mere 0.6%, and on a 3-mo. annualized basis it's 1.0%. In other words, M2 has essentially flat-lined since last January, which was well before the Fed began to take tightening action. This means that the behavior of M2 is obviating the need for the Fed to pursue a typical tightening, which almost always ends with a recession. As I said last June, Fed tightening need not result in a recession.
It is now clear that the surge in money growth that began in April '20 was not due to misguided Fed policy. Instead, as I began to argue last May, it was a by-product of massive deficit-financed fiscal spending (aka Covid-era "stimulus" payments). Trillions of dollars were sent to massive numbers of people, and most of those dollars ended up in bank savings and deposit accounts, thus swelling M2. That was fine as long as the atmosphere of the Covid crisis persisted, since the government's supply of extra money was met by an increased demand for it. But by early last year, as the Covid crisis waned, confidence returned, and the economy got back on its feet, that extra money was used to fund an explosion of demand for goods and services everywhere, since it was no longer demanded. And that launched a wave of inflation which now looks to have peaked.
The issue of how the Fed should respond to all this is coming to a head this week, and it all happens at the Fed's Jackson Hole get-together. The market worries that the Fed will be spooked by all the confusion and tighten too much. That's why prices for equities, real estate, gold, and commodities are down. At the same time, the value of the dollar is soaring and that speaks volumes. When the price of something surges, it's a safe bet that demand for that thing exceeds the supply of it. So a very strong dollar is symptomatic of a world that is desperate for a safe haven—and one that is expected to soon yield more as the Fed panics and hikes rates even more, crushing the economy in the process. And it is also symptomatic of a Fed that is expected to be "too tight."
It doesn't need to play out this way, and I hope the Fed is listening. The world doesn't need a super-strong dollar, and higher rates are not necessary to slow inflation. Not this time, at least.
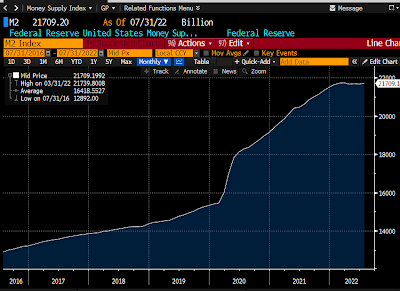
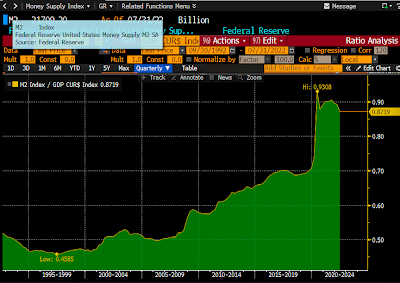

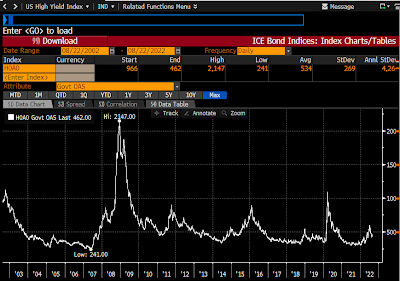
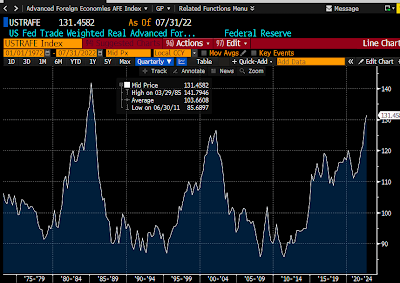
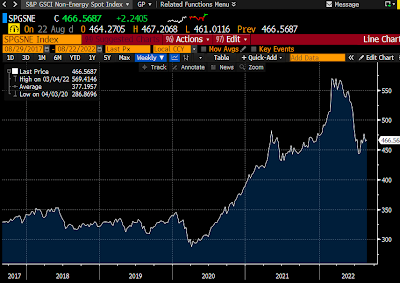
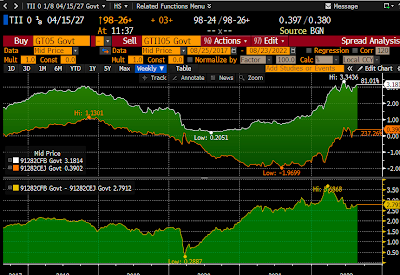
Chart #1

Since the deficit-financed spending spree stopped late last year, M2 growth has slowed dramatically (see Chart #3 in this post). Chart #1, above, puts the slowdown in a long-term perspective. It's virtually unprecedented. So it doesn't necessarily follow that Fed tightening this time will provoke a recession.
The passage of the recent, so-called Inflation Reduction Act is a step backwards, since it too involves more deficit-financed spending, but on a much smaller scale. So it is more likely to slow the economy than it is to accelerate inflation.
Chart #2

Chart #2 shows the ratio of M2 to nominal GDP. I have called this the demand for money. It is now declining, as I have been predicting. People wanted to hold a lot of money during the Covid panic, but not so much now. People have been spending down their money balances, and this is what has caused the rise in inflation: unwanted money. It is very likely to continue, but any increase in uncertainty, such as we are experiencing these days, is likely to mitigate the drop in the demand for money. Money demand is not in free-fall, at least for now. So inflation is not likely to explode.
Chart #3

Chart #3 shows the level of 2-yr swap spreads. Although they have increased somewhat of late, they are still at a level that suggests that liquidity is abundant and the outlook for the economy is decent, if not robust.
Chart #4

Chart #4 shows the level of high yield corporate bond spreads (junk bond spreads). These too are somewhat elevated, but not nearly as much as one would expect to see if the economy were on the verge of collapse.
Chart #5

Chart #5 shows the real, trade-weighted value of the dollar vis a vis other major currencies. The dollar is very close to record-high levels. This is not likely sustainable. A super-strong dollar is very bad news for commodities and commodity producers (e.g., emerging markets).
This is arguably the most important chart of all. The dollar is surging worldwide, and that is a big problem. The Fed should look at this and decide to take baby steps to raise rates, not giant steps. Message to Fed: don't restrict the supply of dollars at a time when the world wants more dollars.
Chart #6
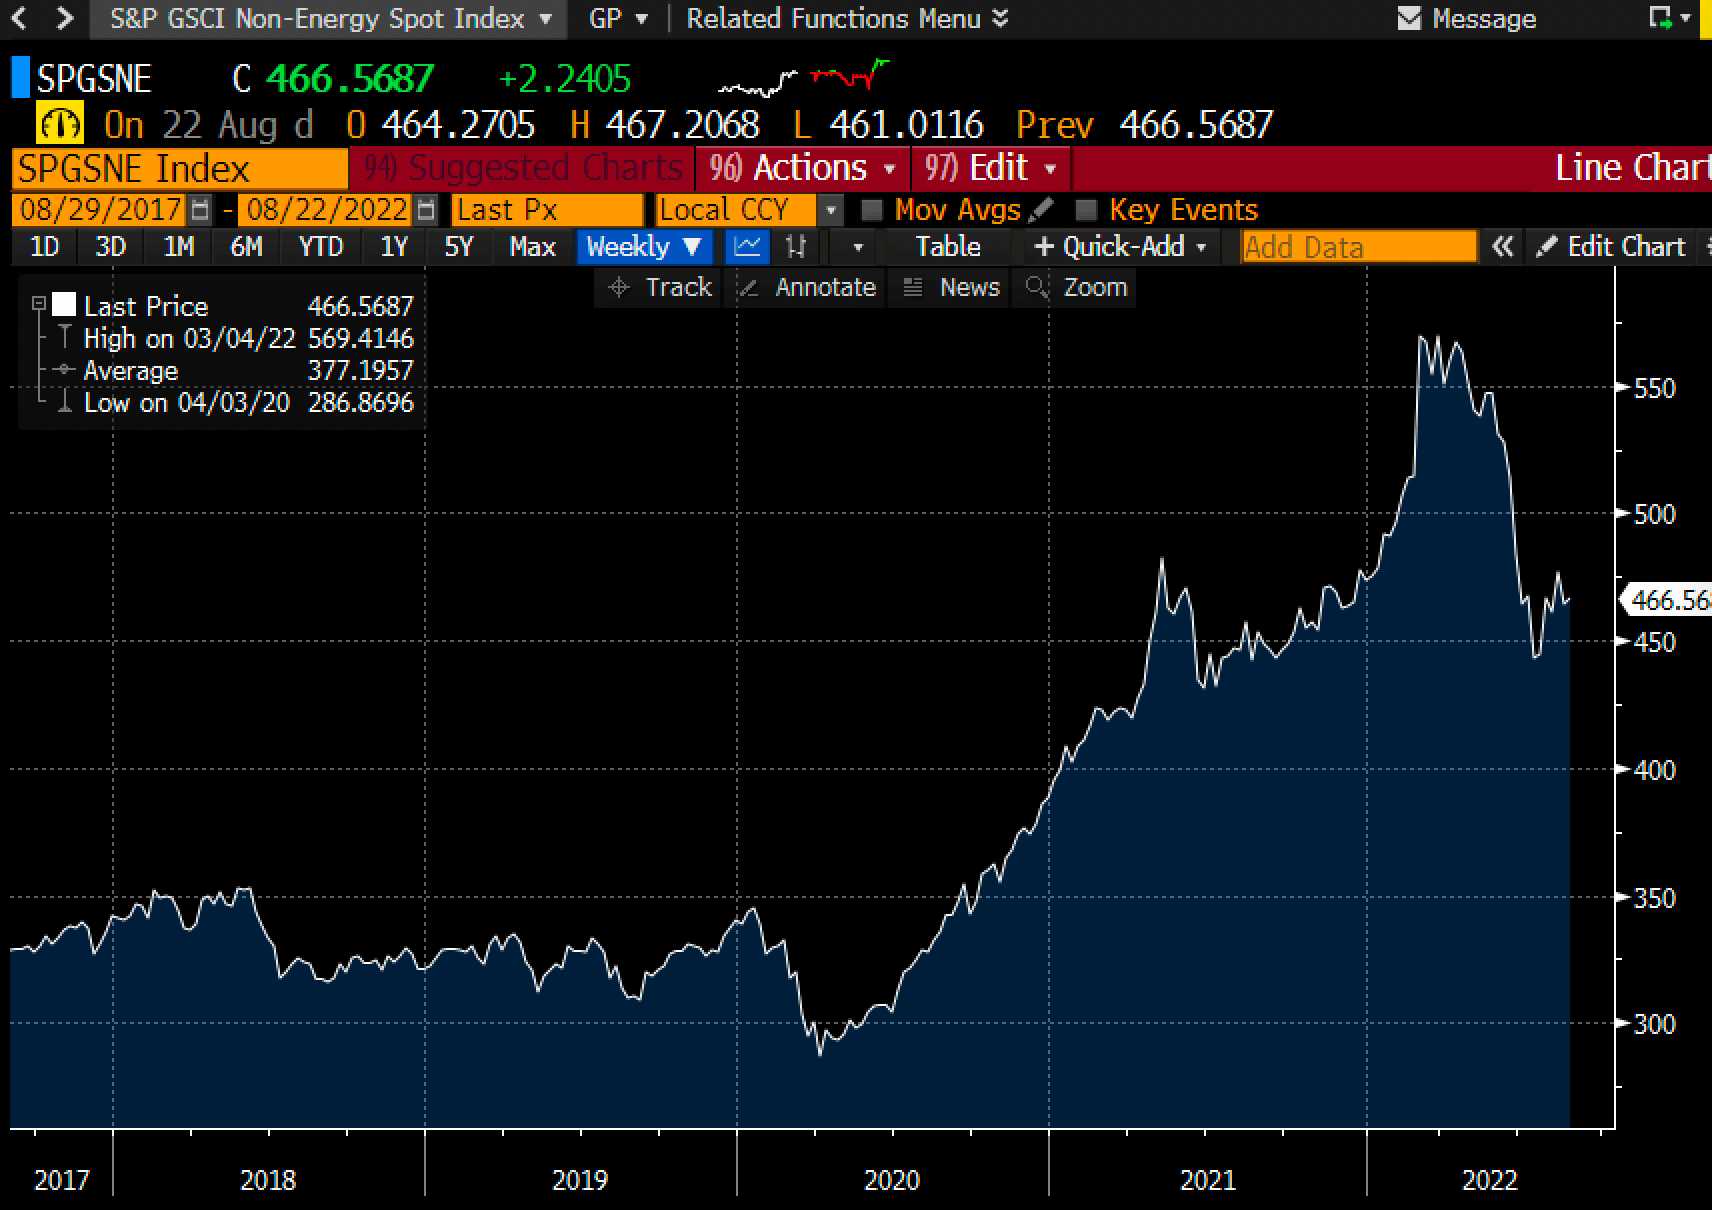
Chart # 6 shows the level of non-energy commodity prices. (Energy prices are far more volatile than most other prices, so it makes sense to exclude them at times.) These prices have experienced a sharp decline since earlier this year, at about the same time that the market began to expect the Fed to raise rates aggressively. Commodity prices are telling us that inflationary pressures have declined significantly.
Chart #7
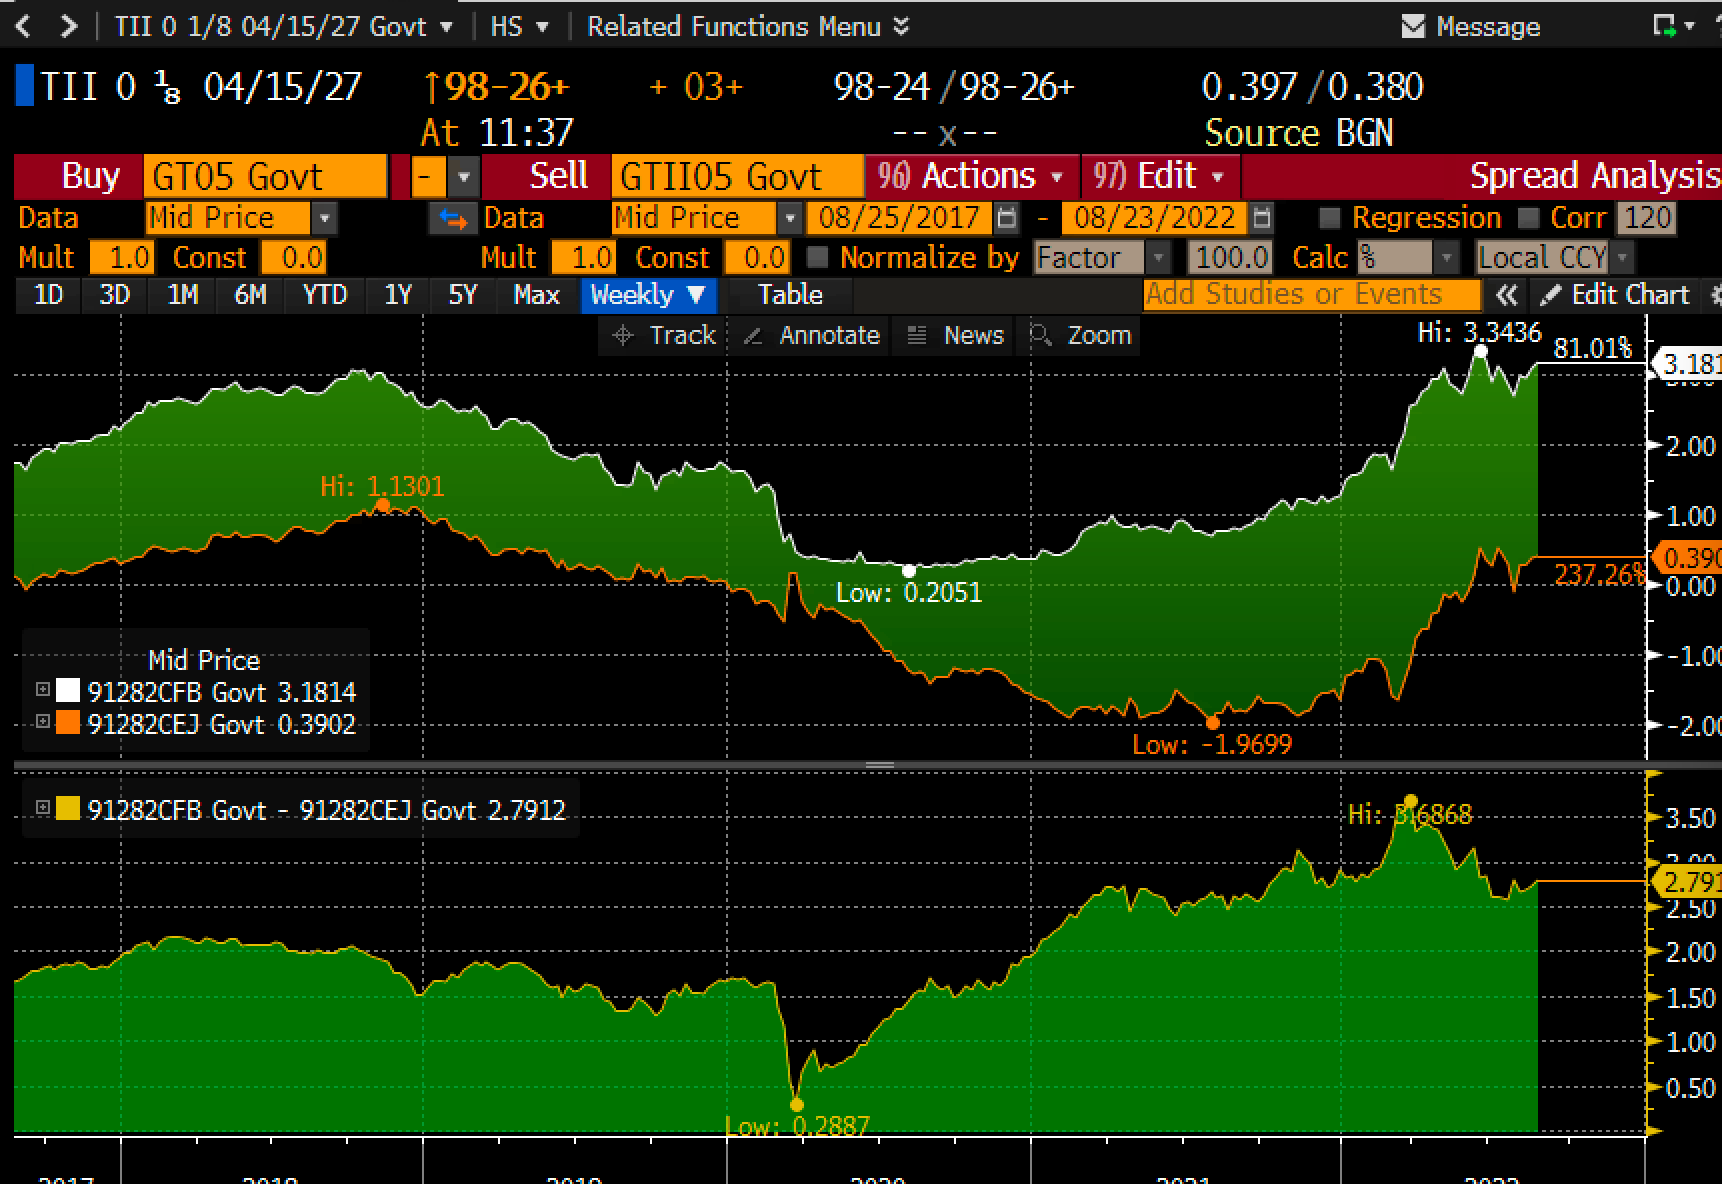
The top half of Chart #7 shows the level of 5-yr nominal and real Treasury yields. The bottom half shows the difference between the two, which is the market's expectation for what the CPI will average over the next 5 years. Inflation expectations have moved up of late, but they remain far below the current level of inflation. Thus, the bond market is telling us that the Fed is not on the verge of an inflationary mistake. I would argue instead that the Fed is on the verge of being too tight.
I note that 5-yr real yields on TIPS (the orange line on the top half of the chart) have been relatively stable at about 0.5% for the past year or so. This is consistent with a view that says that the economy is going to continue to grow, but at a relatively modest rate. Indeed, headwinds to growth abound, chief among them being Biden's Inflation Reduction Act, which is very likely to instead boost inflation and increase regulatory burdens. To me it sounds like a replay of the early years of the Obama administration, when regulatory burdens increased so much that the economy only managed to grow by about 2% per year. Look for growth in the future to be 2% or less, unless policies change for the better.

24 comments:
Is there a case to be made for leaving rates where they are to offset the inflationary effects from the IRA and now the student loan forgiveness EO (will be north of $600 billion all said and done)?
“Quantity leads and velocity follows”. Cit. Dying of Money -By Jens O. Parsson.
Have we seen any Fed -- or Treasury official -- mention the slowdown in M2 growth? If not, it probably means that they are paying little attention to this important metric, and an over-tightening-induced recession is likely in the cards.
re: "People wanted to hold a lot of money during the Covid panic, but not so much now."
The cash/drain factor has fallen from 1.103 on 2/1/2020 to 0.440 on 7/1/2022. I.e., there is a huge volume of saved DDs, excess liquidity, in the economy.
re: "The dollar is surging worldwide, and that is a big problem."
The flight-to-safety is accompanied by a contraction in the E-$ market.
Is the student loan forgiveness deflationary? It would seem so it is the destruction of money rather than creation. This could be a further impetus for interest rate reduction.
Financial conditions, while tighter than most of the past decade or so, are now looser than they were a month or so ago(!) The Fed seems to have room to tighten significantly (political room, mostly).
https://www.chicagofed.org/publications/nfci/index
The "best" thing for the country (world?) would be a soft landing that included some recessionary data, but where unemployment (salaries, etc.) stayed in relatively good shape. Along with this would/should be a financial asset bear market- but not "too" deep, e.g. down ~30% max peak to trough. --~3400S&P, ~26000DJIA at the bottom. That would put the P/E and other ratios in the reasonable range. The bond market would feel some damage too, obviously.
That's the "best/realistic" case/scenario that I can envision.
Mr. Grannis: Your view of QT, which we're told will go into overdrive in Sept (vs. 2018)?
How is partial student loan debt relief functionally different than a tax cut? Or uncollected taxes owed?
John: re how student loan debt relief is different from a tax cut: there is no comparison. A tax cut increases the incentive to work and/or invest (by increasing the after-tax rewards to doing so), and that strengthens the economy. Debt relief on the other hand only creates perverse incentives.
Well, Nasdaq off 4% yesterday on speech that was pretty much what everyone expected from Powell, maybe a little "tougher."
I agree with Scott Grannis; inflation is already cooling, and the world can tolerate moderate inflation for a while en route to 2-3% inflation. (BTW, the Reserve Bank of Australia's inflation target is 2% to 3%. I think that is about right).
The PCE core posted yesterday at 4.6% in July y-o-y, down from 5.3% yoy in February, and declining fairly steadily.
No one likes inflation (I wish people would talk about inflation in housing costs more). But prosperity is the goal of macroeconomic policy, not zero inflation.
I hope the Fed signals not easing, but "wait-and-see" after next 0.5% rate hike.
But for some reason, central banks are often behind the curve, and often fighting the last war. Might have something to do with "committee" rule, rather than accountable single-person leadership
Gross Domestic Product: Implicit Price Deflator (A191RI1Q225SBEA)
Q2 2022: 9.0
Q1 2022: 8.3
Q4 2021: 7.1
Q3 2021: 5.9
Q2 2021: 6.2
Where's the slow down?
Salmo: the slowdown in inflation is predicted by 1) the strength of the dollar, 2) the weakness in gold prices, 3) the substantial decline in most commodity prices, 5) the significant decline in gasoline prices, and most importantly 6) the huge slowdown in M2 growth since late last year. The numbers you cite are old news by now. As Wayne Gretzky famously said, “I skate to where the puck is going, not to where it is.”
BTW, if you are old enough, you can remember back when Reagan was Reagan, and Volcker was Volcker, and the Wall Street Journal editorialized that an inflation rate under 5% on the CPI was good enough.
Ronald Reagan himself gave speeches about then that the Federal Reserve should be folded into the Treasury Department, wherein it would indirectly report to...the Oval Office. Don Regan, Treasury Secy, echoed the sentiments.
The sentiment was that Volcker was "too tough," or even a Democratic Party-ite (originally appointed by President Carter).
Those were the days.
Well, the US did well enough in the 1980s with moderate inflation.
Benjamin: "The sentiment was that Volcker was "too tough," or even a Democratic Party-ite (originally appointed by President Carter). "
I have done some reading on this and from what I have been able to find out, Reagan and Volcker were in agreement very early in the term, e.g. ~1980-1983. I believe this time period planted the seeds for the next ~20 years of economic activity in the US. In ~1986, from what I have been able to find, Reagan wanted more "de-regulation" of the banking industry, and maybe other policies that Volcker didn't agree with. So, Volcker left in 1987. That may have contributed to the crash that year, by the way.
Thanks for the post.
I'm not saying there won't be a slowdown in inflation, just that inflation will remain too high.
“Why Shrinking Central Bank Balance Sheets is an Uphill Task”
https://www.kansascityfed.org/Jackson%20Hole/documents/9040/JH_Paper_Acharya.pdf
“Fed Chairman Jerome Powell said in July that the reduction in the balance sheet could continue for “two and a half years.”
What people haven't mentioned is that the poor people, and young people, are moving in with each other (like during the Great Depression).
Black Monday was due to the maestro Alan Greenspan. Greenspan drained legal reserves at the fastest rate since the GD. And then banks were on contemporaneous reserves accounting.
wkevinw--
Well, I was enchanted by Reagan (terrific speechmaker, a lost art) and he was a gentleman, and in public said nice things about Volcker (and really about almost anybody else. Reagan was a nice guy, another lost art).
But behind the scenes, the Reagan White House was at odds with Volcker, and planned his exit from the Federal Reserve. Eventually, the Reagan White House feared Volcker's exit would roil markets and reduce confidence in the administration, so they reluctantly re-appointed Volcker.
Here is a little lost history---
https://www.nytimes.com/1982/09/18/us/reagan-suggests-tighter-control-of-central-bank.html
But would that civil and thoughtful people like Reagan, or JFK, populated our White House again. You may not agree with everything those guys stood for, but they were far above today's standards. Eisenhower too, whose farewell speech remains a classic.
There is a new school of thought that makes the following argument; over the past two decades, the nature of the borrowing business has changed fundamentally, because of increased indebtedness the cost of money is less important than the availability of money. In the late 1990s refinancing was 40% of the total debt market. In 2021, the last full year of data, the numbers were the inverse, 7 out of 10 dollars are now refinancing.
Therefore borrowers are less concerned with the price of money and more with the availability. Borrowers will not modify their borrowing habits because they cannot.
Therefore, the market has become less sensitive to changes in the cost of money.
The problem with this theory is that it's hard to prove, and it "feels true", which is even worse! As the CFO of a small company, the cost of borrowing has risen by nearly 150% over the past two years, and yet I still consider the cost of debt to be cheap...and unavoidable.
"Steve Hanke contended that “inflation is always caused by excess growth in the money supply — turning the printing presses on,” an economic doctrine known as monetarism, most famously espoused by economist Milton Friedman."
“That’s why, by the way, we’ll continue to have inflation through 2023, going into, probably, 2024,” he said.
Hanke noted that his inflation model is pointing to price increases in the 6%-to-8% range for the end of 2022. He said the system suggests a 5% inflation rate at the end of 2023."
Salmo Trutta:
Actually, commercial banks print money, when they extend loans. Not the Fed.
Keep your eye on loan volumes.
"Is the student loan forgiveness deflationary? It would seem so it is the destruction of money rather than creation."
Money is retired from the 'system' when debt or loans are repaid. On a first-level thinking basis, debt 'forgiveness' is neutral because the debt is written down to zero but the money which has entered the system remains there. On a second-level of thinking, an expectation of further systematic debt write-downs will tend to be inflationary but this inflationary component may happen in a context of over-riding deflationary forces. My bet is that the US will somehow manage relatively better.
"Where's the slow down?"
In the 'real' world:
https://www.wsj.com/articles/global-economies-flash-warning-of-sharp-slowdown-11661247579
"As Wayne Gretzky famously said, “I skate to where the puck is going, not to where it is.”"
That use of the quote is funny and interesting (at this point..) because that's a quote i used a few months ago (transition 2021-2) in these pages to indicate that a detailed dissection of M2 numbers revealed (already) a massive net slow down in overall M2 creation and the idea was to make an educated guess about the lag for disinflation (and now deflation) to occur. Of course the stock markets saw that and the bond markets see that now but who am i to say?
"Keep your eye on loan volumes."
Yes real growth of private M2 creation has been coming down and has been held up (relatively) so far by growing credit card debt as main street and real-life consumers feel the pain of stagnant and declining real wages. My bet is that the US consumers will eventually see value in making savings great again, eventually.
Benjamin Cole: I watch bank credit. Bank credit during Volcker's' reign rose faster than it is doing today.
Grannis' M2/gDp (money demand) is also a good metric.
Post a Comment