Tuesday, July 25, 2023

M2 update: inflation still headed to zero


On the eve of what is likely to be the end of this cycle of Fed tightening (even if the Fed hikes rates 25 bps tomorrow, they will almost surely convey the impression that no more hikes are envisioned), this blog continues its coverage of the all-important money supply figures. The June M2 number was released today and it was unremarkable. Year over year M2 growth is running at about a -4% rate, while M2 has been relatively flat over the past three months. This is consistent with further declines in inflation over the next 6-9 months.

It continues to amaze me that only a handful of Fed watchers pay any attention to the M2 money supply. The vast majority of inflation-related commentary—including that of the Fed itself—lavishes attention on just about every inflation indicator and variable except the money supply. Milton Friedman must be rolling in his grave. As he famously said, "inflation is always and everywhere a monetary phenomenon." Inflation happens when the supply of money exceeds the demand for it, and the lags between money supply and inflation are "long and variable." So when the US M2 money supply grew at a 20-30% annual rate in 2020 and early 2021, a big increase in inflation was very likely to show up in early 2022. And, not surprisingly, it did. 

We've now seen M2 growth not only collapse, but actually turn negative over the past two years. Again, not surprisingly, inflation began to decelerate dramatically starting about one year ago. More recently, M2 growth has been flat for the past three months, so to the extent that some observers, like Brian Wesbury, worry that collapsing M2 portends an eventual recession, the M2 news has become much less worrisome. 

Chart #1

Chart #1 shows the level of M2 relative to its long-term trend growth rate of 6% per year. (Note that the y-axis is plotted on a log scale, so a straight line represents a constant rate of growth.) M2 is still about $2.6 trillion above trend. I've interpreted this to mean that there is still a lot of liquidity in the economy, and this should act as a buffer against adverse developments. 

Chart #2

Chart #2 compares the year over year growth of M2 with the rate of consumer price inflation, with the latter shifted to the left by one year to illustrate the fact that there is approximately a one-year lag between changes in M2 growth and changes in inflation. The chart strongly suggests that the CPI is on its way to zero over the next 6-9 months. As such, it's reasonable to conclude that the Fed has acted appropriately, if belatedly, and no further tightening is therefore necessary; lower inflation is "baked in the cake" at this point. 

Chart #3

Chart #3 compares the growth rate of M2 with the 12-month running sum of monthly federal budget deficits. This chart strongly suggests that most or all of the deficits from 2020 through early 2021 were monetized. In other words, the massive Covid-era spending blowout was financed with money that was effectively printed. Fortunately, the rising deficits we have seen in the past year have not been monetized, so there is no reason to worry about a resurgence of inflation fueled by excess M2 growth.

Chart #4

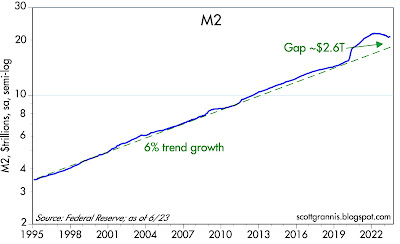
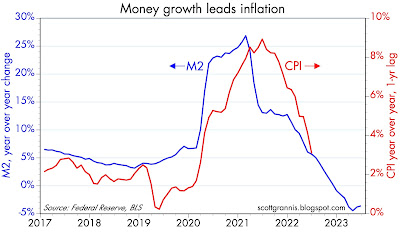
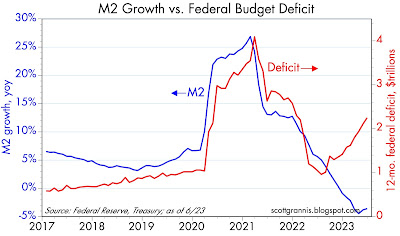
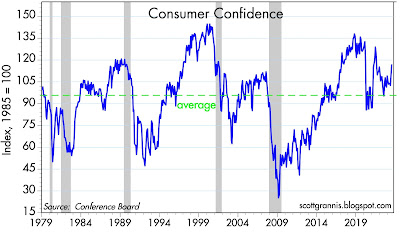
Chart #4 shows the Conference Board's index of consumer confidence. July's figure was reported today, and it showed a welcome increase. This supports my long-held contention that there is no reason to worry about an imminent recession. The economy is likely to continue growing for the foreseeable future, albeit at a relatively unimpressive rate of 2% or maybe a bit less.

Tuesday, July 18, 2023

I repeat: the Fed is done


Last week's June CPI news surprised the market, but it didn't surprise me. The demise of inflation is playing out almost exactly as I've been anticipating for the past year or so. 

Chart #1

Chart #1 shows the 6-mo. annualized change in the CPI (3.3%) and the CPI less shelter (1.4%), with the green line representing the Fed's 2% target. If it weren't for shelter costs, which are being artificially inflated (housing prices and rents are flat to down in the past year or so, but the measure of those costs is delayed by more than a year by the methodology the BLS uses), then inflation right now is well under the Fed's target.

Chart #2

Chart #2 shows the 1 and 3-mo. annualized change in the component of the CPI. Inflation in this component has turned down in recent months (i.e., OER is still rising, but at a slower rate), but it has a long ways to go, as suggested by Chart #3. 

Chart #3

Chart #3 shows that there is about an 18-mo. lag between changes in home prices and changes in the Owner's Equivalent Rent component of the CPI. Home prices haven't risen for at least a year, but the OER component of the CPI is still increasing. It likely won't turn flat or negative for at least the next 6-9 months.

The Fed needs to realize this now, and at the very least make it clear at next week's FOMC meeting that it plans no further hikes to short-term interest rates. The market, fortunately, has come to understand this, but it would be very helpful if the Fed eliminated lingering doubts.

Meanwhile, lower interest rates would be a welcome development for the economy. Mortgage rates are still punishingly high (~7% for 30-yr fixed rate mortgages) and that is making housing unaffordable for many millions of prospective homebuyers. Soaring interest rates on Treasuries have sent the interest cost of our mega-sized national debt to the moon, adding almost $1 trillion to this year's federal deficit. 

Friday, July 7, 2023

No boom, no bust


Since my last post (6/28), 10-yr Treasury yields have jumped 36 bps, while 1-yr yields rose by only 8 bps. This was driven by some stronger-than-expected economic news that caused the market to postpone its estimate for when the Fed will begin to cut rates. The market now expects the Fed to increase rates once or maybe twice by year-end, followed by an initial cut in rates sometime around March of next year. I remain convinced that no further rate hikes are needed. Why? Because although the economy has proved more resilient than the market expected, the inflation fundamentals have not changed: money demand has strengthened due to higher rates, "excess" money supply has declined, commodity prices are weak, inflation expectations remain low (~2.2%), and shelter costs are declining. I've explained all this in posts over the past several months.

What follows are some updated charts which fill in the story:

Chart #1

Chart #1 shows the three major components of the Personal Consumption Expenditures Deflator. On a 6-month annualized basis, the increase in the overall deflator has dropped from a high of 8% last June to 3.4% as of May '23. Two of its components—durable and non-durable goods—have not increased at all since last June (witness the flatness of the blue and purple lines). This means that the only source of inflation of late has been the service sector, and a major component of that is shelter costs, which are measured with a significant lag and which will almost certainly be subtracting from the official inflation statistics in coming months. See this post for more details.

Chart #2

Chart #2 shows that almost 85% of the service sector firms surveyed by the ISM reported paying higher prices early last year, but only 54% are reporting that now—that's very significant. This information is more timely than that picked up by the PCE deflator, and adds strong support for my belief that overall inflation is almost certain to decline significantly in the months to come. The Fed cannot ignore this for much longer.

Meanwhile, commodity prices have weakened considerably since the Fed began raising rates in March '22. The CRB Raw Industrials index is down 19%, non-energy commodity prices are down 21%, and oil prices are down fully 39%. If you live in the world of commodities, you've been experiencing painful deflation for the past 15 months. 

Chart #3

Chart #3 shows a monthly measure of the number of announced corporate layoffs. Here we see a spike beginning in November of last year that has now all but ceased. The source of that spike was almost exclusively the high-tech sector, followed by more recently by the financial sector. Layoff activity has subsequently subsided to levels that are relatively normal. This was not a precursor of a recession, as many speculated. These are more commonly referred to as "rolling recessions," which hit only parts of the economy, not the whole. 

Chart #4

Chart #4 compares the number of job openings in the country to the number of persons who are looking for work. Job openings remain extraordinarily high, and thus indicative of the fact that the fundamentals of the US economy remain healthy. Moreover, swap and credit spreads—key and leading indicators of economic health—remain low. 

Chart #5

Chart #5 compares the number of jobs in the public and private sectors as of last month. Note that public sector jobs have not increased at all since the end of the Great Recession. Relative to total employment, public sector payrolls have fallen from a high of 17.6% in mid-2010 to now only 14.5%—a level not seen since 1957. Zero net growth of the public sector alongside significant growth in the private sector is a libertarian economist's dream. Since private sector jobs are generally more productive than public sector jobs (sorry, civil servants, but it's the truth), this supports the notion that the economy remains fundamentally healthy. On the other hand, the chart shows that the growth of private sector jobs has been declining of late: the six-month annualized rate of increase in private sector jobs was 4.1% a year ago, and it is now only 2.0%. That's the sort of growth we saw over most of the 2010-2019 period, and those were years that saw real GDP grow a little more than 2% per year. That's more support for my long-held view that we're in a 2% growth world. It's not very exciting, but it's sure better than nothing. 

There is nothing in the stats to support widespread claims that the economy is "running hot." Nothing to suggest that inflation will do anything but decline. Nothing that would justify yet another increase in short-term rates. The Fed is done, but they are loathe to admit it: "once burned, twice shy" as the saying goes.