Wednesday, April 30, 2014

Taking the measure of our discontent

The Great Recession of 2008-2009 wasn't your typical recession. In every other recession in postwar history, the economy rebounded within a few years to return to its long-term growth path. But not this time, and it has nothing to do with the rich getting richer or the alleged increase in inequality. Instead, it has to do with the average person and the average family not making the kind of progress to which they've been accustomed. Understandably, people are upset.


The chart above compares the actual growth of real GDP (blue) with its long-term trend of about 3% per year. Never before has real GDP fallen below its trend by so much for so long—and still, as we are about to enter the sixth year of recovery, there is no sign of a true recovery. The current "gap" between actual GDP and its long-term trend is about 10% by my calculations. That translates into a national income shortfall of roughly $1.7 trillion.

This is the measure of the country's discontent: $1.7 trillion in missing income.


The chart above compares the actual growth of a subset of retail sales (which excludes certain volatile categories) to its long-term trend. These are the expenditures made by ordinary folk, not the mega-billionaires. This helps dramatize just how radically things changed beginning in the latter half of 2008. Retail sales by this measure would have to increase 16% overnight to get back on their long-term trend path. This is the measure of how much middle class families are hurting.


After growing for decades at about a 1% annual pace, the labor force suddenly stopped growing in late 2008, as the chart above shows.

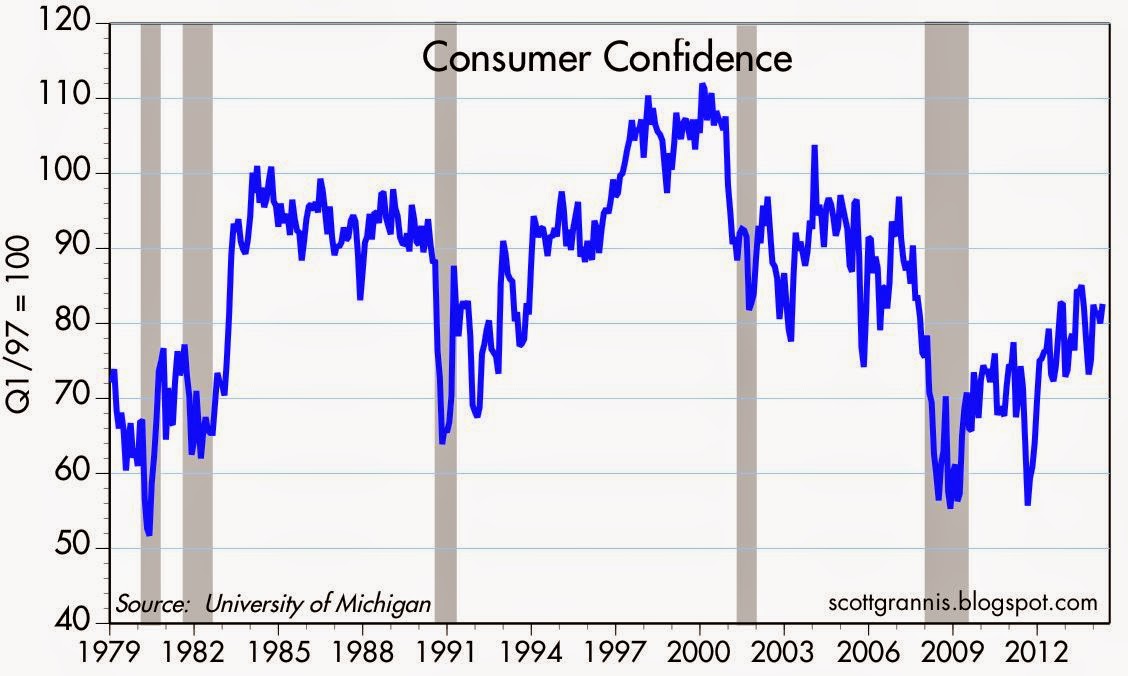
If one thing stands out in these charts, it is the abruptness and the severity and the persistence of the divergence from long-term trends that began in 2008. Something REALLY BIG happened; what was it?

It was not demographics, since demographics change at glacial speed. The population didn't suddenly got older and start to retire en masse in late 2008.

It was not monetary policy. The Fed was arguably slow to launch its QE efforts in late 2008, but since then they have been working overtime to make sure the economy is not starved of liquidity and interest rates are as low as possible. (I could be persuaded that the persistence of extremely low interest rates has been a problem for savers, and that this has led to weak investment, but corporate profits have been setting records throughout the recovery.)

The one thing that changed in a really big and durable way, starting in 2008, was fiscal policy. The Bush administration launched TARP in late 2008, and the Obama administration followed up with ARRA in 2009. Then came Obamacare in 2010, which purported to restructure fully one-sixth of the US economy within the space of a few years. Then came the Dodd-Frank super-regulation of the financial industry. Beginning in 2013, top marginal tax rates were increased.


As the first of the above two charts shows, massive fiscal "stimulus" increased the federal government's debt from $5.34 trillion in June '08 to $12.45 trillion as of this week. As the second chart shows, that surge of borrowing doubled the federal debt burden, raising it from 36% of GDP to 72% of GDP in a mere four and a half years. The only other time something of this magnitude happened with fiscal policy was WW II.

The federal government borrowed $7.1 trillion over the course of five and a half years and handed most of the proceeds out in the form of various transfer payments. Our leaders in Washington did this in the belief that this would stimulate spending and that would convince businesses to create more jobs. The federal government restructured the entire healthcare industry in the belief that this would lower costs and give everyone healthcare insurance coverage. The federal government rewrote the rules for the entire financial industry, in the belief that a more-highly-regulated banking system and greater consumer protections would restore confidence and optimism. And to top it off, the federal government increased taxes on the rich, in the belief that this would benefit the middle class by more fairly distributing the fruits of progress. But it didn't work. Spending wasn't stimulated; job growth didn't surge; healthcare costs continue to rise, the vast majority of the uninsured are still uninsured, and millions are now losing what coverage they used to have; banks are reluctant to lend and consumers are reluctant to borrow; consumer optimism remains relatively weak; and the middle class has taken it on the chin.

If anything, the massive growth of government intervention in the economy since 2008 looks to be the Occam's Razor explanation for what caused the weakest recovery in history.

If there is a reason for widespread discontent, it is our federal government and its overbearing and intrusive ways. Thanks to all the government "help" that has been heaped upon us in the past six years, we have the weakest recovery in history. And the bill for all this is a staggering $1.7 trillion per year and counting.

Tuesday, April 29, 2014

Housing continues its slow recovery


Housing prices as measured by Case-Shiller rose almost 13% in the year ending February, which was roughly in line with expectations. In nominal terms, housing prices have recovered almost half of the loss they suffered from 2006 through 2011, and they have returned to the levels of 2004. In real terms, prices are still almost 30% below their 2006 highs and are back to the levels of 2002. We are years away from a full housing recovery no matter how you look at it. As the second chart above shows, in real terms housing prices today are up 58% from early 1987 levels. This works out to a 1.7% annualized rate of increase, which is close to the long-term historical norm. Nothing unusual going on here.


The chart above suggests that the rise in housing prices in the past two years is likely to feed into inflation over the next year or so. Housing prices enter the CPI through a circuitous route called "Owner's Equivalent Rent." This is an estimate of how much homeowners would pay to rent the house they own, and it comprises about 25% of the CPI. As the chart above shows, rents have been picking up of late (they are up 2.6% in the past year), in what is basically a lagged response to the rise in housing prices.

Sunday, April 27, 2014

The right way to look at inequality

By now there are many dozens of reviews of Thomas Piketty's new book about the "problem" of inequality, Capital in the Twenty-First Century. Liberals almost universally laud it, because it is an eloquent argument in favor of the progressive taxation of wealth, something they believe is necessary in order to prevent the excessive accumulation of wealth and income among the very rich, and the social unrest that might follow. Conservatives almost universally disagree, because capital is the ultimate source of our prosperity, and taxing capital only reduces living standards for all.

Garett Jones's review ("Living with Inequality") of Piketty's book is the best I've seen so far. Some excerpts and comments from him, me and other reviewers follow, but you should definitely read the whole thing: (HT: Don Boudreaux)

... the French economist Thomas Piketty claims to have uncovered "the central contradiction of capitalism." What is this flaw at the heart of the economic machine, a flaw that centuries of economists have overlooked? Simply that at some times and at some places, the interest rate is greater than the economy's growth rate.

Piketty sums it up with a simple equation: r > g. And if r > g for decades, he argues, capital contains the seeds of deep social conflict.

There are many ways in which to argue that, while Piketty's contribution to the inequality debate are substantial, he has left out many things which make the whole issue of inequality a lot less deserving of sensational headlines and breathless admiration.

In their zeal to avoid the supposed danger of increasing inequality, liberals—and Piketty—ignore one obvious remedy. As Holman Jenkins points out in his review, if capital is likely to continue to grow at a faster rate than the economy, as Piketty predicts it will, and at a faster rate than wages, then we should be doing everything possible to educate workers about the virtues of saving and investment, and to facilitate their ownership of that gift that keeps on giving—otherwise known as capital. We should privatize social security, as Chile did with much success beginning in the early 1980s, rather than extoll the virtues of consumption and allow politicians to spend our FICA withholding taxes. We should let workers put their money in an investment account where it can grow into a substantial asset that can be passed on to their heirs if they so wish (unlike Social Security, which is not an asset and pays out more to the healthy and wealthy than to the infirm and poor). Rather than envying, coveting or redistributing the wealth of the rich, we should encourage everyone to get rich the same way the rich do—by accumulating capital. Christopher Demuth agrees: "the earned fortunes of great entrepreneurs become dramatically large over time—but that is due to the value of time and the arithmetic of compounding, which are equally available to the most diminutive capitalist." 

Piketty overlooks the fact that the very wealthy and the very rich are not members of a closed club, but rather members of a club that gains and loses members all the time. Hirschl and Rank of Cornell tracked a large number of individuals from age 25 to 60 and found that there is a great deal of turnover within the top levels of income distribution: "Rather than talking about the 1 percent and the 99 percent as if they were forever fixed, it would make much more sense to talk about the fact that Americans are likely to be exposed to both prosperity and poverty during their lives. ... It is clear that the image of a static 1 and 99 percent is largely incorrect." And in any event, getting rich is not a zero-sum game. As the rich have gotten richer, so have the poor, a fact documented by Brookings' Gary Burtless.

Arnold Kling points out that, according to Paul Krugman's review of Piketty's book, Piketty has pulled off a bit of a bait-and-switch, by arguing that soaring inequality is a by-product of capital accumulation, when in fact it may be simply due to hard work. Krugman: "the fact is that the most conspicuous example of soaring inequality in today’s world—the rise of the very rich one percent in the Anglo-Saxon world, especially the United States—doesn’t have all that much to do with capital accumulation, at least so far. It has more to do with remarkably high compensation and incomes." Rauh and Kaplan of Stanford studied the composition of the Fortune 400 over time and found that Piketty's claim that too many of the rich inherit their money and too many CEOs award themselves the money unjustly is wrong.

Greg Mankiw suggests that Piketty's claim that inequality has increased may be due to faulty data:

Over the past few decades, there has been an amazing shift in how businesses are taxed. Businesses are more and more taxed as pass-through entities, where the income shows up on personal tax returns rather than on corporate returns. This phenomenon complicates the interpretation of tax return data. For example, when one looks at the growth of the 1 percent, or the 0.1 percent, in the Piketty-Saez data, that growth is likely exaggerated because some income is merely being shifted from corporate returns.

In a similar vein, Alan Reynolds in 2007 exhaustively analyzed the data, adjusted for changes in taxation regimes, and found that there is "little evidence of a significant or sustained increase in the inequality of US incomes, wages, consumption, or wealth since 1970."

Perhaps more importantly, we should also recognize that the two central factors of production in any economy—labor and capital—are intricately bound. When capital becomes abundant, labor becomes scarce; lots of wealth leads to increased prosperity and higher wages—more capital requires more labor. Anything that reduces the supply of capital makes labor redundant, restricting the growth of wages. Besides, it's very unlikely that the money that government taxes away from the rich will be put to more productive use, being more likely exposed to waste, fraud, and corruption. In his review of the book, Tyler Cowan agrees: "the best parts of his book argue that, left unchecked, capital and capitalists inevitably accrue too much power -- and yet Piketty seems to believe that governments and politicians are somehow exempt from the same dynamic."

The right way to look at inequality is that it's not a problem, except to the extent that politicians and statists think it is. As Jones argues, we should pay more heed to the Tenth Commandment, "a foundation of social peace." Furthermore:

The Nobel Laureate economist Vernon Smith noted the tenth commandment along with the eighth (you shall not steal) in his Nobel toast, saying that they "provide the property right foundations for markets, and warned that petty distributional jealousy must not be allowed to destroy those foundations. If academics, pundits, and columnists would avowedly reject covetousness, would openly reject comparisons between the average (extremely fortunate) American and the average billionaire, would mock people who claimed that frugal billionaires are a systematic threat to modern life, then soon our time could be spent discussing policy issues that really matter.

The last two lines of Jones' review sum things up perfectly:

... when it comes to capital, simple economic theory is right: the more, the merrier. And if we can reduce covetousness, we can say the reverse: the merrier, the more.

(Thanks to D. Gollaher for the inspiration for this post)

UPDATE: The Financial Times has challenged the validity of Piketty's data and his conclusions:

The data underpinning Professor Piketty’s 577-page tome, which has dominated best-seller lists in recent weeks, contain a series of errors that skew his findings. The FT found mistakes and unexplained entries in his spreadsheets, similar to those which last year undermined the work on public debt and growth of Carmen Reinhart and Kenneth Rogoff.
The central theme of Prof Piketty’s work is that wealth inequalities are heading back up to levels last seen before the first world war. The investigation undercuts this claim, indicating there is little evidence in Prof Piketty’s original sources to bear out the thesis that an increasing share of total wealth is held by the richest few.

Thursday, April 24, 2014

Business investment still lackluster


New orders in March for capital goods, a proxy for business investment, beat expectations (+2.2% vs. +1.5%) but have managed only lackluster growth over the past year. In real terms, orders are still about 20% below the levels of 2000, and still 10% below their pre-recession high of 2006. Without more robust business investment—which provides the wherewithal for increasing worker productivity—it will be difficult for the economy to do much better than 2-3% growth.


We can only speculate as to why businesses have been so modest in their investments for the future, but likely candidates for explanations include excessive regulatory burdens (e.g., Obamacare, Dodd-Frank), very high corporate tax rates compared to many other countries, anti-business sentiment in Washington, and a general unwillingness to take risk. Lackluster business investment has nothing to do with a lack of profits, since corporate profits after tax are at all-time record highs (see chart above). 

It's disappointing, to say the least, to see so much potential new investment being held back for reasons that could be addressed by smarter public policy. But the mountain of corporate profits being stashed away both here and overseas is like a bright beacon lighting the way—for those politicians who understand how to lower the barriers to new investment—to a more productive and prosperous economy in the years to come.

Wednesday, April 23, 2014

Amazing increase in US oil production


In the span of a mere four years, U.S. production of crude oil has surged by 67%, according to the Dept. of Energy, reaching levels not seen since the late 1980s. Crude production is up 14% in just the past year. This is the fruit of new fracking technology and it is nothing short of astonishing. Natural gas production is up almost 40% over this same period, and—since natural gas is not easily exportable—this has resulted in a two-thirds decline in the price of natural gas, which in turn gives our energy-intensive industries a big competitive advantage. All of this adds up to a huge boost for the U.S. economy, and it has nothing to do with any government initiatives or infrastructure investment. Indeed, it comes despite Obama's reluctance to approve the Keystone pipeline.

Mark Perry has been doing a terrific job of covering this story. In his most recent post on the subject, he points out that "the U.S. was the world's largest petroleum producer in December for the 14th straight month."

It's hard to be bearish about the economy's prospects when you see big changes like this in a key industry.

Drinking Age Is Past Its Prime

That's the title of Camille Paglia's latest op-ed in Time. As I mentioned a few years ago, she must be one of the last critical thinkers left in the Democratic Party. She correctly identified many of the fatal flaws of the Obama administration in 2009, and she has now lifted from obscurity what should be a priority national issue: repealing the National Minimum Age Drinking Act which was passed 30 years ago. As she notes, "This tyrannical infantilizing of young Americans must stop!" Read the whole thing, it's not too long. The Nanny State is out of control.

Tuesday, April 22, 2014

The amazing energy efficiency of the US economy

Mark Perry today has a nice post celebrating Earth Day from an economist's perspective, including a chart showing how the U.S. economy today uses far less energy per unit of output than it did in 1950. To complement his post, I offer the following charts which focus on oil consumption.


These charts offer powerful proof that people and economies respond to price incentives. Since 1970 the inflation-adjusted price of crude oil has increased by a factor of 10. Faced with the problem of increasingly expensive oil and oil by-products, the U.S. economy responded by reducing its reliance on oil and becoming more energy efficient. As the second chart shows, the U.S. economy today uses over 60% less oil than it did in 1970 to generate a unit of output.


As the chart above shows, the U.S. economy now consumes about 19 million barrels of oil per day. That is the same as it consumed in 1978, despite the fact that the economy today is two and a half times larger than it was in 1978. It's a remarkable achievement.

Monday, April 21, 2014

Enduring strength in leading indicators


The Index of Leading Economic Indicators doesn't get much respect these days (it's often maligned as the Index of Mis-Leading Indicators), but its track record is nothing to scoff at, as the chart above shows. The growth of the index typically picks up in the early stages of a recovery, and slows dramatically in advance of and during a recession. In addition, the growth of the index typically slows during the latter half of each business cycle. But not this time. At the very least, the LEI is telling us that there is no recession on the horizon and at best, that the economy may in fact be improving somewhat.

In any event, the economy doesn't need to improve to justify an investment in risk assets, it just needs to avoid a recession, since the alternative to risk assets is cash that yields almost nothing.

Tracking the perfect storm

One month ago, in what proved to be one of the most-read posts in the history of this blog (Saving, lending and tapering combine in a perfect storm), I commented on the confluence of three seemingly unrelated developments: a slowdown in the rate of savings deposit growth, a pickup in the pace of bank lending to businesses, and the beginning of the tapering of the Fed's bond purchases. I thought that these developments were symptomatic of a decline in the demand for money and the Fed's reaction to that decline in money demand (tapering). I worried that if the decline in money demand were to continue, the Fed's tapering might have to accelerate, otherwise a relative oversupply of money could develop which could threaten higher inflation. Those words of caution still hold.

Over the past month, the growth rate of savings deposits still appears to be slowing, bank lending to businesses is still booming, and the Fed has tapered further its bond purchases. Inflation remains low and the economy is likely recovering the strength it lost to bad winter weather. So far so good, but this is a topic that bears considerable attention, so I offer some further commentary here.


As I've noted before, the Fed's QE bond purchases have consistently failed to deliver on one of their stated purposes, which was to reduce the level of long-term interest rates. (It's this apparent failure which actually bears witness to the success of QE, as I explain here.) As the chart above shows, 10-yr Treasury yields rose significantly during each QE episode (i.e., the price of the 10-yr Treasury fell). Massive purchases of bonds by the Fed not only failed to boost the prices of bonds, they appear to have depressed the price of bonds. Similarly, the Fed's Operation Twist (OT) failed to cause the yield curve to flatten, since 10-yr yields were unchanged after over a year of the Fed buying 10-yr bonds and selling shorter-maturity bonds. 

I've explained before that what this shows is that the Fed has no ability to unilaterally affect interest rates with maturities beyond that of a few years. The market is a far more powerful force. I think yields rose during each QE episode because the market saw QE bond purchases as a positive for the outlook for growth. By buying bonds and swapping them for bank reserves, the Fed was satisfying the world's intense demand for safe, short-maturity assets, and by doing so the Fed was avoiding a shortage of safe assets and providing much-needed liquidity to the markets, and this helped facilitate economic growth. Better growth prospects drove yields higher. 

Bond yields fell sharply after QE1 and QE2 not because of anything the Fed did or didn't do, but because both the Fed and the market were blindsided by the sudden rise in Eurozone sovereign default risk that occurred during those periods. A big increase in the risk of a Eurozone disaster understandably resulted in a big increase in the demand for dollar liquidity (i.e., a flight to dollar-based quality), at precisely the time the Fed decided to not supply more. Concerns about the prospects for growth drove yields lower.


I think it's significant that 10-yr yields have only declined marginally since the tapering of QE3 started, and swap spreads here and in the Eurozone remain low (see chart above). Looking ahead, it's not unreasonable for the market to expect QE3 to end this year, so the relative stability of 10-yr yields tells us that tapering is not problem and the prospects for growth have not deteriorated despite Fed tapering. 

Since the beginning of QE3 in early 2013, the Eurozone has emerged from its recession and eurozone financial markets have stabilized; swap spreads are almost down to normal levels, and the Euro Stoxx index is up over 20%. The countries that appeared on the brink of disaster (Greece, Italy, Spain, Portugal) are now in recovery mode. Things are likely getting a bit better both in the U.S. and in the Eurozone, although boom times are still out on the distant horizon.


As the chart above shows, the growth rate of savings deposits has been declining for the past four years. Since the end of 2013, savings deposits have grown at a 5.1% annualized rate, after growing at an annualized 11.6% rate from the end of 2008 to the end of 2013. In the past six months, however, the growth in savings deposits has been a mere 3.6% annualized. If savings deposits had instead grown at an 11.6% annualized rate, today they would be $270 billion higher than they currently are. Reflecting this decline in the demand for safe assets, gold prices are down over 30% in the past few years.


As the chart above shows, gold prices have fallen in line with a fall in the price of 5-yr TIPS (shown here as a rise in real yields), and that counts as more than a coincidence in my book. 5-yr TIPS are a unique kind of safe asset since 1) they are default-free, 2) don't have much interest rate risk, 3) carry a government-guaranteed real yield, and 4) provide protection from inflation. From 2009 until late 2012, gold and TIPS told us that this recovery was the most risk-averse ever. Since early last year, they've been telling us that risk aversion is being slowly replaced by more confidence.


The world is becoming less fearful and that's why the demand for safe-haven assets is declining. This is part of the long healing process that was necessary after the Great Recession and the near-collapse of global financial markets in late 2008. It's a sign that confidence is slowly returning, and it's corroborated by surveys of consumer confidence (see chart above).


The two charts above show the level and the rate of growth of Commercial & Industrial Loans, which are a good proxy for bank lending to small and medium-sized businesses. Beginning around the first part of last January, banks rather suddenly became more willing to lend and/or businesses became more willing to borrow. Since mid-January, C&I Loans are up about $70 billion relative to their trend growth of the past year or so. That's a sign of increasing confidence no matter how you slice it. It's also a reflection of a declining demand for money. Banks have far more reserves than they could ever hope to need (excess reserves currently total $1.92 trillion), but until recently they were apparently quite content to accumulate excess reserves because they wanted to improve the health of their balance sheets in anticipation of more stringent capital requirements, and because they were generally reluctant to lend. That now appears to be changing. An increased willingness to lend reflects banks' reduced willingness to accumulate excess reserves, which are a functional substitute for the gold standard of risk-free money (i.e., T-bills). Similarly, businesses' increased willingness to borrow is a direct reflection of a reduced demand for money, because borrowing is the opposite of owning money.

In just the past several months, the magnitude of the decline in money demand (as reflected in the recent $70 billion surge in C&I Loans and the $270 billion slowdown in savings deposit growth over the past six months) is an order of magnitude larger than the Fed's $30 billion in tapering to date. It's still small potatoes compared to the size of the global economy (over $70 trillion), but it's an important change on the margin that could prove troubling.

This all bears watching because if the demand for money continues to decline, then the Fed will need to increase the pace of its tapering and sooner or later begin to 1) reduce the supply of bank reserves and 2) increase the level of short-term interest rates. If they don't do this in a timely fashion, then we could begin to see inflation move higher.

Wednesday, April 16, 2014

The economy continues to expand


March industrial production figures exceeded expectations (+0.7% vs. +0.5%) and February was revised sharply higher (+1.2% vs. +0.6%). Over the past six months, industrial production has expanded at a solid 5% annualized pace. This is impressive. Industrial production in the Eurozone is still lagging, but nevertheless is still on the mend. Industrial commodity prices are up almost 3% in the past two months to a one-year high, suggesting that global manufacturing activity is doing just fine.


The manufacturing component of industrial production was also strong, but was nevertheless outpaced by gains in utilities (think cold weather). Still, manufacturing production was up at a 3.5% annualized pace over the past six months.


By the Fed's estimates (they can only estimate it, since there is no way to actually measure it), the utilization rate of the nation's productive apparatus rose a good deal more than expected (79.2% vs. 78.7%). Utilization rates are still below their pre-recession high, however, suggesting the economy still has a decent amount of "slack." This is the Fed's justification for keeping real short-term interest rates firmly in negative territory. However, as the chart above shows, gains in capacity utilization of the magnitude that we have seen in the past four years typically would have elicited a substantial Fed tightening by now. 

The Fed is still in uncharted territory. It's not a question of whether they will tighten, it's when and by how much. Continued gains like we have seen today will almost certainly tip the scales in favor of sooner rather than later.


Housing starts posted lackluster gains in March, but that is not surprising given the poor weather that persisted. As the chart above shows, builder sentiment is still strong enough to expect housing starts to move higher in the coming months. The housing boom has cooled off in recent months, but it is still underway.

Tuesday, April 15, 2014

Deflation risk is low and that's good for the dollar

There seems to be an inordinate amount of concern these days about the threat of deflation. Yes, inflation is low, but there's nothing wrong with that. Inflation in the U.S. is currently running around 1.5 - 2.0%, which is as low as it's been on a sustained basis since the early 1960s, but that was a time of robust economic growth.

Many commentators use a "black hole" or a "slippery slope" analogy when talking about the risk of deflation. They argue that just a little bit of deflation can lead to more; that deflation can be very difficult to escape; and that once deflation sets in it is unambiguously bad for economic growth. Analogies like these can become popular and convincing to the layman, but that doesn't mean they are good or valid. I've debunked the "stall speed" analogy—which says that when an economy is growing very slowly it is vulnerable to collapse—in several previous posts, but it remains popular to this day and contributes, unjustly, to many investors' concerns about investing in risk assets.

Deflation doesn't work like a black hole or a slippery slope. Deflation is what happens when an economy experiences a shortage of money relative to the demand for money. When money becomes scarce, prices of things tend to fall because the value of money increases. A scarcity of money can result from monetary policy that is very tight (e.g., when a central bank pushes short-term interest rates significantly above the rate of inflation) or when the demand for money is very strong and a central bank fails to accommodate this extra demand with extra money and/or lower real interest rates. As I'll show in the charts below, there is no evidence of a scarcity of money in the U.S. today.


The chart above shows the inverted value of the dollar and a broad index of non-petroleum commodity prices. This shows there was a scarcity of dollars in the early 2000s because the dollar was strong and commodity prices were weak. When the Fed subsequently relaxed monetary policy, the dollar weakened and commodity prices rose. The sharp rise in the dollar and the sharp decline in commodity prices in 2008 are evidence that the Fed was slow to react to a big increase in the demand for money that caused a relative scarcity of dollars. Dollars were so scarce in late 2008 that the bond market came to expect years of deflation. Commodity prices currently show no sign of weakness and are in fact quite high from an historical perspective, just as the dollar today remains quite weak—from which we can conclude that there is currently no scarcity of dollars that might cause deflation.


As the chart above shows, the dollar is indeed quite weak from an historical perspective, even when adjusted for inflation and compared to a broad basket of other currencies.


With the dollar weak and commodity prices generally strong, it is not surprising that gold prices are also quite strong. To be sure, gold prices have dropped meaningfully over the past few years, but they are still very strong relative to other commodity prices, as the chart above shows. As I see it, gold "overshot" commodity prices and is now correcting. I've been anticipating a further correction in gold prices for the past year. It's hard to worry about deflation when gold and commodity prices are still trading at levels far in excess of where they traded during the 1980-2000 period.


As the chart above shows, the bond market is convinced that the Fed is not putting the monetary screws to the economy. Every recession on this chart was preceded by a sharp increase in real short-term interest rates and a flattening or inversion of the yield curve, both of which are classic signs of monetary tightening. Today we have just the opposite: very negative short-term real rates, and a relatively steep yield curve. Monetary conditions are accommodative today, not tight. This implies that a recession is extremely unlikely, and it is strong evidence that money is not scarce—thus deflation risk is very low.


Today's release of the March CPI statistics shows that inflation is running quite solidly at just under 2% (see chart above). This is in line with inflation as measured by the broader PCE and GDP deflators. This is not scary or dangerously low, this is good. If inflation averaged 1.5% per year for the foreseeable future, I would expect the economy to strengthen since low and stable inflation would boost confidence, strengthen the dollar, and make the U.S. more attractive to investment.


Don Luskin, a good friend, superb analyst, and fellow supply-sider, inspired me with a chart similar to the one above in his current research report. What this shows is that changes in the growth rate of housing prices (I've used the Case Shiller 10-city index) tend to lead changes in the Owners' Equivalent Rent component of the CPI (OER accounts for about 25% of the CPI) by about 18 months. What this suggests is that the CPI is very likely to be boosted over the next year or so by the strong growth in housing prices that we have seen in the past year or two. We've already seen a little of this in recent months, and there's likely a lot more to come. Rising housing prices tend to lead to rising rents, and that's how housing prices feed into the BLS's calculation of inflation. It's hard to worry about deflation when housing prices are rising.

In contrast to the U.S., the Eurozone is somewhat vulnerable to deflation, because monetary conditions there are relatively tight. You might not think so if you just looked at Eurozone interest rates, since they are quite a bit lower than their U.S. counterparts. German 2-yr bunds yield 0.12% vs. 2-yr Treasuries at 0.4%, and 10-yr bunds yield 1.5% vs. 10-y Treasuries at 2.6%. Typically, monetary tightness shows up as rising interest rates, but this is one of those times when interest rates are very low because inflation is very low and economic growth is relatively weak and money is relatively scarce. Although the ECB has taken significant steps to reduce short-term interest rates, it has not engaged in the massive Quantitative Easing that the Fed has. Weak growth and very low inflation are fertile ground for strong money demand, and it's probably the case that the ECB has not been aggressive enough in its willingness to supply money, and that's why money is relatively scarce in the Eurozone.


As the chart above shows, core inflation in the Eurozone has been less than 1% over the past year, almost a full point lower than U.S. core inflation. The harmonized measure of CPI in the Eurozone is up only 0.5% in the past year, and it is up at a mere 0.35% annualized rate over the past six months. The inflation facts support the theory that money is tighter in the Eurozone than in the U.S..


It's also the case that the euro is a good deal stronger than the dollar. The chart above shows my calculation of the euro's Purchasing Power Parity vis a vis the dollar. At the current level of 1.38, I figure the euro is about 20% "overvalued" against the dollar. The Eurozone faces a moderate amount of deflation risk (if you can call it a risk, since there is no a priori reason an economy with falling prices can't grow) because the euro is relatively strong and inflation is very low. It's not a serious risk, because gold and commodity prices in euro terms are still very high and housing prices in the peripheral Eurozone markets are rising, but it's certainly more of a risk than in the U.S.

What all this means is that the Fed has more leeway than is commonly thought to tighten policy should that become necessary—because monetary policy is relatively easy—whereas the ECB may have to ease policy further because monetary policy is still relatively tight. If the Fed tightens sooner than expected and the ECB eases (e.g., by pursuing some form of QE), that would likely result in a meaningful rise in the dollar vis a vis the euro. And that would be a good thing for just about everyone.

Thursday, April 10, 2014

Federal deficit collapses

If President Obama wants to distract voters' attention from the ongoing failure of Obamacare and the miserably slow recovery, he should simply direct everyone to this blog post. Under his watch, the federal budget deficit has collapsed by two-thirds, from almost $1.5 trillion in his first year as president (in which he inherited a lot of emergency spending from the Bush administration and began spending the almost $1 trillion included in his ARRA) to just under $0.5 trillion in the year ending last March. 


The chart above shows the federal deficit as a % of GDP. By this measure the deficit has plummeted from a high of 10.2% of GDP in 2009 to 2.9% (my estimate) in the 12 months ending last March.


This rather extraordinary achievement was not due to any of his initiatives, however. As the chart above shows, the big reduction in the deficit has been the by-product of flat to declining spending in recent years and multi-year increase in tax revenues. Most of the reduction in spending can be credited to a deadlocked Congress (which has ignored Obama's repeated requests for ever-rising spending), and to declining costs for social safety nets (mainly unemployment insurance, which still remains unusually high). The bulk of the increase in tax revenues is due to an expanding tax base (e.g., increasing numbers of jobs, rising incomes, and rising corporate profits, all of which flow from even a weak recovery), with a modest boost attributable to the higher tax rates which took effect last year.


Despite effective marginal tax rates that are now at their highest level ever for many taxpayers, tax revenues relative to GDP are still relatively depressed. That's mainly a reflection of the weakness of the current recovery, which has yet to create more jobs than existed at the end of 2008. There would have been upwards of 10 million more jobs today if this had been a typical recovery, and that would show up in the form of much stronger revenues, which would probably be well over their post-war average of 17.5% of GDP by now.


The reduction in spending relative to GDP, on the other hand, has been extraordinary—we haven't seen anything like this since the unwinding of WW II spending. Federal spending topped out during WW II at over 40% of GDP in 1945, then promptly collapsed to 14.7% by the end of 1947. Then, as now, a huge decline in government spending failed—despite the warnings of Keynesian-trained economists—to generate a depression, and failed to send the unemployment rate skyrocketing. Supply-siders, in contrast, have an answer for what happened that makes sense: when the government controls fewer of the economy's resources, the private sector has more room in which to practice that in which it uniquely excels: entrepreneurship, cost-cutting, risk-taking, and productivity gains.

One reason Obama is unlikely to link to this post: If we hadn't had all that massive emergency and "stimulus" spending in the 2008-2012 period, the economy would be much stronger today. But now that the spending has been scaled back there is a decent chance that the private sector can give us some better growth numbers going forward. Those chances would rise appreciably if Washington could manage to reduce today's unprecedented regulatory burdens (e.g., Obamacare, Dodd-Frank), reduce corporate tax rates from the highest level of any developed country, and simplify our mind-numbing and hugely burdensome tax code in exchange for a reduction in marginal income tax rates.

UPDATE: Charles Koch has written a brilliant and powerful essay in the WSJ on many of the problems that need to be fixed: "I'm Fighting to Restore a Free Society."

If there's any reason to be optimistic these days, it's that there are so many problems out there that could be fixed in relatively easy fashion.

On the margin: 1.3 million people

The economy seems to be plodding along at a 2-3% real growth rate pace, pretty much the same as it has for the past several years. But amidst all the ho-hum statistics there is one that stands out: the demise of emergency unemployment benefits for 1.3 million people in early January, and the 1.3 million increase in the labor force that followed. I'm speculating a bit here, since we really don't have enough data to be sure, but I can't resist highlighting any important change on the margin, since that's where all significant changes occur. What this statistic could mean is that there are 1.3 million people who rather suddenly received a new incentive to look for and accept a new job, and that could introduce a new dynamic to the labor market that could end up giving a modest boost to growth over the course of the year.


The chart above shows what's happened: the "Emergency Claims" program, which began in mid-2008, authorized up to 99 weeks of unemployment benefits. It expired at the end of last year, at which time about 1.3 million people were receiving benefits. That reduced the total number of people receiving benefits by about 22%, literally overnight. That's definitely a big change on the margin. What we don't know for sure yet is what those 1.3 million people have decided to do since then.


The chart above shows the size of the civilian labor force—the number of people working and looking for work. Since the end of last year the labor force has jumped by 1.3 million (note the part of the chart I've highlighted). As I mentioned last week, this is unlikely to be a pure coincidence. Theoretically, the 1.3 million people that were receiving benefits before the emergency program expired were included in the labor force data, but it's possible that some at least were pretending, when asked, that they were looking for a job.  Regardless of how accurately the Dept. of Labor's survey was in picking up on this nuance, it is the case that 1.3 million people suddenly stopped receiving a weekly stipend and many of them may be more actively seeking employment. At least some portion of the 1.3 million who lost their benefits are now more genuine members of the labor force. They could end up boosting the number of new jobs in the months to come, an outcome already made more likely by the return of better weather. 


Last week, the number of people filing for new unemployment benefits fell to the lowest level since May, 2007—300K. It doesn't get much better than that. If the level of claims holds at 300K for the rest of the month, the degree of "workforce disruption" as measured in the chart below (claims as a % of the workforce) will be very close to an all-time low. This is the weakest recovery ever, and the unemployment rate is still very high, but at least those who are working have an excellent chance of keeping their job. Things could be a lot worse.


Tuesday, April 8, 2014

The market looks at Ukraine and shrugs

If the situation in Crimea/Ukraine has the world on edge, markets don't seem all that worried. Key indicators of the market's perception of systemic risk and the economy's health have hardly budged, and point to continued, albeit relatively sluggish, growth.


The Euro is up a bit so far this year, but as the chart above shows, it has been strengthening since mid-2012, when it first became clear that the Eurozone sovereign debt crisis was receding and the Eurozone economy was emerging from its recession. A stronger Euro is a good sign that the outlook for the Eurozone continues to improve.


Eurozone equities, shown in the red line of the above chart, have been tracking U.S. equities higher since mid-2012, albeit with a significant lag. To judge from the behavior of Eurozone equities and the Euro, the outlook for the Eurozone continues to improve despite the uncertainty that has arisen in Ukraine.


Eurozone 2-yr swap spreads, shown in the chart above, have been falling for the past several months, and are close to their lowest level in many years. This suggests that systemic risk in the Eurozone is almost down to normal levels (e.g., spreads of 20-25 bps). It's clear that whatever problems the Eurozone faces today are, in the eyes of the market, an order of magnitude less than the problems caused by the sovereign debt crisis a few years ago. It appears that, for now, Eurozone growth prospects are trumping the risks of Russian incursions into neighboring countries.


U.S. 2-yr swap spreads, shown above, are still trading at extraordinarily low levels, which means that markets are extremely liquid and generally quite healthy. It's hard to see here whether rising geopolitical risks have made any difference at all to the U.S. economy and investors' confidence.


The chart above shows the yield spread between investment grade and high-yield corporate bonds—a good measure of the likelihood of a significant deterioration in the economy. By this measure, the economic outlook is still improving, with credit spreads at or near post-recession lows. 


The Vix index, shown above, has ticked up a bit in recent weeks, but remains relatively low compared to where it has been in recent years, when the Eurozone sovereign debt crisis threatened the global recovery. Markets are a little worried, but no one is paying outrageous sums to seek downside protection; if they were the Vix index would be much higher, since it is an indication of how expensive it is to buy put and call options in order to limit one's downside risk.


Gold prices are up about $100/oz. so far this year, but as the chart above shows, that is in the nature of a minor blip on the geopolitical risk radar screen. On the margin over the past few weeks, gold prices and TIPS prices are down, which suggests the market has actually become less worried about an end-of-the-world scenario developing. I hasten to add, however, the gold prices are still quite high from a long-term historical perspective, and the real yields on TIPS are still quite low. Both tell me that markets are still willing to pay a substantial premium for the ultimate safety of gold and the default-free inflation protection of TIPS. There is still a good deal of risk aversion out there, but on the margin it is declining.

I'm merely reading the market tea leaves here, not trying to forecast the outcome of what's going on in Ukraine and the Middle East. It strikes me as somewhat unusual that the market would be so relatively complacent in the face of problems that could become quite serious if left unchecked. For those folks who are very worried, it's not too late—or too costly—to seek protection from events that could threaten the health of the economy and push equity prices lower. Options are not terribly expensive, and equity prices are still very close to their post-recession highs.

Friday, April 4, 2014

9 million new jobs and counting

Jobs growth picked up in March as weather problems faded, but there is still no sign of any meaningful acceleration in the economy's growth fundamentals, which remain in a 2-3% range. If there was anything noteworthy in today's employment report, it was the 1.3 million year-to-date increase in the labor force. 


As the chart above shows, the number of private sector jobs hit a new all-time high in March. The private sector has finally finished recovering from the Great Recession and is now moving on to new highs. Since the post-recession low in early 2010, the private sector has created almost 9 million jobs.


As the chart above shows, private sector jobs have been growing at about a 2% annual pace for the past three years. That is roughly equivalent to 200K jobs per month. Given that the weather was still unusually cold in March, but jobs growth was close to "normal," it could be the case that underlying conditions in the labor market are actually improving. If so, we should see the evidence of that in coming months.


After five years of unusually slow growth, there are signs that the labor force (the total of those working and those looking for work) is once again growing. Over the past six months, the labor force has grown at a 1% annual pace, which is the long-term average growth rate. The labor force grew by 1.29 million people since December, and that is so close to the 1.35 million that lost their emergency unemployment benefits beginning January 1, 2014 that it is unlikely to be a pure coincidence. Many of those who who had been receiving unemployment checks for up to one year may have decided to renew their efforts to find a job.

So although March job gains were average, it is possible that underlying conditions in the labor market are improving on the margin. In the meantime, 9 million new jobs is nothing to disdain.