


Sunday, October 31, 2010
"Less We Can"
That's the clever slogan of Mark Grannis, a distant relative of mine, and the Libertarian candidate in Maryland's 8th Congressional District. George Will calls attention to him and to other notable battles being waged in his article "What's at stake Tuesday."
Friday, October 29, 2010
M2 velocity suggests a stronger Q4 GDP

I'm going to leave it to others to tear apart the Q3 GDP number (which was a bit disappointing) and focus instead on where GDP is headed, from a top-down perspective. Quarterly GDP numbers aren't very useful, in any event, since they are old news by the time the first estimate comes out, and then they are subject to multiple revisions. The point of paying attention to the economy is to know where it's likely to go in the future, not where it's been.
Let's start with money. The M2 measure of money is arguably the best (and it's my long-time favorite): it is published weekly with only a minor lag, it's subject to only minor revisions, its definition hasn't changed materially over the years, and it's displayed the most stable relationship to nominal GDP over long periods of any measure of money.
This first chart shows M2 velocity, which is nominal GDP divided by M2. The inverse of this measure is money demand: how much of a year's spending the economy wants to hold, on average, in the form of currency, checking accounts, retail money market funds, small time deposits, and savings deposits. Note that, as the chart above shows, for the past 50 years M2 velocity has been virtually unchanged on balance, though it has oscillated up and down in the intervening years.
The big story behind the economy's collapse in 2008 was a huge surge in money demand (i.e., a huge decline in money velocity). People thought the end of the world was approaching, and so they stopped spending and started hoarding cash; the demand for money surged, and money velocity collapsed. The velocity of M2 fell almost 13% from the end of 2007 through mid-2009, the largest decline in velocity on record. This process has been partially reversed since the economy started growing in mid-2009, as M2 velocity has risen 1.9%. Confidence is slowly returning, and people are beginning to un-hoard some of their cash. Nevertheless, the revival of M2 velocity is still in its infancy.

M2 velocity only fell modestly in Q3/10, as nominal GDP grew at a 4.4% annualized rate and M2 grew at a 5.0% annualized rate. I suspect that it will be trending higher over the next several quarters as confidence continues to build, but let's assume that velocity is unchanged in the current quarter. With M2 currently growing at a 7% annualized rate over the past six months, and at a 8% rate over the past 3 months, we could reasonably expect M2 to rise at least 6% (annualized) in the current quarter. If it does, and velocity remains stable, that would imply a 6% nominal rate of growth for GDP in Q4/10. Of course, if velocity picks up, then nominal GDP could grow even more. Furthermore, if inflation in the current quarter remains at the 2% pace of Q3, then we could see real GDP growth in Q4/10 of 4% or more.
As one commenter mentioned earlier today, we would need to see at least 4.5% real growth in the fourth quarter in order for real growth to equal or exceed 3% for all of 2010. I don't think that's unrealistic at all. I know there are a lot of assumptions behind this forecast, but I don't think I've made any that are unreasonable, so I'm sticking with my call for 3-4% growth for the current year and for the average of the next several quarters. If I'm wrong it won't be by much. And given the market's penchant for seeing a double-dip recession around every corner, even if growth this year comes in at 2.5% that will be more than what I think the market expected to see.

In this last chart I've plotted the level of real GDP against a 3% trend. This gives us a proxy for what the so-called "output gap" might be, which I estimate to be about 7-8%. Growth has to exceed 3% for the output gap to close, and until it begins closing we are unlikely to see any meaningful reduction in the unemployment rate.
I think it's possible for growth to exceed 3%, especially in the wake of next week's elections. I firmly believe the elections will have a powerful influence on the course of fiscal policy, since they will send a clear mandate to Washington to a) slow the growth of government, b) roll back ObamaCare, c) keep cap-and-trade on hold, and d) extend the Bush tax cuts. This will result in a much-needed business confidence boost, which in turn should unleash at least a mini-surge in new investment and new jobs, not to mention a boost to M2 velocity.
If there is a dark cloud in this otherwise bright forecast, it is that inflation pressures are likely to gradually build, since the Fed—with its Phillips Curve/output gap mentality—is likely to be slow to respond to signs of an improving economy. But inflation concerns will be relegated to second place for at least awhile, while markets breath a sigh of relief.
One more sign that deflation is history

The GDP deflator is the broadest measure of inflation, and with the release today of Q3 GDP statistics, we see that the deflator has been rising at just over a 2% annualized rate for the past two quarters. The deflator dipped into deflationary territory in Q4/08 (-1.2%) and again in Q4/09 (just barely, -0.3%), but it's been positive for the past three quarters. If we take recent Fed pronouncements at face value (i.e., inflation is unacceptable if it's less than 2%), then a 2% pace for the GDP deflator is close enough to perfection for government work. The time for stimulus has come and gone.
It's also very important to note that inflation has turned positive despite the fact that the economy remains far below its "full employment" level, with tons of "idle capacity." According to Phillips Curve dogma, which permeates Fed thinking, this is not supposed to happen. With the economy suffering from so much "slack," inflation pressures should be virtually nonexistent or most likely negative. This is the thinking that has propelled the Fed to the cusp of QE2: they feel they have to pump up demand or face some serious deflation. Well, so far it's not working out that way. That's one more reason why QE2 is unnecessary—the Phillips Curve theory does not adequately explain how inflation works.
Thursday, October 28, 2010
Claims continue to slowly improve

If we ignore the outlier drop in claims last July—which occurred because factory layoffs weren't as large as the seasonal adjustment factors expected—then the most recent claims number marks a new low for the year. The reason? For the past few weeks, actual claims have not risen as is typical for this time of the year. A few more weeks of this and we would see a notable decline in the seasonally adjusted number, and that would be bullish for the economy's prospects.

Meanwhile, the number of people receiving unemployment benefits continues to decline—down by 4 million since the peak early this year. That is big news. Undoubtedly, some of those who have fallen off the dole have found work, while others are increasingly desperate. The combination of those two factors adds up to more people working and more people who are more motivated to find a job. Borrowing from commenter "brodero," I note that Gallup's Job Creation Index has moved to a new, post-recession high. Taken together, it must be the case that the economy continues to improve, albeit slowly.
Wednesday, October 27, 2010
QE2 rumored to disappoint, but that's good news
Today's WSJ article, "Fed Gears Up for Stimulus", appears to be a Fed leak that discloses a QE2 program "worth a few hundred billion dollars over several months," far less than the Wall Street pundits were predicting as recently as yesterday.
Not surprisingly, the stock market was immediately disappointed, though it later recovered much of its losses on the day. The Treasury market took it on the chin—also not surprisingly—though it would appear that suspicions of a disappointing QE2 must have been at work for the past two weeks, since 10-yr yields bottomed Oct. 11th at 2.39% and ended today at 2.71%. Gold peaked at $1387 on Oct. 14th, and ended today at $1328. Most encouraging, I think, was the fact that the dollar bottomed Oct. 15th and closed today up 2.7% from that low. All in all, these moves were predictable, given a disappointing QE2 announcement. Despite the 30 bps rise in 10-yr yields in the past few weeks, stocks are roughly unchanged.
Maybe this was a trial balloon from the Fed. If so, the takeaway should be this: there is NO NEED for QE2 at all. Faced with the prospect that QE2 would be quite small and dribbled out over months, the stock market barely budged, while Treasuries and gold suffered a drubbing and the dollar rose nicely. This means the market viewed QE2 as only marginally—if at all—important to the economy, but very important to the dollar and Treasury bonds. Another injection of money from the Fed was unimportant insofar as the economy was concerned, but the prospect of fewer dollars being jammed into the system was a great relief for holders of dollars and it gave pause to those running to gold for protection.
I'm quite pleased with today's action, since to me it is a sign of a market that is operating rationally. The message from the market to the Fed should be clear: we don't need your stinkin' QE2—it would only muddy the waters.
Capex still strong

September orders for new capital goods were a bit weaker than expected, but this notoriously volatile series needs to be viewed from a perspective that includes several months or more. Over the past six months, orders are up at an 8.3% annualized rate, which is a good deal faster than the pace at which orders grew 15 months after the end of the 2001 recession. Over the past year, orders are up almost 14%, a pace that rarely has been exceeded in the past 20 years. I see nothing here to worry about, and it's worth noting that U.S. companies are still sitting on a trillion-dollar pile of accumulated profits; if the outlook for fiscal policy improves and corporate taxes are cut, that profits pile could power some truly impressive investment in the future.
Tuesday, October 26, 2010
QE2 is not only unnecessary but foolish (cont.)
As next week's FOMC meeting approaches and estimates of the size of Fed asset purchases range from $1 trillion to many trillion, I want to reiterate my view that another round of quantitative easing—regardless of size—is unnecessary and foolish.
QE2 would only be justified and warranted if deflation were a serious risk and/or the economy were displaying obvious signs of a liquidity shortage or liquidity crisis. Neither is the case today, and I offer the following as evidence:

The most recent measures of inflation are all positive. Over the most recent 12 months, the core CPI is up 0.8%; the CPI is up 1.3%; the PCE deflator is up 1.5%; and the PCE core deflator is up 1.4%. Over shorter time intervals none show any significant deceleration. (In any event, the CPI is the last place you would expect to find evidence of rising inflation.) The Producer Price Index is rising at a rate clearly above zero. Producer prices represent inflation pressures in the early stages of the inflation "pipeline." The PPI crude index is up 20% in the past year, while the PPI intermediate index is up almost 6% in the past year. As prices rise beginning at the early stages of production, they eventually get passed on to consumers. For example, we've recently heard from General Mills that they plan to raise cereal prices, which is in part a response to the 50% increase in wheat prices over the past four months. Price hikes such as this, and others announced by Starbucks, MacDonald's, Kimberley Clark and Goodyear, will almost certainly find their way into the CPI. (HT: Larry Kudlow)

Gold and non-energy industrial commodity prices are in a headlong dash to higher price levels. We haven't seen such widespread and powerful inflation at the commodity level since the inflationary 1970s. To think that prices of a broad range of industrial commodities can double or triple without having any positive or significant contribution to the general price level is beyond foolish. Gold is the most monetary of all commodities, and it typically leads. Gold is telling us that we haven't seen the end of the current rally in commodity prices.

The dollar is declining against almost all currencies, and is at or close to its all-time lows, both in nominal and real terms. When the dollar loses its purchasing power against gold, most commodities, and most currencies, that is about as close as you can get to a guarantee that it will lose its value against just about everything, on average, and that is the most fundamental definition of inflation that I know. The dollar is weak because the Fed is pumping out more dollars than the world wants; another QE2 will only make the dollar weaker by creating still more unwanted dollars. It is inconceivable that the dollar can fall further without at some point triggering higher prices throughout the economy.

All measures of money are growing at significantly positive rates. Over the past 6 months, M1 is up at a 10.4% annualized rate; M2 is up at a 6.5% annualized rate; MZM is up at a 7.3% annualized rate; and currency in circulation is up at a 6.6% annualized rate. The nominal increase in M2 since the onset of the financial crisis in Sep. '08 is a whopping $945 billion; currency in circulation has surged by $128 billion; and required reserves for U.S. banks have expanded by over 50%. This adds up to solid evidence that some portion of the $1 trillion that the FOMC has pumped into the banking system is being used to create new deposits and loans.
As evidence that there is no liquidity crisis, I offer my previous post which details the dramatic improvement in swap and credit spreads. Swap spreads are so low, in fact, that they virtually rule out even the hint of a concern about the health of our financial markets. As evidence that not only are deflationary expectations nonexistent but that inflation expectations are now rising, I offer my earlier post on how TIPS and Treasuries are priced to rising inflation.
The Fed has been very vocal on the subject of QE2, and that probably means that they are preparing the ground for a QE2 announcement which is almost universally expected to come next week. But the Fed governors are not unanimously behind QE2. Fed Governor Hoenig yesterday said that more quantitative easing would be a "dangerous gamble." Fed Governor Fisher last week said that the "Fed is not committed to further asset purchases," and that the "debate on possible easing may not be completed in November."
There is no need for any QE2, and certainly no need for trillions more of asset purchases. Therefore, I think there is a strong case to be made for a QE2 announcement next week that "disappoints." Why couldn't the Fed announce a token QE2 (e.g., a hundred billion in installments) to reinforce the fact that they are committed to avoiding deflation, but also unwilling to provoke too much inflation? While such an announcement would seem likely to result in an equity selloff, I would view it as very good news from a long-term perspective, and thus an excellent buying opportunity. If the Fed does the right thing, that can never be bad. Downplaying the risk of deflation and the need for a massive QE2 would also send a strong message of badly-needed optimism.
UPDATE: Art Laffer, in a letter to clients today, points out that the Bernanke Fed has suffered an unprecedented level of dissension. "Of the 32 FOMC policy decisions under Greenspan's watch, there were three that received a dissenting vote ... under Bernanke's stewardship, 19 of 42 FOMC policy decisions have faced a dissenting vote, with 21 total votes against." Moreover, quite a few of the FOMC Governors and regional Fed Presidents have questioned the benefit of, actively criticized, or pointed out potential negative consequences of further quantitative easing: Fisher, Hoenig, Kocherlakota, Lacker, Plosser, Warsh, and even the perennially dovish Yellen. In short, there is good reason to suspect that the FOMC decision next week may fall short of market expectations. The market may view that as bearish for the economy, but I would view it as ultimately bullish. Too much monetary ease is not something we need or should be hoping for at this juncture.
Spread update: still room for improvement


The spread between the yield on risky bonds vs. risk-free Treasury bonds is a key indicator of all sorts of things: financial market health, general liquidity conditions, risk-aversion, economic health, and counterparty risk, to name a few.
I start here with swap spreads, since they are the most liquid part of the credit market. Swap spreads in the U.S. have been very low this year, suggesting that liquidity is abundant and the economic fundamentals have improved dramatically; the behavior of U.S. swap spreads could even be interpreted as pointing to a stronger-than-expected recovery over the next year. Swap spreads in Europe jumped earlier this year on concerns that a Greek or PIGS default would provoke a financial crisis, but since then they are gradually settling back down, suggesting that crisis conditions in Europe are slowly passing. But considering that German 2-yr yields have doubled since early June—which marked the height of the Greek crisis—the modest but ongoing decline in Euro swap spreads might even be interpreted as pointing to a substantial recovery in the Eurozone economies in the next year.
The second chart features credit default swap spreads on 5-year securities. These spreads have come down dramatically, reflecting sharply lower expected default rates, which in turn has a lot to do with improving economic fundamentals and accommodative monetary policy. When the economy is improving and money is in abundant supply, it's much easier for companies to service their debt, so default rates tend to fall. Despite the rather spectacular decline in spreads since late 2008, spreads are still quite high relative to where they could be if economic and financial conditions were more normal.
The third chart features spreads on corporate bonds in general. Here too we see substantial improvement and lots of room for further gains. Note that today's spreads are at or close to the levels that preceded the 2001 recession. In short, despite all the improvement, the market is still priced to the expectation that conditions will be challenging in the months to come. (We've come a long way from late 2008, when the credit markets were priced to Armageddon; now they are priced to a garden-variety recession.)

Swap spreads have often been leading indicators of other spreads, so the message of these charts is that there likely is a lot of good news still in the pipeline for investors in corporate debt—particularly of the high-yield variety—and a lot of good news regarding the outlook for the economy in general.
The biggest risk to corporate debt right now is that Treasury yields are likely to soar if and when the economic news improves. A significant rise in Treasury yields could put some upward pressure on corporate yields (causing lower prices), but the fact that spreads are still unusually wide should provide a decent cushion against losses. Plus, since higher Treasury yields would likely occur concurrent with improving economic news, spreads would very likely contract in a rising Treasury yield environment—as has almost always been the case in the past.
Full disclosure: I am long investment grade and high-yield debt via a variety of mutual fund vehicles at the time of this writing. (Note to retail investors: buying and selling individual bonds can be extremely expensive for non-institutional investors, due to very wide bid-ask spreads, so commingled vehicles are highly recommended.)
The $25 trillion recovery

Here's another milestone in the current global recovery: the market cap of global equities has risen $25 trillion from last year's low, a very impressive gain of no less than 100%. Millions of pessimists hanging out in cash since then have left a lot of money on the table.
Housing price stability

According to the Case Shiller index of home prices in 20 major markets around the country, housing prices have been roughly stable for 18 months. In nominal terms, prices have actually risen by almost 5% from last year's lows (on a non-seasonally adjusted basis they are up about 7%); the chart above shows prices in real terms, which are up only slightly. Relative to early 2000, when the housing boom was only just getting started, prices in real terms are up only 16.5%, but real personal income is up 20.6%. And since mortgage rates have fallen from over 8% in 2000 to a mere 4.25% today, housing affordability has skyrocketed; homes today are effectively cheaper than they have been in many decades. It's not surprising, therefore, that the housing market is clearing, and has been clearing for quite some time.
I am well aware of all the many forecasters calling for a renewed bout of housing price weakness, to be brought on by banks dumping tons of foreclosed homes on the market. But I am more impressed by the confluence of positive fundamentals: We've had 18 months of relative price stability, which no doubt owes something to the lowest mortgage rates in history. The housing market has had almost 5 years to adjust to new realities, and during that time, home building activity has dropped nearly 75%. Residential construction is now by far the smallest relative to the overall economy (2.5%) that it has ever been. As a consequence, excess home inventories have been reduced to a substantial degree, and prices in real terms have adjusted downwards by more than one-third. The economy has been recovering from recession for 16 months; incomes are rising, and employment is rising. All measures of money are growing at very healthy rates, and the Fed is undertaking extreme measures to ensure that monetary conditions present no obstacle to further recovery.
Taken together, these facts strongly suggest that the housing market stabilization we have observed over the last year or so is the real thing, not just a chimera.
Monday, October 25, 2010
TIPS update: dismal growth and rising inflation

The real yield on 5-yr TIPS has been negative for more than a month now, marking a new milestone of sorts for the almost-14-year-old TIPS market. And as the top chart shows, the real yield on 10-yr TIPS is approaching zero, another new record low. What does this mean? In my view, the behavior of the TIPS market tells us that 1) the market has very low expectations for U.S. growth, and 2) the market's inflation expectations are rising, increasing the demand for TIPS.
One way to think of negative real yields on TIPS is like this: demand for TIPS today is strong enough that investors are willing to give up some portion of expected future inflation (equal to the amount by which real yields are negative) in order to gain the protection of TIPS. When real yields on TIPS are positive, investors can expect to receive the future rate of inflation plus a real yield "lagniappe." Those who purchase 5-yr TIPS today can expect to receive the future rate of inflation minus 55 bps per year. To be willing to give up some portion of future inflation is a sign of pretty strong demand for inflation protection, just as almost-zero real yields (and record-high prices) on 10-yr TIPS is a sign of very strong demand.

This next chart shows how real yields on TIPS have been depressed by declining yields on Treasuries. Inflation expectations (the difference between nominal and real yields) today are not too different from what they have been on average over the past decade, but nominal yields on Treasuries are at modern-day record lows. TIPS yields have to decline by at least as much as Treasury yields if inflation expectations are to remain constant. What we've seen since late 2008, on balance, is that TIPS yields have declined by more than Treasury yields as inflation expectations have risen. So a big reason for zero or negative real yields on TIPS is simply that Treasury yields are incredibly low.
Now, Treasury yields are incredibly low because the market believes that the Fed is not only going to engage in QE2, but that the Fed is also going to keep short-term interest rates close to zero for at least the next 12 months. Check the evidence: Fed funds futures contracts maturing in Feb. '12 are priced to the expectation that the funds rate will average 30 bps that month (note that it has averaged 20 bps for the past six months). In fact, since 2-yr Treasury yields are a mere 0.35%, this implies that the market expects the funds rate to average 35 bps over the next two years. In short, the market expects extremely low short-term rates for at least the next 2 years. This belief in low short-term rates for a long time automatically depresses yields on Treasury securities out to 10 years or so.
Admittedly, we are in uncharted waters here, with the prospect for another round of quantitative easing. But it's not unreasonable to say that expecting the Fed to keep rates close to zero for a very long time equates to a belief that the outlook for U.S. economy is nothing short of dismal. Imagine how yields would soar if the market (and/or the Fed) began entertaining the notion that the economy was starting to grow at a more health pace!

This next chart shows the recent, but strong correlation between the steepening of the long end of the Treasury yield curve and the market's 5-yr, 5-yr forward expected inflation rate. The former can be thought of as a measure of how much the Fed is artificially depressing 10-yr yields with QE2 and promises to keep the funds rate very low for a very long period. The latter is the Fed's preferred measure of the market's inflation expectations. By both counts, inflation expectations are rising, and rising in line with expectations that QE2 is essentially a done deal. The dollar has weakened and gold has strengthened as well (since the end of August when QE2 talk started getting serious), confirming that QE2 is likely to rekindle inflationary pressures.

As the next chart shows, there is a very strong and enduring correlation between the level of real yields on 5-yr TIPS and the market's expectations for future Fed policy (which I've proxied by comparing the 1-yr forward expectation for short-term interest rates to current levels of inflation). Real yields decline as the market expects the Fed to ease (with easing being defined as a reduction in the real short-term rate), and they rise as the market expects a future tightening. This makes sense if you realize that tighter monetary policy should reduce inflation fears, and that in turn should result in reduced demand for TIPS, which in turn means lower TIPS prices and therefore higher TIPS real yields.
Note that real yields today appear to have "overshot" expectations for future monetary ease. If I used a higher-than-current inflation rate, however, this overshoot would disappear since the 1-yr forward real LIBOR rate would become more negative. So this chart provides more evidence that the market is bracing itself for rising inflation.
From an investor's perspective, buying TIPS for inflation protection has become an expensive proposition. That's because the market is now embracing the idea that inflation is likely to rise (albeit not by very much), and the market demands that you "pay up" for protection. TIPS are also expensive because the Fed has pushed Treasury yields down to extremely low levels. Plus, both the Fed and the market have embraced the notion that the U.S. economy is going to be very weak (with a large "output gap") for a long time. If you expect to make money via rising TIPS prices, we're going to have to see the economy sinking into a double-dip recession, and/or the Fed surprising with a bigger-than-expected QE2 (since that would further depress Treasury yields). That's what it would take for TIPS yields to decline further (and TIPS prices to rise).
The real risk to TIPS today is not that inflation fails to rise, though that might depress their prices somewhat. The real risk is that the Fed fails to engage in QE2, or that the amount of QE2 disappoints the market's fairly aggressive assumptions. If the Fed disappoints and/or the economy improves, both real and nominal yields could rise significantly.
This is just one more way of saying that the extremely low level of Treasury yields is only tenable so long as the market and the Fed believe that the economy is in dismal shape. Investors have many trillions of dollars sitting in cash and in Treasuries because they have a deep and abiding fear of the future of the economy. Optimism is in very short supply these days, despite the the growing likelihood that next week's elections are going to mark a sea change for the better in the course of U.S. fiscal policy.
Thursday, October 21, 2010
Inflation expectations are alive, well, and rising
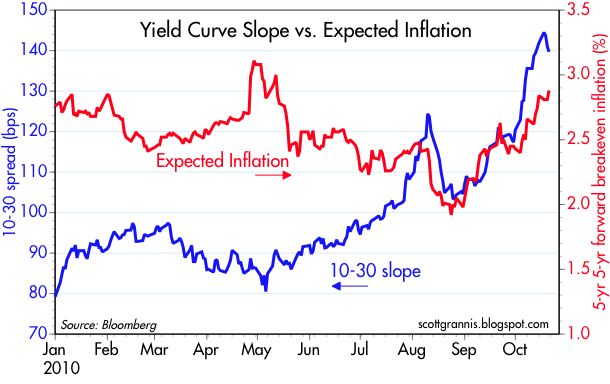
I'm watching the yield curve and TIPS' implied inflation expectations carefully these days. As I've noted several times in the past several weeks, the pronounced steepening of the yield curve at the long end (blue line in this chart) has correlated pretty well with a significant increase in the market's future inflation expectations (red line). Forward-looking inflation expectations have increased from 2% a year at the end of August to almost 3% today. The only time in the past 5 years that we have had a similar-size increase in inflation expectations over a short period was early last year, when the market began to realize that the economy was not falling into a depression/deflation abyss.
The Fed is pulling down Treasury yields out to 10 years, but the Fed has no control over yields beyond that. The increased (and record-setting) spread between 10 and 30 years reflects a market that is balking. The prospect of another round of quantitative easing has convinced the market that inflation is headed higher, much as the Fed now seems to want. Investors are shunning long-term bonds because they are increasingly worried about long-term inflation risks.
This is not good, of course, and that's why the dollar is down since the end of August, and gold is up. Stocks are not getting hit, however, but I think that can be explained if you assume (as I do) that stocks have been depressed for a long time over the risks of a double-dip recession, deflation, and a punishing increase in future tax burdens. The double-dip has so far failed to show up, QE2 all but erases the possibilities of deflation, and the November elections increasingly promise to result in a reduction in government spending and future tax burdens. The combination of all three means that future after-tax cash flows are now expected to be stronger than the market had been thinking. That's why stocks are rallying even though the inflation fundamentals are deteriorating.
UPDATE: Of course, the more inflation expectations rise, the less likely we are to see the Fed proceed with its QE2 program. We've already heard more than one Fed governor say that QE2 is not yet a done deal. I still think there's an outside chance that the Fed does little or nothing in the way of QE2 after next months' FOMC meeting. Though that might be a disappointment to the market at first, any selloff should be viewed as a buying opportunity. It's never a bad thing for the Fed to do the right thing.
Leading indicators still positive

The Leading Indicators (weekly hours (manufacturing), weekly jobless claims, manufacturers' new orders, vendor performance, building permits, stock prices, M2, yield curve slope, and consumer expectations) continue to reflect an economy that is likely growing—no sign at all of a double-dip here.
Claims are stable, may be improving


On a seasonally adjusted basis, claims last week fell to a level below the average so far this year (top chart). Actual claims (second chart) have not yet experienced the increase that is typical for this time of the year, but it is too early to tell whether this is a big deal or not. The next few weeks should tell the tale. If actual claims fail to increase as expected, then the adjusted number will start declining and that would be good news to a market that is still priced to very slow growth.
My growth expectations remain unchanged from my prediction at the end of 2008: 3-4% real growth on average. I think this number is reasonable, because I expect employment to increase about 1% a year (a number that is pretty meager in fact, and less than what we have seen so far this year in the private sector), and I expect the productivity of all those working to increase by about 2% a year (and that is less than the 3% average over the past two years, less than the 2% average over the past several decades, and less that the 3.7% rate we've had over the past year). Growth in the labor force plus growth in productivity gives you real growth, and my assumptions are actually quite conservative. Growth of 3-4% is consistent with an unemployment rate that remains painfully high for some time to come, and with a recovery that is painfully slow.
If Congress can extend the Bush tax cuts after the election, and if the electorate delivers a clear mandate for change (i.e., less spending, and less government intervention in the economy), then most likely I would raise my growth forecast for next year.
Tuesday, October 19, 2010
Pity the Chinese

The Chinese own about $1 trillion worth of Treasury securities, whose average yield is now probably in the range of 1-1.5%, and they are being forced to take a beating on those holdings. They are in a real bind, because they are being pressured to appreciate their currency by U.S. politicians who are sadly ignorant of how global trade and capital flows work, and by the Federal Reserve, the architect of the ongoing loss of the dollar's value. In the past four months, China's central bank has allowed the yuan to appreciate over 8% against the dollar in an attempt to alleviate those pressures.
China's reasons for doing this are twofold: to appease U.S. policymakers who are arguing for a much more dramatic appreciation of the yuan, and to minimize the inflationary impact of being tied to a weak and falling dollar. Pegging its currency to the dollar is the cornerstone of China's monetary policy, and if the dollar weakens, then the yuan also weakens, and this is equivalent to a monetary ease which will sooner or later show up as higher Chinese inflation. In fact, China's CPI has already risen, on a year over year basis, from a low of -1.8% in July '09 to 3.5% as of August '10. The weakening of the dollar, which has carried the yuan down with it, is the proximate cause of this reflation.
Revaluing one's currency doesn't come cheap, however, especially when the currency you are revaluing against is also the currency in which the majority of your reserve assets are denominated. The appreciation of the yuan over the past four months has effectively wiped out a little over 3 year's worth of interest on their dollar security holdings. Further yuan appreciation, which seems likely, will wipe out even more of the value of China's foreign bond holdings. They are truly caught between a rock and a hard place.
This reminds me of the massive losses that Japan suffered as result of the appreciation of the yen, which rose from 250/$ in 1985 to 80/$ at its peak in 1995. This 200% yuan appreciation destroyed fully two-thirds of the value of the countless billions of dollar assets that Japanese savers had accumulated. Recall that Japan was a major export engine at the time, its aging population had a high savings rate, and the destination of choice for those savings—which were larger than could be accommodated by Japan's own economy—was the U.S.
Remember the book "Rising Sun
And so it is with the Chinese. They sell us mountains of cheap goods, then turn around and invest most of the proceeds (equivalent to our trade deficit with China) in U.S. Treasury securities. We get the goods, and we get to keep the money. Then we devalue the dollar, and they lose on their investment. Why we would want them to stop doing this is beyond me, though if I were a Chinese citizen, I would be furious with my government for directing such massive quantities of my country's export earnings to Treasuries. The central bank of China has no need to further increase its already-massive reserves; instead, the government should be relaxing capital constraints, allowing Chinese citizens more freedom to save and invest abroad in the types of vehicles with which they feel most comfortable. China's workforce is aging daily, and like Japan a few decades ago, China's economy cannot accommodate all the savings of the Chinese people—they are essentially forced to save overseas.
Contrary to what you read in the press—which mistakenly believes that our large trade deficit with China is something we need to worry about—China is the one that needs to worry, not us.
UPDATE: I highly recommend John Cochrane's WSJ article, "Geithner's Global Central Planning." Key quote: "The Chinese government's accumulation of U.S. debt represents a tragic investment decision, not a currency-manipulation effort." The article is an elegant ridicule of all those who think they can spot and treat a global trade or currency "imbalance." It should be required reading for all students of economics.
Residential construction is in an upward trend

September housing starts exceeded expectations, and data from prior months were revised upwards. The pattern is becoming clearer with the passage of time: residential construction bottomed about 18 months ago, and the upward trend in this volatile series since early last year works out to a 14% annualized growth rate, which by itself is actually pretty impressive. For all the woes that still surround the industry, it remains the case that we have seen the worst and conditions are now improving, albeit erratically. We'll very likely to see substantial improvement over the next several years at least, given the depths to which activity sunk in 2008. I would note, of course, that residential construction now represents such a small part of GDP (about 2.5%) that the ups and downs of housing starts are going to have a very small impact on the overall economy no matter what direction the trend ends up heading.
Monday, October 18, 2010
Industrial production does not support the case for QE2


The September industrial production and capacity utilization releases came in a bit below expectations, but in the context of rising commodity prices and improving financial market health (e.g., very low swap spreads, generally declining credit spreads, declining implied volatility of equity and bond options) I consider this to be a blip and not the beginnings of a double-dip recession.
As the top chart shows, most major economies are experiencing a gradual recovery in industrial production, with a bit of weakness apparent in the summer months. Despite this weakness, U.S. industrial production over the past six months has risen at an annualized rate of 5%, and Eurozone industrial production is up at an impressive 9.6% pace over the same period. We've still got a ways to go before recovering to the peak levels of 2008, but we're making progress, and that's the most important thing.
I'm most interested in the second chart, since that gives some insight into the future course of monetary policy. As this chart suggests, monetary policy has a strong tendency to follow the health of the manufacturing sector, which in turn is a decent proxy for the health of the overall economy. When the economy weakens, the Fed almost always eases (by reducing the real Federal funds rate), and when the economy strengthens, the Fed tightens (by raising the real funds rate).
The 2008-2009 recession saw industrial production fall to extremely low levels, but that has been followed by a decent recovery. The Fed eased as much as it could in response, though they were limited by the so-called "zero bound." Regardless, the economy appears to have recovered enough, according to my reading of this chart, to obviate the need for further easing. If the Fed just kept policy on hold while the economy continued to gain ground, that would probably be sufficient stimulus.
One of the glaring flaws behind the supposed need for a second round of quantitative easing (QE2) is that there is no evidence at all that the economy is being held back by a lack of liquidity—the Fed can't fix something that's not broken. All measures of the money supply are growing at healthy rates and are at all-time high nominal levels; swap spreads are unusually low; credit spreads are in a declining trend; and equity prices are rising. Furthermore, there is little reason to think that a further (and likely quite modest) decline in Treasury yields or mortgage rates would provide significant stimulus to the economy. After all, mortgage rates are already at all-time lows, and housing affordability is better today than at almost any time in the past 30 years.
The great majority of the excess reserves that were added by QE1 are still sitting on deposit at the Fed. Increasing bank reserves by purchasing additional Treasury and/or MBS would likely only increase further the amount of idle reserves, while putting only modest downward pressure on interest rates. The more the Fed tries to stimulate via the purchases of bonds, the more the market will worry that monetary stimulus will lead to higher inflation, and that in turn will reduce the market's willingness to hold bonds. So the Fed can try to bring down interest rates further, but they are going to be fighting mounting headwinds that are working to drive interest rates higher.
If QE2 (or talk thereof) is good for anything, it is to throw lots of very cold water on deflation fears. With the dollar at extremely low levels, gold prices over $1300, and commodity prices setting new all-time highs, the likelihood of deflation is already de minimis in my view. But the market still worries (albeit less so every day) about deflation, and so does the Fed. Eliminating deflation fears would thus change the expected distribution of cash flow risk by effectively eliminating much of the downside risk, and that argues strongly for rising equity prices, since equity prices are the discounted present value of future cash flows. And by the same logic, eliminating deflation risk should lead to a gradual improvement in confidence and therefore a continued economic recovery.
In short, the Fed has probably done all it needs to do already.
Friday, October 15, 2010
Federal budget update: still a significant concern


Spending has slowed, and revenue has picked up, with the result that the budget deficit has shrunk from a high of $1.48 trillion (about 10% of GDP) last February to $1.3 trillion (about 8.8% of GDP) today. Although it's difficult to see in the top chart, spending has actually picked up a wee bit in recent months, and if and when new programs like ObamaCare kick in, spending is quite likely to reaccelerate, pushing government spending up to about 25% of GDP (or more) on a permanent basis; that would represent a 20% expansion in the relative size of government compared to the average of the postwar period. This is the part of the budget that weighs most heavily on the economy, since government spending is chronically inefficient, and transfer payments—which make up over half of the budget—create pernicious disincentives to work. Even though the deficit is likely to shrink a bit more as revenues continue to increase, the deficit is very likely to remain large enough to also weigh heavily on the economy, since it is absorbing a significant portion of our savings.
It is of great concern as well that the Federal Reserve is contemplating the purchase of a substantial portion of the deficit (thus monetizing the deficit, which is what economic textbooks refer to as a sure-fire way to create inflation) in coming months.
If not for promise of significant change as a result of the upcoming elections, this budget picture would all but guarantee disappointingly slow economic growth for the foreseeable future. If spending can be reined in as Republicans are promising, and if the Bush tax cuts can be extended, that would create a lot of light at the end of this otherwise dark tunnel. Fiscal austerity in this environment would, ironically, provide a significant boost to growth going forward.
Retail sales well on the road to recovery


Retail sales in September rose by more than expected, resulting in strong 7.3% growth over the past 12 months (top chart). The bottom chart zeros in on the level of retail sales to show how they have nearly recovered from the big collapse of late 2008. Taken together with the relatively strong showing from imports in August (see previous post), this confirms that consumers are doing fairly well despite the persistence of high unemployment.
As a supply-sider, I don't attach a lot of importance to measures of consumer demand such as retail sales. Instead I think this is more a barometer of the general health of the consumer sector, and as such it corroborates much of the evidence of an ongoing economic recovery. At the very least, it is solid evidence that there is no double-dip recession underway.
Trade slowdown


As the top chart shows, both exports and imports slowed down in recent months, with exports slowing a bit more than imports. The slowing in exports is confirmed by a more pronounced slowdown in outbound container shipments from the ports of Los Angeles and Long Beach, as shown in the second chart. The result of more imports than exports was a somewhat wider "trade gap," the traditional bugbear of politicians and others who fail to understand how international trade contributes to higher living standards.
Although it's true that a widening gap between imports and exports subtracts from GDP growth, it's not necessarily the case that a trade deficit is a sign of economic weakness. When foreigners sell us more goods and services than we purchase from them, as has been the case for decades, foreigners must at the same time put more money into our stock, bond, and real estate markets than we put in theirs. In other words, a trade deficit must always be matched by a capital account surplus of equal magnitude. The dollars we pay out for foreign goods and services must, at the end of the day, be spent on something here, whether it be a bank deposit, a stock certificate, or a bond. You might say that foreigners are more interested in buying dollar-based financial assets and real estate than they are in buying our goods and services. (I should add that foreigners have traditionally converted a decent portion of their export earnings into $100 bills, which cost us almost nothing to produce.) A trade deficit is not a problem, since it means that foreigners are willing to contribute to our pool of savings by investing in the U.S.
It's entirely possible that the slowdown in exports was a reflection of foreigner's heightened concern over the possibility of a double-dip recession and/or a European banking crisis. Instead of buying more of our goods and services, foreigners wanted to put some extra money into our financial markets for safe-keeping. With markets beginning to feel a bit better about the future, it's also entirely possible that we might see foreigners taking some money out of the bank to buy more of our goods and services in the months to come, thus fueling stronger U.S. export growth.
Whatever the case, the still-strong growth rate of U.S. imports (up at an annualized 12.6% rate in the three months ended in August) reflects healthy demand from U.S. consumers.
Thursday, October 14, 2010
Our highly progressive tax code, illustrated

This chart (recently updated with 2008 data) needs wide distribution, especially now that Obama has rekindled the debate over whether the rich are paying their fair share of taxes. What it shows is that the top 1% of taxpayers (when ranked by income) pay about 40% of all Federal income taxes; the top 5% (which includes all those whose adjusted gross income exceeded $160K) pay about 60% of total taxes; and the top 10% pay fully 70% of all income taxes. You can find the data and commentary from The Tax Foundation here.
Those whom Obama would label as rich—those with incomes greater than 250K—and thus deserving of higher tax rates, paid (based on my interpolation of the data) about 50% of all Federal income taxes in 2008. Is that not enough of a burden?
There are other goodies here. Note that despite the 50% reduction in top marginal tax rates since 1980, the rich have paid progressively more and more of total income taxes. If that's not the Laffer Curve at work, I don't know what is. Plus, this shocker: the top 1% of income earners paid almost as much (92%) as the bottom 95%. We are deeply in a situation in which the few are supporting the many: the bottom 50% of income earners paid only 2.7% of total income taxes in 2008, and 52 million taxpayers paid no income taxes at all. This leaves the Federal government in the precarious position that has already crippled California: since only a relative handful of taxpayers pay the lion's share of taxes, government revenues are highly dependent on the health of the economy. The rich lose far more income in a recession than the poor, and that results in a huge drop in revenues whenever the economy hits a rough patch. The rich also have a greater ability to change the amount of income they earn, and to simply take their income somewhere else if they feel overly burdened.
Our tax code does not need to be more progressive. Instead, tax rates should be flatter and lower, and we should eliminate as many deductions as possible in order to broaden the tax base. The result would be a more efficient and stronger economy, and a more equitable distribution of the burden of government. Give more people some "skin in the game" by requiring them to share the cost of government, and we might find it easier to reduce the size of government. Allowing the burden of government to be borne by only a small portion of the population is not only inherently unfair but dangerous to the economy's long-run health.
QE2 is not only unnecessary but foolish (cont.)

Even as there appears to be an overwhelming consensus that the FOMC will commence a second round of quantitative easing following next month's meeting, the evidence is mounting that this is not a good idea. As this chart shows, the bond market is getting more and more worried about inflation. 10-yr Treasury yields are anchored by the Fed's pledge to keep short rates low for a long time, and by the evidence that suggests that economic growth is not accelerating and unemployment will thus remain high for a long time. But 30-yr Treasury bonds have no such constraints. They have risen 35 bps since the end of August, while 10-yr yields are essentially unchanged. Meanwhile, 10-yr real TIPS yields have fallen almost 70 bps over the same period as demand for inflation protection has increased. All this adds up to an 80 bps rise in 5-yr, 5-yr forward inflation expectations (as shown above in red), the Fed's preferred indicator of the market's inflation expectations.
This one chart should be held up at the FOMC table, with the following admonition: "Gentlemen, the market is clearly telling us that to move ahead with QE2 would increase inflation expectations beyond what is consistent with our mandate to seek relative price stability. Meanwhile there is little or no evidence that economic growth has been constrained by a lack of liquidity. I vote to tell the world that we remain disposed to avoid deflation at all costs, but to make no changes to monetary policy for the time being." What would be very exciting to hear—but highly unlikely, unfortunately—is at least a few words to the effect that fiscal policy (e.g., extending the Bush tax cuts) is the more appropriate policy lever to be pulling at this juncture.
Credit default swap spreads point to improvement

After jumping in May in the wake of the concern over a European credit crisis and expectations of a double-dip recession, CDS spreads have settled back down and are now only modestly higher than their lows early this year. I think this shows that financial markets are healthy and liquid, and there has been no deterioration in the economic fundamentals so far this year. The problem, of course, is what appears to be a reluctance of businesses to invest in new jobs and productivity enhancements.
Supply-siders like me keep insisting that the problem with slow growth can be traced to a lack of "supply; the economy can't grow if our productive capacity doesn't grow and if new jobs aren't created. Demand-siders (aka Keynesians) keep insisting that the problem is a lack of "aggregate demand;" if only everyone would spend a little more then we would be back on the road to recovery. It's a chicken-and-egg argument that to my mind is very simple to resolve using simple logic: you must first produce more before you can spend more. The supply-side solution to today's sluggish economy is to increase the incentives to work, save, and invest, while lowering the barriers to working more and investing (e.g., regulatory burdens, reducing the threat of higher taxes, and generally increasing confidence in the future). That is precisely the opposite of what Obama and the Democrats did early last year, and that's why the economy has, predictably, been very slow to recover.
Pulse of Commerce Index weak but not likely a threat

The September UCLA-Ceridien Pulse of Commerce Index was weak, and it has been weak for a few months now. After healthy growth over the previous year, this index suggests the economy took a pause in the third quarter, and that seems consistent with other indicators that suggest the economy slowed down somewhat. The important thing is whether this presages further weakness. I seriously doubt it, and the folks at UCLA make this sensible observation:
This unfavorable news could be taken by the Cassandras of the double-dip as an alarm of a coming decline in GDP and another spike up in unemployment. The slowing growth of the PCI this year is similar to the behavior of the PCI in 2007 which presaged the recession that began in January of 2008. That recession produced major declines in the volatile cyclical components of GDP — residential investment, consumer durables and business spending on equipment and software. With all three of these components at or near record lows relative to GDP, it seems unlikely that any of them could contribute much to an outright GDP decline, and the other components of GDP do not have histories that suggest they could produce an outright decline either.
Claims still point to very gradual and modest improvement


Weekly unemployment claims came in a bit higher than expected, but as the first chart shows, this counts as a minor blip; claims are going nowhere this year. But as the second chart shows, the number of people receiving unemployment benefits has dropped to a new low for the year. Undoubtedly there are folks who are still out of a job and hurting, but on balance, fewer people receiving claims means a) more people working, and b) an increased incentive for some to find and accept jobs on the margin. Yesterday, while walking around the South Coast Plaza in Costa Mesa, I noticed quite a few "help wanted" signs in shop windows. I'd bet that those jobs don't pay more, after tax, than unemployment benefits, but I could be wrong.
Producer Price Inflation still alive and well

The September report on Producer Prices shows no sign of deflation, but rather an ongoing rise in prices. Over the past year, the Producer Price Index rose 4%, while the core rate rose 1.5%; the core rate has actually risen at 2% annualized rate for most of this year. Both are registering more inflation (2-4%) in recent years than the 1.6% average annual rate of producer price inflation we had in the disinflationary 1990s. Since the Fed first started easing policy in earnest in 2001, there has been a notable pickup in the pace of inflation at the producer level that continues to this day. Not coincidentally, commodity prices have in general been very strong for past 9 years. With commodity prices continuing their rise, we have every reason to expect that producer inflation will remain elevated—and possibly rise—in coming months.
This is not an environment that begs for further quantitative easing. On the contrary, this report should be high on the list of reasons why QE2 is not necessary at this time.
I suspect that if the FOMC were to announce next month that they remain committed to doing whatever it takes to ensure that the economy is expanding and deflationary risks are minimal, but that it thinks the economy is healthy enough not to need further QE at this time, that the market might be briefly disappointed. But I also suspect that after a selloff, reason would take over and risk prices would again rise. Nobody wants to see the Fed try to push inflation higher. Nearly everyone has a stake in the dollar retaining its purchasing power. Higher interest rates and a stronger economy are in everyone's best interest.
Wednesday, October 13, 2010
The $1 trillion lesson
In an article to appear this Sunday in the NY Times Magazine, titled "The Education of President Obama," you'll be able to read that President Obama "realized too late that 'there’s no such thing as shovel-ready projects' and perhaps should have 'let the Republicans insist on the tax cuts' in the stimulus."
U.S. taxpayers only had to fork out $1 trillion or so to educate Mr. Obama and the congressional Democrats on how an economy really works.
HT: Drudge
U.S. taxpayers only had to fork out $1 trillion or so to educate Mr. Obama and the congressional Democrats on how an economy really works.
HT: Drudge
Global equities mark a post-recession high

The market cap of global equities has reached a new post-recession high this past week, thanks in part to the weak dollar. (U.S. equities are still about 3% below their April highs.) What's propelling things upward is anybody's guess, of course, but from my perspective this rally is in large part about things that were feared that didn't happen—like a double-dip recession or a deadly bout of deflation or more policy mistakes. The fundamentals—strong corporate profits, abundant liquidity, strong commodity prices, lower swap and credit spreads—have been looking good for quite some time.
True, the prospect of further central bank accommodation has been much-discussed of late and that could be a factor behind the rally as well. But I prefer to think that markets don't react well to impending policy errors, such as would be the case for QE2. Instead I think that in addition to cheering the bad things that didn't happen, markets also are reacting to the prospect of fewer policy errors going forward, and the elections to be held in 20 days are very likely going to make that possible. The Bush tax cuts have a good chance of surviving. Federal spending is very likely to slow down. ObamaCare could suffer arrested development. Cap and trade is a creature of the past. Washington is very likely to become less anti-business and with a little luck might even become a bit pro-business. The people are going to give a raft of new politicians a strong mandate to fix the economy, and that can only be done by turning loose the energies of the private sector.
There are lots of reasons to be optimistic these days.
Tuesday, October 12, 2010
Blogging may be light
We've got some more visitors from Argentina this week and next, so blogging may be light at times.
Monday, October 11, 2010
QE2 is not only unnecessary but foolish
You can count on Allen Meltzer to offer sound and sensible advice on economics, and his article, "The Fed Compounds Its Mistakes," in today's WSJ is one more reason why. It would be very hard for any economist worth his salt to disagree with anything Meltzer says here, so why in the world is the Fed so hell-bent on proceeding with QE2? Excerpts follow, but read the whole thing:
The Federal Reserve seems determined to make mistakes. First it started rumors that it would resume Treasury bond purchases, with the amount as high as $1 trillion.
Then the press reported rumors about plans to raise the inflation target to 4% or higher, from 2%. This is a major change from the Fed's quick rejection of a higher target when the International Monetary Fund suggested it a few months ago.
Increasing inflation to reduce unemployment initiated the Great Inflation of the 1960s and 1970s. Milton Friedman pointed out in 1968 why any gain in employment would be temporary: It would last only so long as people underestimated the rate of inflation. Friedman's analysis is now a standard teaching of economics. Surely Fed economists understand this.
Adding another trillion dollars to the bank reserves by buying bonds will not relax a constraint that is holding back spending. There is no shortage of liquidity in the economy.
The most important restriction on investment today is not tight monetary policy, but uncertainty about administration policy. Businesses cannot know what their taxes, health-care, energy and regulatory costs will be, so they cannot know what return to expect on any new investment.
The only lasting solution for housing is to let prices fall to a new equilibrium. Painful, yes, but necessary. Temporary palliatives such as lower interest rates delay that adjustment.
Once the economy does begin to heat up, the Fed will urgently need to reduce excess bank reserves lest they stoke inflation. The Fed has talked about policies it can use to do so, such as raising the interest rates it pays to banks to hold their reserves. It has not offered a coherent, credible program to do so since it does not say, and probably does not know, how high the market interest rate would have to be.
Yes, a sustained deflation would be a big problem, but it is unlikely in today's circumstances. Countries with a depreciating exchange rate, an unsustainable budget deficit, and more than $1 trillion of excess monetary reserves are more likely to inflate. That's our problem today, and it's another reason the Fed should give up this nonsense about more stimulus and offer a credible long-term program to prevent the next inflation.
Financial conditions in the U.S. are back to normal

As a follow up to my previous post, the Bloomberg index of financial conditions in the U.S. is now essentially back to the average of the 1992-June 2008 period after a brief Greek-related dip.
Financial conditions in Europe are on the mend


Financial conditions in Europe are gradually becoming less anxious, as these two charts show. The yield on 2-yr Greek government debt has dropped more than 400 bps since August, reflecting a much-reduced chance of a Greek default. Meanwhile, 2-yr yields on German government debt have risen 20 bps, suggesting less concern that Greek woes will drag down Germany.
Swap spreads (see my primer on swap spreads here) in the U.S. have been trading at very low levels for most of this year, which is a very good sign that financial conditions here are essentially back to normal. Counterparty risk, according to swap spreads, is actually rather exceptionally low, which is one anticipated effect of very accommodative monetary policy. European 2-yr swap spreads have dropped 25 bps since their early-June peak in a sign that the risk of a Eurozone financial meltdown (presumably triggered by a Greek, Irish, or Spanish default) has dropped considerably.
It shouldn't be surprising that the improvement in European financial conditions has largely coincided with the rally in U.S. equities, since it was the fear of a Greek default back in April that triggered the market's selloff that lasted through early July.
Friday, October 8, 2010
Fear subsides, prices rise


The Vix index (implied equity volatility) has fallen to its lowest level since the onset of the panic selloff in equities which began last May (which in turn was driven by the belief that the economy was on the cusp of a double-dip recession). Equities have not completely recovered from that episode, however, but they look to be in the process of doing so, and a declining level of fear is one important driver of the rally. As the top chart shows, the implied volatility of T-bonds, as measured by the MOVE index, fell dramatically this week. This is also helping equities, and let me explain why.
It would appear that the market has reached an almost unanimous opinion that the Fed will implement a second round of quantitative easing early next month, this time with the objective being to pull down 10-yr Treasury yields and keep them down for a considerable period. I think this is foolish and unnecessary, as I argued in yesterday's post, but those concerns are irrelevant for now. If one believes that the Fed will do all in its power to suppress 10-yr Treasury yields in an effort to avoid deflation and to spur the economy, then it makes sense that the implied volatility of Treasury options should fall to very low levels. After all, isn't the Fed going to practically guarantee that yields won't rise? And since they can't fall a whole lot more than they already have, this means that we are now (supposedly) at the beginning of a long period of low and stable yields (though I'm not necessarily agreeing with this). So options become very cheap, because uncertainty has all but vanished.
As I argued yesterday, the important thing about the Fed's promise to do anything it takes to avoid deflation (and maybe even to push inflation up) is that this all but eliminates the risk of deflation if done in convincing fashion. Deflation fears have been lingering for quite some time now, but now they are vanishing. When you take deflation risk off the table, suddenly the expected future value of all cash flows goes up: that's why the stock market is going up.
At this point it is probably not even necessary for the Fed to proceed with QE2. Promising in convincing fashion that they would do it if necessary is enough. And the market is now convinced. That automatically brightens the future, even though it leaves alive the concern that they will push inflation too high.
Subscribe to:
Posts (Atom)
