Monday, August 31, 2009

The non-stimulating Stimulus Bill

Forgive me if I'm a bit late with this top-down analysis of last February's faux-Stimulus Bill (aka The American Recovery and Reinvestment Act of 2009), but I have been worrying a lot of late about the gargantuan deficits that are being projected not only by the White House but also by the Congressional Budget Office.

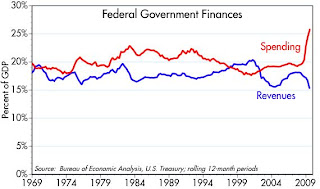
As I detailed in an earlier post, they are talking about 10-year deficits of about $10 trillion dollars, and you've got to believe they're putting all the positive spin on the numbers that they possibly can. Plus, no one is yet talking about what would happen to the numbers if healthcare reform or cap-and-trade passes. Some folks (e.g., The Concord Coalition) are saying the 10-year deficit could be $14 trillion or more. If the deficit is anything even close to $10 trillion over the next decade, this puts us in largely uncharted waters, since it would represent the biggest deficit, in both nominal terms and relative to GDP since World War II. Deficits could range from 6-10% of GDP annually, far out of the range of anything we've seen in the post-war period.

So I began asking myself some tough questions, especially since I've been saying that the economy can grow 3-4% a years in spite of the ugly fiscal policy environment staring us in the face. Just how easily are these deficits going to be financed? Could they effectively absorb all or most of the savings of the private sector, leaving the economy with little or no private-sector investment? Could this be the real "crowding-out" of private borrowers that became a fashionable concern during the Reagan years but in the end proved overblown? How can the economy grow if the government—a chronically inefficient spender and investor—is commandeering nearly all the economy's savings? Annual deficits on the order of 10% of GDP are reminiscent of Japan in recent decades, and haven't they led to a moribund economy and a crippled stock market?

As a supply-sider I have learned that deficits aren't necessarily bad things. Art Laffer years ago taught me that if the government is faced with a shortfall of revenues, of the two alternatives to plugging the gap—higher taxes or increased borrowing—taxpayers should always prefer the latter, since that gives them at least some hope of getting their money back in the future. If taxes rise, however, then the money is lost forever. Milton Friedman taught us that the burden of government is best measured not by the level of taxes or the deficit, but by the level of spending, since the government uses the economy's resources less efficiently than the private sector.

But these trillion-dollar deficits for as far as the eye can see are being driven primarily by a big increase in goverment spending. So that leaves us with the worst of all worlds, doesn't it? How can one be optimistic in the face of this impending disaster?

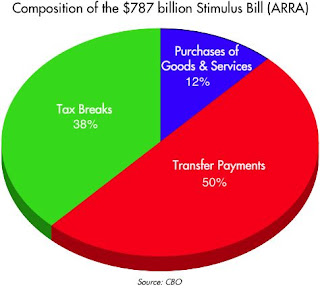
My former colleague at Western Asset, Mike Bazdarich, helped me come to terms with this apparent dilemma, by reminding me that most of the additional spending we're talking about is not really new spending. To illustrate this, the Stimulus Bill can be broken down as shown in the pie chart above. (Data based on the CBO's analysis of the bill.) As should be quickly apparent, only a very small part of the spending involves government purchases of goods and services. This is the part that will commandeer the resources of the private sector inefficiently. As Mike noted in a paper last March, of the $88 billion in federal purchases of goods and services, "only about $12 billion will be spent in the current fiscal year, with only an additional $26 billion slated to be spent in 2010." So we're really talking small potatoes here.

The vast bulk of the "spending" will just amount to reshuffling the distribution of income: $377 billion will be "spent" on transfers to state and local governments and individuals, and $284 bilion will be "spent" on tax breaks to individuals and corporations. Excerpts from Mike's paper:

In analyzing the spending initiatives in the 2009 stimulus plan, it is important to distinguish between direct purchases of goods and services by the government and transfer payments to individuals, firms or state/local governments. Increases in purchases—procurement, hiring and the like—directly boost aggregate spending. Transfer payments merely disburse funds to recipients, where they may or may not be spent. Transfers are little different in effect from tax rebates (but with incentive effects reversed), and as the transfers in the stimulus package are also one-time payments, their prospective impact on spending is similarly small.

The bulk of these transfer payments will go to state/local governments in response to the fiscal emergencies these governments are experiencing. The best this aid can do will be to prevent declines in state/local government spending. Even those prevented declines would occur only if other financing sources were utterly unavailable. If other financing avenues were available to the local governments, then the aid would merely substitute federal debt for the state and local indebted- ness that would otherwise be incurred, with no net impact on GDP at all.

The story is much the same with about $100 billion of transfer payments to persons over the next two years. These are also one-time boosts and will likely elicit only slight changes in spending behavior, mostly affecting destitute households that would have no recourse to other financing sources without the temporary aid provided in the bill.
From my supply-side perspective, 88% of the stimulus bill (transfers and tax breaks) will amount to taking money from one person and giving it to another, while only 12% (spending on goods and services) will involve new government spending that absorbs (inefficiently) resources from the private sector. And I should add that as of not too long ago, transfer payments (e.g., social security, medicare, unemployment insurance, welfare, subsidies) already accounted for over half of total federal spending. These transfer payments don't show up in the GDP accounts because they are not direct government payments for goods and services.

Transfer payments are awful things, of course, since they can and do create perverse incentives. Taking money from Peter who makes a lot and giving it to Paul who either doesn't earn much or doesn't work much is likely to result in Peter working less, while giving Paul an incentive to work less. That's a lose-lose proposition, but it's not going to shut down the economy. It's simply going to result in a slower-growing economy than we might otherwise have enjoyed. Keynesian economists fail to appreciate this, however, since they think that demand drives growth, whereas supply-siders insist that work and investment drive growth.

Almost all of the tax breaks in the stimulus bill are of the rebate variety, and that makes them not too unlike a transfer payment, since one group of taxpayers is favored with a reduced tax bill while another group will have to shoulder the burden of higher taxes in the future. The rebates are one-time, not permanent, and as such they won't do much to change behavior on the margin. Plus, a lot of the tax "rebate" money will go to those who haven't paid any taxes to begin with, so if anything, a windfall tax check could result in them working less. As supply-side theory emphasizes, the only tax cuts that can make a difference to the outlook for the economy are those that result in a positive change in behavior on the margin. Cutting the income or corporate tax would directly increase the after-tax incentive to work and invest, and likely result in more work and a faster-growing economy. Unfortunately, the stimulus bill makes no permanent cuts to income or corporate tax rates.

If I had to restate the above in economic jargon, I would be saying that the "multipliers" used by the White House and the CBO are way too high. Instead of boosting economic growth by a percentage point or two per year on average, the net effect of the bill's spending will be to reduce economic growth by one or two percentage points per year compared to what it otherwise might have been.

So, think about the trillion-dollar deficits mainly in terms of transfer payments. The government is not really going to be consuming a trillion extra dollars of the economy's resources every year that might otherwise be put to better use by the private sector. The wasteful spending is likely to be only a fraction of a trillion per year. There's still some room for private saving and investment, albeit less. Again, this is not going to kill the economy, but it is likely to slow it down.

I've always thought Obama was a socialist at heart, and he has made it very clear that income redistribution is high on his list of priorities. As these numbers show, that is exactly what he has achieved with his stimulus bill. If he manages to get universal healthcare and cap-and-trade passed, then the redistribution will be even larger and more intrusive, while wasting some additional portion of the economy's resources in the process. It's all very unfortunate from a supply-side perspective, but it's not the end of the world.

Look on the bright side: to the extent that Obama's policies lead to positive change on the margin, it will be by increasing the opposition to his policies and subtracting from the Democrats' majority in Congress in next year's elections. And that, in turn, creates more favorable conditions for positive policy changes on the margin in the future.

Implied volatility update


This chart is meant to add to my previous post. It shows the implied volatility in bond and stock options. Note that vol has dropped significantly from the highs of late last year, but it still remains at elevated levels from an historical perspective. I take this to mean that the market is still very nervous about the future, which is another way of saying that the market's outlook for the economy is far from clear. That's why you see lots of talk these days about a W-shaped (double-dip recession) recovery, or an L-shaped (no recovery) recovery. My point is that this market is not priced to optimism, and is still plagued by lots of doubts and fears. If the economy can mount even a modest recovery, as it appears to be doing, then it will pay to be optimistic.

Thoughts on the market's huge rally


The S&P 500 is up 50% from its low on March 9th of this year. I detect a wave of sentiment that says it's time for a correction, that prices may have gone too far, too fast, that the news isn't good enough to support such high prices. But as I said in an earlier post, the market is not exactly priced to good news or even to a recovery. I showed a chart of credit spreads to illustrate my point: credit spreads are still higher than they were at the peak of the 2002 financial crisis, which at the time was the worst period for corporate bonds since the Depression. If the market is still priced to a rather grim future, I question whether or why a significant correction is in order.

The first chart makes the same case but from a different perspective. It shows Bloomberg's Financial Conditions Index, which is "the number of standard deviations that current financial conditions lie above or below the average of the 1992-June 2008 period." Financial conditions are still about one standard deviation below the levels that might correspond to "average." They are today about the same as they were during the 2001 recession and the 2002 corporate bond market collapse. In other words, current financial conditions are still far from below what might be called "healthy."

The second chart shows the history of 10-year Treasury yields. Currently at 3.42%, 10-year Treasuries are still at very low levels from an historical perspective. They've only been lower during periods of deflation and/or depression. Given the Fed's incredibly expansive policy actions, buying Treasury bonds at today's yield levels only makes sense if you think the economy is incapable of mounting a meaningful recovery, while the risk of another (or an extended) recession remains high. (I don't share this view of course.) In short, this rally has not been driven by optimism, but rather by a reduction of pessimism. The market was priced to Armageddon in March, and now it's priced to a recession.

My thesis since November of last year has been basically unchanged: I have thought that the market was overly pessimistic about the economy's future, and valuations were therefore very attractive. I have seen numerous signs, beginning last October, that leading financial market indicators, such as swap spreads, were pointing to improvement, yet the market was priced to continuing disaster. The encouraging signs I began to identify in October and November turned into "green shoots" that are now appearing almost everywhere: declining credit spreads, declining implied volatility, rising commodity prices, rising shipping rates, rising confidence, rising home sales, a bottoming in residential construction, improving manufacturing conditions, rising capital spending, declining unemployment claims, etc.

Like the market, I was blindsided by the dreadful selloff that occurred from mid-February to through early March. I think that selling climax was the market's way of expressing its horror at the degree to which fiscal policies had suddenly shifted to the left: a massive increase in so-called "stimulus spending" threatened a similarly massive increase in future tax burdens, not to mention a gargantuan increase in the public debt.

Since then, my thesis has reasserted itself. From the vantage of politics, the rally has been driven by a lessening of the horror of big government, and that in turn has been largely a function of Obama's policy prescriptions being rejected by the electorate and bogged down in Congress. Things are not turning out as badly as the market once thought. That's not to say that the future looks bright, simply that the future looks less ugly.

So my thesis is still this: the outlook for the economy that is implied by current market pricing (e.g., the level of Treasury yields, implied volatility, credit spreads and P/E ratios) appears to me to be worse than what the economy seems likely to deliver. I think we're in a recovery, but the recovery is going to be sub-par; we are likely to see growth of 3-4% per year for the next several years, but this will not be enough to get the economy back on the track that it was on for the past few decades. It's going to feel like a jobless recovery, a tepid recovery, and a frustrating recovery, but it will still be a recovery. The market expects a lot less than that, however, so it still pays to be optimistic.

Sunday, August 30, 2009

Cash for Clunkers: dumbest government program ever

Chris Edwards of the Cato Institute has a good summary of the reasons the Cash for Clunkers program was the dumbest government program ever: it destroyed almost as much wealth as it cost.

A few billion dollars worth of wealth was destroyed. About 750,000 cars, many of which could have provided consumer value for many years, were thrown in the trash. Suppose each clunker was worth $3,000 at a guess, that would mean that the government destroyed $2.25 billion of value.

Low-income families, who tend to buy used cars, were harmed because the clunkers program will push up used car prices.

Taxpayers were ripped off $3 billion. The government took my money to give to people who will buy new cars that are much nicer than mine!

The federal bureaucracy has added 1,100 people to handle all the clunker administration. Again, taxpayers are the losers.

The environment was not helped. See here and here.

The auto industry received a short-term “sugar high” at the expense of lower future sales when the program is over. The program apparently boosted sales by about 750,000 cars this year, but that probably means that sales over the next few years will be about 750,000 lower. The program probably further damaged the longer-term prospects of auto dealers and automakers by diverting their attention from market fundamentals in the scramble for federal cash.

Friday, August 28, 2009

Dollar update: inflation forces are brewing


The dollar is struggling. It hasn't suffered a knockout punch, but it is definitely weak and appears to be in a declining trend. These charts are two different ways of looking at the value of the dollar. The first is arguably the best way to measure the dollar's value relative to the currencies of all our trading partners (it's trade-weighted and inflation-adjusted). It's telling us that the dollar today is only about 6% above its all-time lows. The second chart measures the dollar's strength against gold, and it is telling us that the dollar is within inches of all-time lows (gold being inches from its all-time dollar highs). Gold has in fact gained against all currencies in the past few years.

As a supply-sider, I believe that strong currencies are always better than weak currencies. As a next-best alternative, I'll take a stable currency. Currency stability means that over time purchasing power will be stable. Stable purchasing power does wonders for one's investment perspective, since it eliminates an important source of risk (i.e., inflation) to investment. Stable and strong currencies thus tend to be magnets for the world's capital because they offer lower hurdle rates to investment. Those countries that attract capital tend to have strong economies and relatively high living standards, thanks to strong investment.

As my previous post indicated, a weaker dollar has enhanced the returns to overseas investing. All of the world's equities markets are rising, but when measured in dollars, the U.S. market is a laggard and foreign markets are the frontrunners (e.g., the Brazilian stock market is up 140% from its November lows when measured in dollars). In my way of seeing things, a weak dollar acts like a headwind to recovery, since it reduces the amount of investment capital we might otherwise receive from the world. Obama's big-government spending and tax increases won't kill our economy, and neither will a weaker dollar, but they do amount to serious headwinds that will significantly increase the amount of time necessary for the U.S. economy to recover its previous potential.

The dollar enjoyed a brief period of strength in the latter half of 2008 (through mid-November), thanks mainly to a global flight to quality. Being the world's reserve currency meant that the dollar was the safest port in what proved to be a Perfect Storm. The demand for dollars exceeded the Fed's willingness to supply dollars late last year, and so the dollar's value rose against most other currencies and rose against gold as well.

Now things are reversing. Global demand for dollars is declining as the prospects for the global economy improve. Meanwhile, the Fed remains extremely accommodative, willing to supply an almost unlimited amount of dollars. Loan demand has not been very strong, however, so the vast majority of the reserves the Fed has pumped into the system remain idle. Instead of borrowing more, it seems that an awful lot of people and firms are still trying to deleverage. But as the recovery progresses and confidence returns, the demand for dollars is likely to fall relative to the Fed's willingness to supply dollars (and loan demand is likely to pick up), and that will erode the dollar's value, at least in terms of gold if not vis a vis other currencies. A weaker dollar will be a key indicator of an excess of dollars, and that is the essential ingredient for rising inflation. Ultimately, a weaker dollar increases inflationary pressures, regardless of how weak or below-trend the economy is.

Measured against gold, all of the world's currencies are in trouble, with the possible exception of the yen, which has only dropped 13% against gold in the past two years. Like many others, I believe that gold is a good way to measure the value of a currency in absolute terms, since gold has done a good job of maintaining its purchasing power over long periods, and countries who have pegged their currencies to gold have invariably experienced very little or no inflation. It would appear that all the world's major central banks are following the Fed's lead, aggressively supplying bank reserves in an effort to avoid a banking crisis. That's fine for the moment, but the price we're likely to pay will be higher inflation all over the world in the years to come, particularly if central banks are slow to withdraw their liquidity injections.

Given the trends so far this year, I think prudent investors need to be prepared for rising inflation in coming years and for sub-par U.S. growth (i.e., 3-4% growth, instead of the 6-8% that we would expect if this were a headwind-free recovery). TIPS are a conservative way to protect money from inflation, since they are adjusted directly for inflation and they pay a coupon (i.e., real interest rate) to boot. Gold and commodities are more aggressive, and much more risky, ways to protect against inflation, since a) they pay no interest rate, and b) they are well above their recent lows and their potential gains or losses are significant. Emerging market economies should continue to do better than industrialized countries, since they benefit from a weaker dollar and rising commodity prices, and many of them (e.g., Brazil, Chile, China, Peru, Singapore, Thailand) have managed to keep their currencies quite strong relative to the dollar in recent years. Equities in general should do well, since markets are still braced for recession and fear continues to distort investment decisions. The things to avoid like the plague are the "risk-free" investments such as T-bills, T-notes, and T-bonds.

$16 trillion and counting


The market cap of global equities is up over $16 trillion since the March lows, according to Bloomberg's index shown in this chart. That's up 63% versus the S&P 500's gain of 52%. But if you consider that major foreign currencies have risen about 14% versus the dollar since the March 9th equity market low, that means that foreign equity markets have actually underperformed the U.S. market. Regardless, this has been a monster rally.

The magnitude of the global equity market collapse, and the strong recovery mounted so far in the past 5 months, are mind-boggling. Unimaginable amounts of money have been lost by investors who capitulated to panic-driven fears. Those who sold keep fearing that another decline is imminent. Their comfort level is not helped by the likes of the Economic Cycle Research Institute's Weekly Leading Index, which points to a strong economic recovery. "With WLI growth continuing to surge through late summer, a double dip back into recession in the fourth quarter is simply out of the question," said ECRI Managing Director Lakshman Achuthan, reinstating the group's recent warning to ignore negative analyst projections."

Thursday, August 27, 2009

Despite the huge rally, pricing is still very bearish


This chart shows the Option Adjusted Spread of the Merrill Lynch Corporate Master Index. That's an index that is currently comprised of some 3800 investment-grade issues with a market value of $2.8 trillion. We've seen a tremendous rally in corporate bonds, as spreads have narrowed from their unprecedented highs of late last year. Those highs occurred last November, when the market feared that the economy was headed for something worse than the Depression of the 1930s. We had never seen such depressed pricing, not by a long shot.

Now, with lots of indicators suggesting that the recession has already ended or is very close to ending, the fears of last November look outrageously wrong viewed from today's perspective. As a result, and not surprisingly, asset markets have repriced. Equities are up over 35% since mid-November, and IG corporate bond prices are up over 20%.

But as this chart shows, credit spreads are still wider today than they were at the peak of the corporate bond debacle in late 2002. That was when financial markets were experiencing unprecedented panic over the prospect of massive corporate defaults (e.g., Enron, WCOM), and accounting and management scandals. We see this same story with the Vix index, which at 25 is still far above levels (10-15) that prevail in "normal" times. Similarly, the implied volatility of bond options is still far above normal or average levels. And of course the spreads on junk bonds are still in the stratosphere.

So we've made a lot of progress to date, with the market's implied economic forecast improving from one of a double-deep depression to one of a nasty recession. Judging from the pricing of corporate bonds today, and judging from the levels of implied volatility, the market is still very fearful of of the future. It may seem difficult to buy stocks and corporate bonds today since they they have rallied so much from their lows, but if you believe the economy is on track for even just a modest recovery, then the market is attractively valued today.

Wednesday, August 26, 2009

New home sales rebound strongly


New home sales are up over 30% from their lows, in yet another sign that the economy is improving. This, in combination with the more than doubling in the price of major homebuilders stocks from last year's low, constitutes strong evidence that we have seen the bottom in the housing market. All this activity also suggests that the combination of sharply lower prices and relatively low mortgage rates has created the conditions necessary to clear the housing market. Market forces have fixed the housing problem, and we can now move forward with more positive changes.

Business investment rebounds


The beginning of the recovery is coming into sharper focus with each data release these days. This chart shows business investment in capital goods, and it has clearly rebounded from its lows earlier this year. New capital spending reflects rising business confidence, and it creates the seed corn for future productivity gains, so this is a very welcome sign. Investment is still awfully low compared to what it has been in the past, of course, but on the margin things are once again improving and that is what counts.

Tuesday, August 25, 2009

Home price update


According to the Case Shiller index, which tracks home prices in 20 major metropolitan markets, home prices have fallen about 35% from their highs of three years ago in inflation-adjusted terms. Contrary to the widely-held view that the housing market is under tremendous downward price pressure due to a rising number of foreclosure sales, prices rose from March through June (though the lagging nature of this index means that home prices actually rose several months earlier). While rising foreclosures may depress prices in coming months, I'm very tempted to say that we have now seen the bottom in housing prices, at least as measured by this index. That would be very good news for home builders, banks, and all those who hold mortgage-backed securities, since it means that the number of homeowners who are "underwater" and facing foreclosure will soon be decreasing.

This surprisingly good news is fully consistent with the recovery we have seen in the market these past several months (i.e., the market has been figuring this out). Home builders' stocks have already risen over 130% from their recent lows, according to Bloomberg's index of leading home builders stocks, and bank stocks are up 150% from their lows.

As a side note, a very close acquaintance recently secured a $900,000, 30-year fixed rate mortgage with a rate of 5.375% for the purchase of a home in the Los Angeles area. I was amazed at how low the rate was (the nationwide average for jumbo loans is 6%), but he got it by putting up a 30% down payment and paying 1 point.

On the margin, this all adds up to some important green shoots in a sector of the economy that has suffered the most in recent years.

Shipping update


A reader questioned why I highlighted the Baltic shipping indices when they supported the bull case, but have neglected to show them now that they have collapsed. Well, here they are. The way I interpret the Baltic indices, which have indeed dropped from their highs of early June, is that a) they are typically quite volatile, b) their recent volatility is within the range of past volatility, c) they are still way above the levels of late last year when global trade ground to a halt, and d) they are still at levels that in the past have been consistent with relatively strong global trade. So I see nothing in the Baltic charts that leads me to think that the recent decline in these indices reflects any major problem with global trade or the global economy.

As for the Harpex Index of shipping, which I have cited before, it is still moribund, trading flat since late June. I don't understand this index enough to know what to make of this, but as I have said before, it looks to me like it has bottomed.

Sunday, August 23, 2009

$10 trillion deficit projection


The Obama administration late last Friday tried to quietly release the news that they are raising the 10-year federal deficit projection to $9 trillion from $7 trillion. A few trillion here and a few trillion there start adding up to a sum that is incomprehensibly large.

So I though it would be interesting to put this into perspective. To begin with, the total deficit in the 10 years ending December 2008 was $2.06 trillion, while the deficit for the 10 years ending July '09 was $3.1 trillion. The deficit in the first seven months of the current calendar year was $0.95 trillion. The deficit in the 12 months ended July '09 was $1.5 trillion. The total deficit accumulated during Bush's 8 years was $2.55 trillion.

Obama's $9 trillion projection is almost certainly based on overly optimistic assumptions. It could easily be $10 trillion, more than three times the deficit of the past 10 years, four times the deficit of Bush's previously-assumed profligate administration, and five times the deficit of the past 10 calendar years. Even when you adjust the deficit for the size of the economy, the projections we are looking at today are off the charts.

For anyone who worried about the pre-Obama deficits, this news is unimaginably bad.

The economy did reasonably well with deficits averaging only a couple of percent of GDP from 1968 through 2008, but now we're talking about deficits that are likely to be in the neighborhood of 6-10% of GDP (with this year likely to come in around 12% of GDP). There is no precedent for what we are facing, since it is orders of magnitude worse than anything we have seen in modern times. Spending is off the charts (see chart above), and tax revenues have never been high enough to finance the level of government spending that Obama has in mind.

My guess is that a $10 trillion deficit projection is enough to convince the voters that something is very wrong with the roadmap the Obama administration is trying to follow. I think the people are going to demand that Obama change his roadmap.

To attempt a massive expansion of government healthcare at a time like this seems downright insane. To attempt to radically change the way our economy uses energy, via cap and trade legislation, at a time like this seems absurd. We can't transform our economy and our healthcare industry when deficits are set to absorb some $4 billion every day.

Somehow I think we're going to figure out how to stop this madness. Obama is rapidly losing credibility and support, and the opposition to his policies is becoming more vocal and coordinated every day. Add to that mixture the explosive news of $10 trillion in deficits and you have the makings of some changes that could be very bullish for markets that are still very worried about the future.

UPDATE: I did some quick, back-of-the-envelope calculations using Obama's numbers, and come up with this: outstanding federal debt, which was about 35% of GDP in 2007, will exceed 70% of GDP before the end of Obama's second term, if he gets one. The only time that ratio was higher was during the height of WW II spending, when it briefly reached 115% of GDP.

UPDATE: The Concord Coalition lays out the rationale for the 10-year deficit to be $14 trillion.

Obama hits a new low


The trends in place continue. Obama is increasingly polarizing the electorate. 41% strongly disapprove of the job he's doing, and only 27% strongly approve, according to the daily tracking poll run by the folks at Rasmussen. It would appear to me that Obama severely misinterpreted his election mandate, thinking that "change" meant bigger government, while the voters severely underestimated how liberal he actually was, thinking that "change" meant better government.

With cap and trade on hold until next year, and healthcare on the skids, we are left with a problem (the stimulus package passed last February) that is not impossible to fix. It's still in its infancy, and it shouldn't be too hard to cancel the bulk of the "stimulus" spending, given that the economy has emerged from recession without the benefit of 90% of the $800 billion that was supposedly essential to avoid an economic disaster. If we could recall the stimulus, then we might even be able to figure out how to avoid the tax increases scheduled for early 2011. I can dream, can't I?

Friday, August 21, 2009

Maui beaches


Maui is the place to go for beaches, and the Napili/Kapalua area is the place to go on Maui, in my opinion. It's the northwest portion of Maui, and it is naturally green (the western, central, and southern portions of Maui can look like a desert unless they are irrigated). The first photo is of the beach at Napili Bay, where we are staying. The second photo is of the beach just north of Kapalua; it's not usually very populated, and is north-facing so it gets huge surf in the winter. You can see the island of Molokai in the background, just across the channel from Maui. The third picture is of the bay just north of Kapalua Bay, and it is a great place to go to jump off rocks and snorkel.

Every morning we go for a 4 mile walk that takes us up to the top of Pineapple Hill, then down through the Ritz Carlton Hotel to Fleming Beach. From there we head back towards Napili, taking the Kapalua Coastal Trail which goes around the northwest corner of Maui and affords gorgeous views of Molokai. It then winds through the grounds of what used to be the Kapalua Bay Hotel, and finally past the charming beach that is Kapalua Bay.

T-bond yield update


To add to my previous post, I would note that rising yields on Treasury bonds are also a sign of rising confidence. Yields are still very low, and as such reflect lingering fears of recession and deflation. As confidence improves and the economy recovers, T-bond yields should continue to ratchet higher.

Weaker dollar, stronger equities


I've posted on this subject before, and it remains a very important issue. Since last March, the dollar has weakened considerably and equities have enjoyed a powerful rally. (Note that the red line, the dollar, has an inverted scale, so a rising red line means a weaker dollar.) It's also the case that growth in M2 has been flat since March, growth in dollar currency has slowed considerably, and commodity prices have surged over this same period.

All of these developments are intertwined, and they tell a convincing story. The single thread that ties these things together is rising confidence. The world is regaining the confidence in the future that it had lost going into March. With rising confidence, the demand for money has declined. Since the Fed has boosted the available supply of dollars, but the demand for them has dropped, it is only logical that the price of the dollar should fall. With rising confidence, people are beginning to spend the dollars that they had been hoarding, and the economy is reviving. With an abundance of dollars in the world (and on the margin an increasingly excess supply of dollars), people are converting unwanted dollars into commodities and into stocks.

The Fed is getting what it has been trying to achieve. Cash that pays a zero yield only makes sense if you are terrified of all the alternatives to cash. Once you become less terrified of the future, your natural inclination is to shed cash, and/or borrow dollars, putting the money to work in gold, other currencies, commodities, houses (yes, this helps explain the surge in existing home sales that was reported today), gold, and equities.

We're talking tidal forces here that are shifting beneath the surface (a good analogy to come up with while sitting on the beach in Maui). They are very powerful, they move slowly, and they are almost impossible to stop.

And it doesn't hurt that Obama's plans for the future are being derailed. The expected future size of the government is much less today than it was back in March, and consequently expected tax burdens are much less. This adds to confidence; what is bad for Obama is good for the market.

Cash for clunkers disaster

This program has been simply disgusting. All it proves is that if the government offers to give away money then people will respond. This will go down in history as one of the most egregious examples of government waste. Ray LaHood should be ashamed to his core.

The Transportation Department said Thursday the government will wind down the program on Monday at 8 p.m. EDT. Car buyers can receive rebates of $3,500 or $4,500 for trading in older vehicles for new, more fuel-efficient models.

"It's been a thrill to be part of the best economic news story in America," Secretary Ray LaHood said in a statement. "Now we are working toward an orderly wind down of this very popular program."

Thursday, August 20, 2009

Hula Girl


We went on a sunset cruise yesterday to celebrate my parents' birthdays (they both share the same day). We've been doing this almost every year for a long time, and have always sailed with Captain Peter Wood and his partner Inca Robbin. This year we got a real treat, since they have added a spectacular new catamaran, the "Hula Girl." It's easily the most modern, beautiful and biggest sailboat on the island, and Peter and Inca always take good care of their guests. No trip to Maui should be without a sunset cruise, and we were lucky to end up with an above-average sunset, as you can see from the second picture. "Hula Girl" sails out of Lahaina harbor and Kaanapali beach.

Wednesday, August 19, 2009

Kapalua


Went for a walk this morning and did the Kapalua Coastal Trail, which goes past Kapalua Bay (supposedly America's favorite beach, and it is really gorgeous plus it has pretty good snorkeling) and then around the point to Fleming's Beach. The first photo here (taken with my iPhone) is a view to the North Northwest, from just north of Kapalua Bay. The island in the background is Molokai.

The second photo is from the gardens surrounding the pool at the Ritz Carlton, which was our first stop after reaching Fleming's Beach. From there we continued up the hill to Pineapple Hill, then down to Napili Bay. Should have taken a shot of the golf course, the bay, the ocean and Lanai in the background. Maybe tomorrow. The views to be found in the Kapalua area (in the northwest part of Maui) are about the best I've seen anywhere on the island.

Meanwhile, it looks to me, from my relaxed vantage point, like the market is just going through another bout of doubt (or maybe just a summer vacation breather). Lots of people worry that the economy can't improve because a) consumers are tapped out, b) jobs are still shrinking, c) the federal budget is absorbing the world's savings, and/or d) Obama's policies are capital-antagonistic. I'm not saying these facts are erroneous, just that they don't preclude a recovery from a very low base that was caused by a sudden decline in money velocity (the counterpart to a panic-induced rise in money demand). Confidence is clearly returning, and money velocity should be on the rise, and that is going to fuel a virtuous cycle that lifts the economy.

Monday, August 17, 2009

Napili Bay


Went for a walk this morning and took this shot of beautiful Napili Bay, which is about 15-20 minutes north of Lahaina, and just south of Kapalua Bay. The island in the background is Lanai.

Morning in Maui


The market's down but I think this will pass. It's hard to get concerned about such things in the peace and tranquility of this island.

Sunday, August 16, 2009

Going to Maui

I'm going to be leaving Calafia beach for the beaches of Maui for the next 10 days, so blogging might be a little light. It's a family tradition, and there will be about 16 of us. There's nothing enjoying like the balmy air, sunshine and warm waters of Maui with parents, siblings, children, grandchildren, nephews and nieces. I might be posting some photos of palm trees and sunsets instead of charts for awhile.

Saturday, August 15, 2009

Inflation or deflation?


July CPI data came out yesterday, and it was a little below expectations. Year over year, the CPI fell 2%, while overall prices held steady in July and core prices (excluding food and energy) rose a mere 0.1%. That's pretty tame, on the surface, and a source of concern to all those who have been worrying about deflation.

Most of the decline in the CPI over the past year has been due to the collapse in energy prices. That's just about run its course, however, since oil prices have doubled from their lows of last December and have been flat since the beginning of June. In the past three weeks, in fact, gasoline prices at the pump have risen 8%, which means we should see energy adding to the CPI in August.

The volatility of oil prices has been of an extreme nature in recent years, so there is plenty of justification for excluding energy and focusing on core prices instead. As the chart shows, the Core CPI is up 1.6% in the past year, and the year over year pace of price gains has been slowing. But that is deceptive, which is why I've included the 6-mo. annualized change in the Core CPI, which is now 2.1%. And even if you look at the whole CPI, it is up at a 2.4% pace year to date, and up at a 3.4% pace in the past three months. So while inflation was definitely low late last year, is not really negative or moderating now at all, and it's probably in the neighborhood of 2% or so.

That would be fine by most people, even the Fed. Except that the Fed's model of inflation says it should be at least zero or negative by now, given the huge "output gap" that the economy is currently experiencing. Conventional wisdom says that when the economy is as weak as it is now, everyone is under pressure to cut prices, and that leads to the dreaded deflation, of the sort that has plagued Japan for decades. And, as the thinking goes, deflation is very bad for economy, as we saw in the Great Depression, because it causes consumers to stuff money under their mattresses instead of spending it.

My good friend and mentor Art Laffer recently wrote a paper that debunks this notion pretty thoroughly. He points out that in a recession it is of course quite normal for businesses to face great pressure to cut costs. Cutting prices helps them become more competitive, and that is the key to survival in an economic downturn. But is cutting prices at the company level equivalent to an economy-wide deflation? No. To argue that what occurs at the company level is also what occurs at the economy level is to fall for the fallacy of composition.

When a businessperson talks about lowering prices because demand is weak, they’re not talking about dollar prices so much as they are talking about lowering the prices of their products to attract business away from other producers. To attract business away from other companies, the businessperson lowers their product prices relative to the prices of other producers’ products, thus making their goods more competitive in a price sensitive marketplace.

For a business, prices are relative prices, while for an economy, prices are dollar prices. Therefore, it only makes sense that on an economy-wide scale, the money (dollar) price of a representative good will reflect the relative scarcity of money versus goods. The scarcer the money, the lower the price of goods measured in money; the more plentiful money, the higher the money price of goods.

So when we look at inflation from a macro perspective, the price level is determined by whether or not money is scarce relative to goods and services, not by whether businesses have an incentive to cut their prices to gain market share. If there is an excess of money relative to the supply of goods and services (which become intensive during periods of recession), prices in general will tend to rise. The situation in which we find ourselves today is one of a plentiful supply of money on the part of the Fed, but a reduced volume of goods and services coming from businesses. To date, the extra money has been mostly absorbed (but not entirely, which is why inflation remains positive) by consumers and businesses that want to increase their money balances, but with time this extra demand for money will fade and money will become abundant relative to goods and services unless the Fed takes steps to reduce the supply of money. This combination of reduced output and increased money supply can lead to higher inflation regardless of how weak the economy is, and regardless of the number of businesses that cut prices in order to boost their competitiveness.

And already we see some signs that the supply of money exceeds the demand for it. The value of the dollar relative to other currencies is depressed and falling; the value of the dollar relative to gold is depressed and falling; the prices of sensitive assets such as commodities are rising (see previous post); the yield curve is unusually steep, suggesting that bond market knows that monetary policy is easy and will have to be tightened in the future; and TIPS breakeven spreads are rising. All of these market-driven prices are pointing to a relative excess of money that could become problematic. As confidence in the future improves, as it has been doing in recent months, then the demand for money will decline. If the Fed does not take offsetting actions to reduce the supply of money, then money will become overly abundant and the general price level should start to rise more rapidly.

Since the Fed keeps insisting that a weak economy will keep inflationary pressures very low, and uses that rationale to maintain its ultra-accommodative monetary stance, we can only infer that they don't understand the monetary nature of inflation. Inflation is not a by-product of the strength of the economy, as the Phillips Curve suggests (see my discussions of the Phillips Curve here), but in a fiat monetary system such as we have today, inflation is rather a by-product of the interaction between the supply of and the demand for money. If the Fed doesn't understand this, then that signficantly raises the risk that inflation will rise in coming years rather than staying very low or turning negative.

Those who worry about deflation when they see businesses cutting prices are therefore missing the forest for the trees.

Commodity update


These charts are very similar, since the second chart is a subset of the first. I included the second chart mainly to show how dramatically the prices of raw industrial commodities have rebounded (+43%) since their lows of last December, reversing fully two-thirds of their plunge last year. But no matter what subindex you look at, prices are up across the board: textiles and foodstuffs are up only 14% and 12%, respectively, but metals are up 85%, fats and oils are up 61%, and livestock 46%. As I have said before, I don't think we can blame Chinese stockpiling for results like these. There is a lot of smoke here, so there must be a fire somewhere (i.e., rising global demand and/or easy money).

I also wanted to illustrate that while we hear lots of talk these days about companies being forced to cut prices, and how this makes the current environment deflationary, that is not a correct observation. Deflation is when the prices of everything decline. What we are seeing is a lot of relative price changes: some up, some down. More on this in a subsequent post focusing on the latest CPI release.

Friday, August 14, 2009

Industrial production recovers worldwide


Industrial production has bottomed or is turning up just about everywhere, and the recovery is particularly robust in Japan. Global green shoots.

Thursday, August 13, 2009

Retail sales stage a modest recovery


Retail sales were a bit disappointing in July. Year to date, sales are up 1.7%, but that is hardly enough to make up for the massive decline in sales that happened late last year. As this chart shows, the level of sales today is about 20% below where it should be if the economy were growing at the pace of the last 8 years. The good news is that the economy is growing and not falling off a cliff, as so many had feared late last year. The bad news is that so far it's growing very slowly.

This chart also provides yet more evidence that the "stimulus" spending generated by tax rebates earlier this year was the equivalent of pouring money down the drain. You can't "jump-start" an economy by taking money from one person and giving it to another. That doesn't create any growth, it just redistributes income. What's needed are policies that incent people to work harder, invest, and take risk. We can only consume more if we first produce more. That's the supply-side mantra that politicians ignore at their peril.

Weekly claims point to a sub-par recovery


The weight of the evidence continues to suggest that the recession has ended (probably in June) and the economy is again growing. There are some serious headwinds, however, which are likely to make this recovery less-than-satisfying. If the political winds were blowing in a more favorable direction (i.e., with true fiscal stimulus focused on increasing the incentives to work, invest, and take risk, rather than bulked-up spending, increased regulatory burdens, and tax rebates) we might expected a fairly dramatic V-shaped recovery, with growth in the range of 6-8% in the coming year. Growth of that magnitude would be a natural result of the degree to which the economy has slowed relative to its trend growth. Instead, it's looking like growth will be on the order of 3-4%, and that will leave the economy below trend and the recovery sub-par, because it will be a long time before firms need to build new capacity.

The progress of the labor market seems to be confirming this. The pace of firings has slowed, but we are still a long way from the point at which which firms begin adding jobs and firings fall to "normal" levels. Recessions can and do end when the pace of firings is still high, as this chart shows, but they don't really feel healthy and satisfying until the recovery sparks demand for new capacity and lots of new jobs. At this rate it could a few years before enough new jobs are added to relieve some of the pressures that still afflict many millions of families, even though the economy will be growing.

Wednesday, August 12, 2009

Camille Paglia: an Obama fan and a devastating critic

I think I'll be adding Camille Paglia's columns in Salon.com to my reading list. Her column today is an excellent critique of the mess that Obama and his administration have made in their first 6 months in the White House. She's an entertaining writer and an astute, objective observer of the political scene, and I'd like to see a lot more Democrats like her. Below are some excerpts, but be sure to read the whole thing. And don't miss glancing through some of the violent hate mail she has received from fellow Democrats in response to the column. They will not tolerate any criticism of The One. Reason, logic, and a respect for free markets and individual liberties have gone missing from the party, and that is one reason we are witnessing a slow-motion Democratic train wreck in progress.

I must confess my dismay bordering on horror at the amateurism of the White House apparatus for domestic policy. When will heads start to roll? I was glad to see the White House counsel booted, as well as Michelle Obama's chief of staff, and hope it's a harbinger of things to come. Except for that wily fox, David Axelrod, who could charm gold threads out of moonbeams, Obama seems to be surrounded by juvenile tinhorns, bumbling mediocrities and crass bully boys.

Case in point: the administration's grotesque mishandling of healthcare reform, one of the most vital issues facing the nation. Ever since Hillary Clinton's megalomaniacal annihilation of our last best chance at reform in 1993, Democrats have been longing for that happy day when this issue would once again be front and center.

But who would have thought that the sober, deliberative Barack Obama would have nothing to propose but vague and slippery promises -- or that he would so easily cede the leadership clout of the executive branch to a chaotic, rapacious, solipsistic Congress? House Speaker Nancy Pelosi, whom I used to admire for her smooth aplomb under pressure, has clearly gone off the deep end with her bizarre rants about legitimate town-hall protests by American citizens. She is doing grievous damage to the party and should immediately step down.

There is plenty of blame to go around. Obama's aggressive endorsement of a healthcare plan that does not even exist yet, except in five competing, fluctuating drafts, makes Washington seem like Cloud Cuckoo Land. The president is promoting the most colossal, brazen bait-and-switch operation since the Bush administration snookered the country into invading Iraq with apocalyptic visions of mushroom clouds over American cities.

I just don't get it. Why the insane rush to pass a bill, any bill, in three weeks? And why such an abject failure by the Obama administration to present the issues to the public in a rational, detailed, informational way?

As with the massive boondoggle of the stimulus package, which Obama foolishly let Congress turn into a pork rut, too much has been attempted all at once; focused, targeted initiatives would, instead, have won wide public support.

Somehow liberals have drifted into a strange servility toward big government, which they revere as a godlike foster father-mother who can dispense all bounty and magically heal all ills.

Federal budget deficit reaches $1.5 trillion, but some hopeful signs


With July figures now in, we see that the federal budget deficit over the past 12 months has surged to $1.5 trillion, representing about 10.6% of GDP. That's another post-WW II record. If there is any good news in the numbers, it is that the decline in revenues over the past two months appears to have slowed. In fact, the 3-month annualized rate of growth in revenues (seasonally adjusted) was -28% in June and -10% in July. It's quite possible that this relative improvement reflects the bottoming in the economy that seems to have occurred over the past 3-4 months. If the economy moves forward on a rising growth path, revenues could stop declining and begin to increase. Unfortunately the pace of spending growth appears robust and likely to continue at a high rate. Spending is up at a 26% annual rate over the past six months, and represents over 25% of GDP, another post-war record.

If the economy continues to recover, revenues could stabilize around 16-17% of GDP, but spending looks set to exceed 26% of GDP for most of the next year. Thus, the federal budget deficit is likely to be 10% of GDP or more (GDP will likely reach $14.5 trillion by the end of this year). That, in turn, means Treasury will need to sell at least $120 billion of bills and bonds each month on average over the next year, in addition to refinancing existing debt as it matures. That works out to new borrowing of around $4 billion per day. That's something to remember the next time Obama, Pelosi and Reid talk about their quest for fiscal responsibility.

If a healthcare bill passes in anything like its current form, it will almost certainly add significantly to this deficit picture, at a time when it is already much bigger than anyone could have imagined just a year ago. I'm having real trouble seeing how Congress is going to do something so utterly irresponsible, and that makes me feel good. I think there's a silver lining to this deficit cloud.

Global confidence is rebounding


Here's a pretty impressive and uplifting chart. It's the Bloomberg Professional Confidence Index, and it is "comprised of responses about the outlook for the global economy, from users globally. A value above 50 indicates a positive sentiment about the global economy from all Bloomberg respondents." This is not exactly a scientific survey, but it leaves no doubt as to whether the outlook has improved. This is dramatic improvement in a relatively short time frame. Confidence (the loss of) was one of the key ingredients in last year's free-fall, and now confidence is coming back big-time. That's very good news.

Residential construction has bottomed (2)


According to the Bloomberg Home Builders' Index, the stocks of major home builders have risen 124% from their lows of last year. If the stock market has any ability to look across the valley of recession, then it's beginning to look not only like residential construction is rebounding, but that the rebound could be V-shaped (if not robust). Toll Brothers, Pulte Homes, and Centex are all up strongly today on better-than-expected earnings announcements. Expect to hear more such news. Green shoots are everywhere and they just keep coming.

U.S. exports are rebounding (5)


Another update in a series. June trade figures are in, and exports rose on a seasonally adjusted basis for the third month in a row. It now looks like we've seen the lows in exports and trade is beginning to revive. This conclusion was suggested a few months ago by rather dramatic pickup in outbound container shipments reported by the Ports of Los Angeles and Long Beach, and it is now being confirmed by the export data. Imports have been pretty flat for the past several months, but again it looks like the worst is over. Imports tend to be a good indicator of the health of the economy, and they plunged by one-third from their high last July through February of this year, though a good portion of the drop was due to a collapse in oil prices.

Tuesday, August 11, 2009

Health care factoids and suggestions

The health care reform debate is getting lively and that can only mean that the bills sitting in Congress are not going to pass. It's way too complicated. It's obviously a big expansion of government. Government can't run anything right, as Obama acknowledged today: "UPS and FedEx are doing just fine. It's the Post Office that's always having problems." It's going to be hugely expensive, like $1 trillion, at a time when we're already running trillion-dollar deficits. It's not going to help the economy at all, only add to existing and massive burdens, so why the rush? It's going to be mandatory. There is going to be rationing. It's going to cover abortions and all illegal immigrants. It's downright scary, and that's what has got people attending Tea Parties and Town Halls.

We need to step back from this debate about the details of reform and realize that our current system is not so broken that we need to transform the American economy. Here are some interesting facts about the uninsured, the ones who are the object of all this effort. I've summarized some key points from an article by Michael Cannon, and he's sourced all his facts if you want to check.

The claim that 46 million are uninsured is grossly misleading and very possibly fraudulent. The CBO has acknowledged that 40 million may be uninsured on any given day, but the number of Americans who are uninsured for an entire year is more like 20-30 million.

15% of those 20-30 million chronically uninsured are effectively insured because they are eligible for existing government programs.

As many as 75% of the chronically uninsured could afford coverage but choose not to purchase it.

13% of the uninsured are illegal immigrants.

43% of uninsured nonelderly adults have incomes greater than 2.5 times the poverty level.

60% of the uninsured are under 35, and 86% are in good-to-excellent health. Government intervention has made health insurance unnecessarily expensive for them, so these folks quite sensibly don’t want to be ripped off. Mandating that they buy coverage is really about hunting them down and taxing them.

To me, this fails the test of a crisis that is grave enough to justify a sweeping reform and government takeover of a major portion of our economy.

The biggest problem with healthcare is the way it's treated by the tax code. Only employers can deduct the cost of health insurance, so tax efficiency says that everyone will attempt to get their insurance from their employer, and employers will be pressured to offer policies that cover the maximum amount of things, in order to take advantage of the tax subsidy. The vast majority of Americans now have what they perceive to be free medical care, and no one has an incentive to reduce costs. Meanwhile, doctors and hospitals have an incentive to inflate costs whereever possible since the consumer of their services could care less. This is the "third party payer" problem that Milton Friedman warned us about decades ago.

So the first thing to change to fix this problem is the tax code. Either allow everyone to deduct the cost of health care insurance, or no one. This would eliminate the pressure for employers to provide healthcare, and put consumers back in charge of spending their own money. It would solve the portability problem, since the healthcare policy you purchase belongs to you no matter where you work. It's a proven fact (just look at the rest of the economy and how well it functions) that when people spend their own money they tend to do it intelligently and carefully. The cost of healthcare would become very transparent, whereas now only insurance companies and the uninsured really know how much things cost.

The next step would be to free up the market for healthcare insurance, by eliminating state-mandated benefits and restrictions. Let consumers buy any policy they want from any insurer in the country. I can envision the healthcare version of Progressive auto insurance coming out of nowhere with innovative solutions. Unleashing the power of 200 million healthcare consumers would surely transform the healthcare industry for the better.

Inflation and productivity


This is a chart I've been following for many years, and it's appropriate to post it today in light of the release of productivity figures for the second quarter and the government's recently revised numbers for GDP. The blue line is the 2-year annualized growth rate of non-farm productivity, and the red line is the year over year change in the implicit GDP price deflator (the broadest measure of inflation available).

The main point of the chart is to show how inflation and productivity tend to move in opposite directions. When inflation picks up, productivity declines. When inflation declines, productivity improves. When inflation was low and relatively stable for two decades, from the early 1980s to the early 2000s, productivity (and by extension economic growth, since productivity is a measure of how much each worker produces) was on average quite strong.

In short, high and rising inflation are bad for the economy, while low and falling inflation are good. The Fed understands this, since they religiously repeat the refrain that they seek to deliver low and stable and inflation because that is the best way to ensure optimal economic growth. The only problem is that they haven't yet figured out how to reliably deliver low and stable inflation. Note the substantial pickup in inflation from 2002 to 2006, and how that coincided with a significant decline in productivity. Rising inflation distorted the housing market, causing resources to be directed to building homes for which there later proved to be no demand.

Inflation has subsided in the past few years, and now productivity has picked up. The economy has redirected its resources away from housing, and asset prices have adjusted to new realities. A new growth cycle is underway, with corporate profits turning up thanks to improved productivity. The main macroeconomic risk the economy faces going forward is that of rising inflation, should the Fed fail to withdraw its massive liquidity injections in a timely fashion. In addition, there is the looming political risk of the impact of a sharply rising tax burden, which would reduce investment on the margin and result in weaker productivity and thus slower growth. While these are serious risks, they are unlikely to derail the economy for at least another year or two.

Monday, August 10, 2009

Healthcare "reform" means less freedom

There's a great article in the July 24th edition of Fortune ("5 freedoms you'd lose in health care reform") that discusses in fairly straightforward fashion why healthcare reform, as currently proposed by both the House and Senate, will add up to a significant encroachment on individual liberty. Here's my summary of the article, but you should read the whole thing.

No freedom of choice. Since Congress wants to force everyone to have health insurance, the government must define the minimum type of policy you have to buy. And the minimum level of coverage is almost certainly going to be much more than a bare-bones, high deductible type of policy you can get today. You will inevitably be forced to buy the type of policy mandated by the government. Also, you will not be able to choose your doctor once you inevitably end up getting your insurance from the government-approved "exchange." "You're assigned a primary care doctor, and the doctor controls your access to specialists. The primary care physicians will decide which services, like MRIs and other diagnostic scans, are best for you, and will decide when you really need to see a cardiologist or orthopedist." Even worse, you will have no freedom to choose not to have insurance, since if you decide to be uninsured you will have to pay a substantial fine.

No freedom to benefit from healthy choices. Since Congress ultimately wants everyone to pay the same rate, the young and those who live a healthy lifestyle will subsidize the old, the infirm, the obese, and the sedentary among us.

No freedom to keep your existing plan. There are all sorts of ways that you could lose your existing plan. If you change jobs, or if your employer decides to not offer insurance or to change the type of coverage they offer, among other things, you would be forced into a government plan.

One very important thing to remember, above all, is this: the more things that the government controls or provides us, the more government encroaches upon our liberty; more power for government always means less freedom for the individual.

TIPS update


One of the reasons advanced for the creation of TIPS in 1997 was that having inflation-linked bonds and nominal bonds issued by the U.S. government would reveal the market's inflation expectations in real time, and this in turn would provide valuable guidance to policymakers and to the market. By subtracting the real yield on TIPS from the nominal yield on Treasuries of similar maturity, you get the market's expectation for the average annual inflation rate over the life of the bonds. (It's also called the breakeven inflation rate, since if actual inflation proves to be identical to expected inflation, then the return on holding TIPS would be equal to the return on holding Treasuries of similar maturity.)

Of course, it's one thing to look at the breakeven spread on TIPS for guidance as to the market's inflation expectations, and it's quite another thing to believe that those expectations are likely to be proven right. One has to start out by assuming the TIPS market, as with any market, is better than any individual or collection of individuals when it comes to predicting the future. But markets can be and often are wrong.

The top chart here shows the breakeven inflation rate over the next 10 years, currently 1.96%. That's up sharply from the near-zero rate which prevailed at the end of last year, but it's a bit below the 2.04% average since TIPS were first issued in 1997, and it's well below the 2.5% rate which prevailed from 2004 through early last year. Not coincidentally, perhaps, the CPI has averaged about 2.5% over the past 10 years. From this perspective, it looks like inflation expectations are returning to "normal" but are still a bit on the low side.

The second chart shows the 5-year forward, 5-year expected rate of inflation (e.g., what the market expects the 5-year inflation rate to average, five years from now). This measure now stands at 2.5%, so we might say that from this perspective things are already back to "normal."

What's been driving inflation expectations higher? The easiest and simplest answer is that the economy has far exceeded expectations, and with a healthier economy, the market's fears of deflation have vanished. (I've discussed this at least several times in prior posts, most recently here.) But some portion of the rise in inflation expectations could be due to fears that the Fed's quantitative easing program will end up being inflationary. In any event, as the top chart shows, rising inflation expectations this year have been almost entirely the result of rising nominal yields, since real yields have been roughly unchanged. That's a clear sign that demand for TIPS has been relatively strong, and that would be consistent with rising inflation concerns. Still, breakeven spreads don't yet show any signs of rising to levels we haven't seen in the past, so it's tough to say on the basis of this evidence that the future has become problematic or that the Fed is likely to make a big inflationary mistake.

In my decades of experience, and after studying the history of countries that have experienced deflation, inflation, and hyperinflation, I have come to believe that bond markets are not always good or reliable predictors of inflation. The history of the U.S. is a case in point, since bond yields were chronically low relative to inflation in the 1970s, and chronically high relative to inflation from 1980 through the early 2000s. Plus, since its inception, the TIPS market has tended to underestimate actual inflation, as I noted in my last TIPS update.

The inflation expectations embedded in TIPS today are not unusually high, even though they have risen significantly year to date. But that doesn't rule out the possibility that inflation may end up being significantly higher in the future than it has been in the past decade. If the past is any guide, the TIPS market is likely underestimating future inflation. And if the Fed ends up succumbing to political pressures to ensure that the economy is growing, they may fail to unwind their liquidity injections in a timely fashion, thus providing the fuel for that higher inflation.

I don't want to downplay the threat of a Fed inflation mistake, especially given the sheer magnitude of the expansion of bank reserves and the fallibility of all mere mortals who are entrusted with great power. But I do want to note that while many are talking about the inflationary risk of current Fed policy, the TIPS market is so far displaying very little, if any, concern about this risk. Other markets, such as the gold market and the commodities market, do seem to be displaying a palpable degree of concern over rising inflation, since prices are relatively high and rising from an historical perspective. The gold market, for example, has been worrying about rising inflation ever since the Fed started easing policy in early 2001.

Given that the breakeven spreads on TIPS are still quite tame, and given that real yields on TIPS are not unusually low, I think TIPS are still the most affordable and least risky way to hedge against the risk of higher-than-expected inflation. And considering that they have no default risk and relatively low price volatility, TIPS can be superior to cash for many investors—particularly with cash yielding zero these days. Gold and commodities could rise significantly from here if the Fed really makes a hash out of things, but then again they could also drop significantly if big inflation turns out to be a no-show. Meanwhile, they pay no interest, whereas TIPS do.

Full disclosure: I am long TIP and various TIPS issues at the time of this writing.