


Last week we received new data on inflation, the net worth of the U.S. private sector, and government finances. Inflation looks uncomfortably high, ingrained and troublesome, but net worth looks fabulous. Federal debt has reached alarming levels—almost 100% of GDP—but the burden of the debt is historically low, thanks to high inflation and very low interest rates. Not everything is as it seems on the surface.
Chart #1

February consumer price inflation came in as expected (+0.8% for the month, 7.9% for the past 12 months). (See Chart #1) Price increases were spread across the board, further supporting the idea that this is an inflation that affects nearly all sectors of the economy, and thus an inflation that has its origins in a monetary policy mistake by the Federal Reserve: without the significant increase in the broad money supply over the past two years a generalized inflation like this would not be possible.
Please see Chart #1 in this post for a look at just how much the M2 money supply has increased. I continue to be amazed that the great majority of analysts and economists are completely ignoring the monetary origins of our current inflation. I would cynically add that early last year the Fed decided to publish M2 only once a month, around the 21st of each month, and they made this change (previously it published money supply data weekly) right around the time that inflation began to soar.
Chart #2

Chart #2 shows that almost two thirds of small businesses are paying higher prices these days. This is the highest level on record, and it again shows that we are dealing with an inflation that is affecting nearly everyone.
Chart #3

Inflation is very obviously exceeding nearly everyone's expectations, yet gold prices have barely budged. Gold is widely regarded as an excellent hedge against inflation, so why aren't gold prices much higher? Over the past year I've been answering that question by pointing out that gold prices likely rose long ago in anticipation of today's inflation; the market is always very forward-looking. For further insight into this, consider Chart #3, which shows the inflation-adjusted price of gold going back to 1913. Gold has been within inches of its all time high (in real terms) for the past year or so. In other words, gold is very expensive, because investors have been buying gold in order to hedge against rising inflation, and they have been willing to pay very high prices to do so.
Chart #4

Chart #4 shows that the bond market has been adjusting—slowly—to the realization that inflation is going to be higher than expected and probably for longer than expected. The bond market currently expects that the CPI is going to increase a little over 3.5% per year on average for the next 5 years. Note that the rise in expected inflation (green line) has been driven mostly by a rise in nominal Treasury yields (red line). Real yields have change very little, and they remain exceptionally low, which further suggests that the bond market does not expect the economy to be very strong—rather weak, actually. Call it "stagflation."
Chart #5

Chart #5 shows how those who have owned bonds have suffered serious losses (in real terms) because of the significant and unexpected rise in inflation. Similar losses (and even worse) were suffered in the 1970s. This is not a good time to hold bonds, obviously, and it could easily get worse. The long bull market for bonds that began in the early 1980s is over.
Chart #6

Moving on to net worth (Chart #6): The Federal Reserve on Thursday released its estimate of household net worth as of the end of last year: $150 trillion. Net worth is soaring, thanks to strong gains in stocks and real estate, and only modest increases in debt. Households have been behaving quite prudently since the 2008-09 Great Recession.
Chart #7

Chart #7 adjusts net worth for inflation. It also suggests that real net worth tends to increase by about 3.6% per year. That in turn is driven by population growth and productivity increases—and in recent years by plunging interest rates, which greatly increase the present value of future income streams. This latter factor is likely to reverse as interest rates rise (i.e., real net worth is likely to grow at a much slower rate in coming years).
Chart #8

As a counterpart to our profligate federal government, the U.S. private sector has been steadily deleveraging since the Great Recession. The average amount of leverage for the typical person or corporation has fallen back to levels not seen since the late 1960s. This is one under-appreciated bright spot, since it suggests that the financial situation of the private sector of the U.S. economy is quite healthy.
Chart #9

Chart #9 shows the level of real net worth divided by the size of the U.S. population. It appears to be running at the upper end of its historical range, and that could be a by-product of super-low interest rates; I'd expect to see this reverting to mean in coming years. For now, the average person living in this country benefits from a record amount of wealth creation.
Chart #10

Changing gears, Chart #10 shows the evolution of federal spending and revenues. Note the explosive growth of revenues in the past two years. That's due to a combination of the economy re-opening and rising inflation which boosts incomes and, in the process, pushes people into higher tax brackets. Meanwhile, federal outlays have slowed somewhat, but remain almost absurdly high. There's a strong argument to be made that all the many trillions of extra spending that occurred during the Covid period were effectively monetized by the banking system, and thus fed directly into higher inflation: the magnitude of the increase in M2 in recent years is quite comparable to Covid-related "emergency" spending.
Chart #11
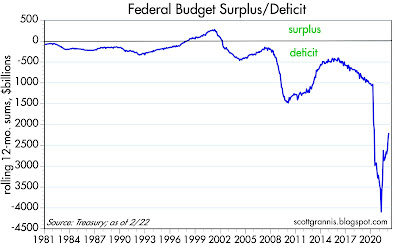
Chart #12 shows the difference between spending and revenues, otherwise known as the budget deficit. Happily, the deficit has declined by almost 50% from its peak, but it remains huge—almost 10% of GDP.
Chart #12

Surprisingly, despite the fact that outstanding federal debt is just shy of its highest level in history relative to the size of the economy (currently about 96% of GDP), the burden of that debt is as low as it has been in many decades (see Chart #12). This is due to the fact that interest rates are extremely low—lower than they have ever been in recorded history, and much lower than inflation. The federal government is a direct beneficiary of today's very low real interest rates. In fact, anyone who is highly indebted these days should thank their lucky stars that inflation is high and interest rates are low. High inflation erodes the real value of debt and low interest rates make it easy to service. Moreover, high inflation boosts government revenues because incomes rise and taxpayers are pushed into higher tax brackets.
For years I've been recommending that people "borrow and buy," and that's been a winning strategy. Unfortunately, those who have been prudent—the lenders and the savers—have forfeited a lot of purchasing power. Inflation is ultimately destructive because it transfers wealth from lenders to borrowers and wreaks havoc on the economy in the process.

8 comments:
borrow and buy? that's lunacy masquerading as despondent fever dreaming.
A sobering and IMHO probably accurate view of the US economy, as presented by Scott Grannis.
Of course, Ukraine and C19 were monkey wrenches in the gears.
This is PCE core:
Change From Month One Year Ago
January 2022 5.2 %
December 2021 4.9 %
November 2021 4.7 %
October 2021 4.2 %
So, looks bad but I think the worst is over, and US will hang around 4% to 5% inflation for a while, by this metric.
About the only good news I can think of is the obsession with C19 seems to be passing.
Volcker ended inflation when he imposed reserve requirements against Now and Super Now accounts in April 1981 (after the “time bomb”) in January 1981 (the widespread introduction of ATS, Now, and SuperNow accounts which vastly accelerated the velocity of money).
Powell should reimpose reserve requirements on all transaction balances and remove the inclusion of vault cash as a part of legal reserve balances
Question for you Scott: A number of economist have stated that the world wide savings glut, booming global trade and an aging demographic in the developed world are strong secular factors that will keep inflation low in the long term. While a surge in M2 and other factors has spiked inflation in the near term, do you believe we will eventually revert back to a low inflationary environment beyond - say, several years?
JC: economists that think inflation is a function of global trade or demographics are mistaken. Inflation is always and everywhere a monetary phenomenon. I hope central banks wake up and return us to a low inflation world, but to date I see no signs of that.
Great post Scott!
I think central banks are no longer independent like they once were. Its all politics now. They don't want to raise interest rates because the governments don't want it. The same thing is happening up here in Canada. The Bank of Canada is still calling inflation transitory. Its a joke. We have a massive housing bubble and that is one of the reason they don't want to raise rates. The other reason is because are federal government is spending money like a drunken sailor and they don't want higher rates either. I'll take the over on inflation!
Inflation is always and everywhere a monetary phenomenon.--Milton, via SG
Well....
When I look at SoCal house prices, I see regulations and property zoning at work. Sure, exacerbated by low-cost borrowing...but housing is cheap in Toledo.
When the supply of goods is restricted, and continuously tightened across many categories (housing, oil, medical care) perhaps you will get inflation as measured. Certainly, you will get lower living standards.
Powell just stated FED assessment of potential GDP is about 1.75%. Used to be around 3-3.5%.
Post a Comment