


Sure, a flat or inverted yield curve almost always precedes a recession, and I've been making that point for many years. But you need other things going on to make a recession happen. Inverted curves are a necessary but not sufficient condition for a recession. The following charts illustrate 4 other important indicators of an impending recession.

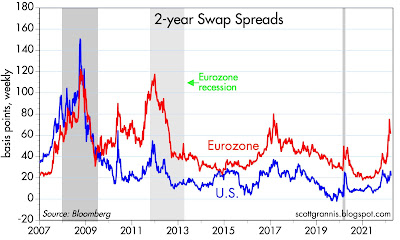
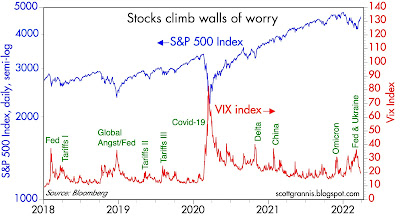
Chart #1
♻︎

Chart #1 compares the slope of the Treasury yield (measured by the difference between 1-yr yields and 10-yr yields) to the level of real short-term interest rates. Note that two things reliably precede recessions: a flat or inverted yield curve (red line) and very high real interest rates (blue line).
The yield curve inverts when the market senses that the Fed is so tight that the economy is at risk of collapsing, and that collapse would then prompt the Fed to ease. As many have noted, there are parts of the yield curve that today are inverted: 5-yr Treasury yields today closed at 2.50%, while 10-yr yields closed at 2.40%. But it would be premature to think that this materially increases the chances of a near-term recession.
Regardless, I think it makes more sense to compare a short maturity yield (i.e., something with less than 2 years' maturity) to 10-yr yields, because short maturity yields are dominated by what the Fed is doing now and is widely expected to do over the near future. Once you get out to 2 or 5 years, lots of factors come into play, such as inflation and economic growth, and these can contribute different pressures to different areas of the curve.
As the chart shows, the spread between 1-yr and 10-yr yields is just over 70 bps, and that represents a fairly typical condition. It directly reflects the expectation that the Fed is going to be raising rates for at least the next year or so, and that beyond that the economy and inflation are likely to moderate. Nothing scary or crazy about that.
It's also very important to note that an inverted curve today is not necessarily a sign of an impending recession. As the chart also shows, inverted yield curves often precede recessions by several years.
In my view, the level of real yields is arguably more important than the slope of the yield curve. Very high real yields, e.g., 4-5%, exert a powerful influence on the economy because they are driven by Fed tightening (which restricts liquidity) on the one hand, while they impose very high borrowing costs on the economy on the other hand. Very high real rates encourage people to avoid borrowing and and the same time they encourage people to increase their saving: both equate to an increase in the demand for money, and when taken to an extreme, high real rates can shut down consumption and growth.
Today, real yields are the lowest they have ever been. This encourages borrowing and it discourages saving. Cash is trash, since it is losing purchasing power rapidly. Better to borrow and spend these days than to save or pay down debt. Nothing about that is going to hurt the economy. If anything, today's very low real rates are likely to pump up spending and give us a bigger inflation headache.
If the Fed doesn't get nominal yields to rise to at least the level of inflation (which is currently running 7-10%), then monetary policy will remain very stimulative, and that's not likely to cause the economy to collapse.
Chart #2

Chart #2 shows the level of Credit Default Swap spreads, which is a very liquid and reliable measure of the market's confidence in the future health of corporate profits and the economy. Low spreads mean the market thinks the economy is going to be healthy and corporate profits are going to be solid. Currently, spreads are somewhat elevated from their recent lows, but they are nowhere near levels that have preceded recessions in the past. This is the bond market's way of saying it is confident that corporate profits will remain reasonably healthy for the foreseeable future.
Chart #3

Chart #3 shows the level of 2-year swap spreads in the U.S. and in the Eurozone. Swap spreads are similar to CDS spreads, but they are more generic and reflect the risk of borrowing and lending between large institutional investors. A normal level of this spread would be roughly 15-35 bps. Levels of 70 bps and above are symptomatic of rising risk aversion and a general shortage of liquidity. Liquidity is being squeezed in Europe (not surprisingly) but it is still plentiful in the U.S. And that's very important, because liquidity shortages can intensify other financial market stresses. With abundant liquidity, markets can trade efficiently; those who are averse to risk can shift the burden of risk to those who are willing and able to bear risk. Those who wish to run for the exits will have no trouble getting out.
Chart #4

Chart #4 compares the level of the Vix index (the "fear" index) with the level of the S&P 500 index. Rising fears almost always accompany market declines, and vice versa. Currently the level of fear is declining and the stock market is recovering, presumably because tensions in the Russia/Ukraine war are subsiding.
Technically, the Vix index measures the effective cost of buying options (buying options is an effective way to reduce your exposure to risk). Very high Vix levels make buying options very expensive, which is another way of saying that it becomes very expensive to hedge one's exposure to risk. So high levels of the Vix are a clear sign of just how nervous the market is. Today the market is breathing easier than it was just a few weeks ago, and investors are more willing to take on exposure to risk.
I don't see anything in these charts that makes me worry about a near-term recession.

14 comments:
Thank-you Scott;
The next question is of course stagflation.
With a Dovish FED, isn't that a serious possibility?
The combination of a dovish Fed, abundant M2 liquidity, trillions of dollars of bank reserves, and very low real yields all but guarantees we'll see unusually high inflation in the coming months and years. As to the strength of the economy, I note that very low real yields are the bond market's way of saying that economic growth is going to be very weak in coming years. So in effect the bond market is implicitly forecasting "stagflation." I'm pretty sure we'll see the "flation" part, but I'm not sure at all that we'll see the "stag" part.
One of the very few good things to come from the Covid shutdowns is that virtually all businesses were forced to find ways to survive. That meant allowing employees to work from home, and it involved finding ways for a reduced workforce to become more productive. Productivity is the mother's milk of growth, and I don't think we've seen the end of all the productivity-enhancing measures that businesses discovered in the past two years. Moreover, there is still a small army 4 to 5 million strong of workers who have not yet returned to the active workforce. Yet the economy has already recovered it's former level of real growth and then some. Putting millions more to work in the coming years would almost certainly drive continued economic growth.
So I am relatively optimistic about the economy's growth potential, and I like the fact that the bond market (via relatively low credit spreads) seems to agree with me. But I am very pessimistic about the outlook for inflation, and I don't think the bond market agrees with me since inflation expectations are still relatively tame (i.e., 3.5% or so).
Ultimately, however, high inflation is harmful to growth, especially if the Fed is forced to take extreme measures to bring it under control—which is what has almost always happened after prior bursts of unexpectedly high inflation. So stagflation is likely to inhabit our future, but not for another year or so. In the meantime, I look for high inflation (7-10%) and decent real economic growth (2-3%) to continue.
Great take as always Scott, thank you
Given the outlook of inflation but with growth, how would you best design a portfolio for the coming years? A mix of real-estate, gold, stocks, and maybe some crypto, while avoiding bonds?
Apologies: i continue to be extremely bullish about long term prospects but can't shake off the idea of a lifeboat for now.
The idea i guess is to go where the puck will be and one should perhaps discount the possibility that a peak has been reached.
Looking at consumer sentiment gap and inverting yield curves, one should perhaps discount that the disconnect between inflation and interest rates may close down as a result of disappointing growth going forward.
For reference:
https://www.dallasfed.org/research/economics/2019/1105
https://www.bloomberg.com/opinion/articles/2022-03-30/russia-ukraine-talks-need-markets-to-lose-peace-in-our-time-reflex
Apologies again but reading these blog pages reminded me of a quartet:
https://www.youtube.com/watch?v=uffHb6JgoiQ
Maybe what was developing in 2019 is unfinished business and was masked by unprecedented money-fiscal subterfuge. i guess we're about to find out.
Opinion: The Fed was late on the inflation front and will be late again on the growth disappointment front but, easing, they will do, in due course, and possibly to no avail.
Is it possible that the issue with the Real Fed Funds rate is not its absolute level, but its amount of increase? Since 2008, we have had an almost continuous negative Real Fed Funds rate, and our economic ecosystem has adapted accordingly, in complex, interconnected ways that are impossible for us to completely understand. Could it be that this time around, it won't take a 3%+ RFFR to upend the economy, but simply a return to a neutral level? Getting back to zero would be a 5% increase, as large as any increase that we have had since 1980.
Can the yield curve miss a stagflationary recession?
How do you define "near term", Scott? I would estimate a recession in the next 12-18 months based on the yield curves. Also, in 1975 (the last time we had this sort of inflation), the real rates were deep in the negative territory, but the inversion still resulted in a recession. Is this time different?
Really enjoy your material, Scott. Thanks again for putting the effort into sharing.
RJ: Real rates were very high just prior to the 1975 recession, then plunged as inflation took off and the economy collapsed. My chart might not accurately depict those circumstances.
Hi Scott if you look at real wages they are in rapid downtrend.and the inflationary shock is only at its initial stage. then if is true that real rates are deeply negatives real wages also are. I don’t see a growt outlook for an economy based on private consumption where real wages are shrinking. and more. Consumers thinks usually in nominal terms .now you have mortgage interest on a 30 year near 5% . It could be a paradox but the best place to place money could be long term bonds or stocks with pricing power end strong export exposure.
There's too much economic dislocation and confusion now post global mal-policy. The safest way, as has usually been the case, is buying the whole US stock market via low cost SP500 or Total Market index fund or ETF. If you have an edge via personal network connection or definitive insight insight that is fine, but edges are not shared they are guarded. Very few people have them or ever will.
Johnny Utah, re negative real wages: In the supply-side framework, economic growth is not driven by consumption. Rather, it's driven by work (the number of people working) and productivity (the change in the output of each worker). Real growth is possible even if all prices are declining, just as negative real growth can occur even if all prices are rising.
https://www.zerohedge.com/markets/shocking-us-consumer-credit-numbers-savings-long-gone-credit-card-debt-soars
Payrolls data suggests that a record Number of people are now at work but Money they are earning doesent support actual standard of living
Inflation has eroded savings and more debit for support consumptions Is ,house affordabiliity Is worsening . Supply-side framework Is fascinating but i don't see any Ronald Reagan in Usa now.
Inflation is guaranteed. Peak oil. Demographic shifts (see The Great Demographic Reversal by Charles Goodhart and Manoj Proadhan
Salmo, re inflation and demographic shifts: Since demographics change only gradually over multi-year periods, how do you explain the very sudden emergence of inflation early last year?
Post a Comment