Monday, May 8, 2023

Swap and credit spreads still say no recession


At this point it's almost perceived wisdom that the economy will soon slip into a recession, with the only doubt being the degree of severity. I remain skeptical, however. It's true that the Fed is very tight and the yield curve is very inverted—both being classical precursors to recessions in the past. But there are other precursors to recession that are not present today, namely wide and rising swap and credit spreads. And while some observers note with concern the unprecedented decline in the M2 money supply over the past year, I view it as a welcome return to something more normal—after all, M2 is still significantly higher than its historical trend vs nominal GDP. To be sure, the growth in private sector payrolls has slowed in recent months, and appears likely to slow further (from 4-5% a year ago to now 2%), but it's still far from being in recession territory.

I also think there's a good chance that the market is overlooking the fact that the current round of Fed tightening is unique in one important respect: the Fed is pushing short-term interest rates higher directly, without draining bank reserves (as they always did in the past). That means that this time around there has been no shortage of liquidity in the banking system, and that's a big deal. Liquidity (e.g., ample amounts of cash and an abundance of risk-free, interest-bearing securities like bank reserves and T-bills) is essential to functioning and efficient markets. Efficient markets, in turn, function as "shock absorbers" for all sorts of ups and downs in the economy. Are you comfortable holding certain high-yielding corporate bonds but afraid that all bonds will lose value in a rising-rate environment? Then use the swap market to neutralize the risk of higher rates while still retaining exposure to the companies you like. Swap spreads are pretty low these days, and that means you can easily swap out of the risk you are uncomfortable with. Efficient markets allow people to tailor their risk profile to suit their particular appetite for risk, instead of just bailing out of everything. Liquid and efficient markets are like being in an open-air theater when someone yells "fire!" There's no panic, because there are no crowded doors you have to exit through.

All eyes will be on Wednesday's April CPI release, with most expecting to see no change in the year over year measure (5.0%). I think there's a decent chance of seeing 4.8%, which would also mean that over the past six months, inflation will have been rising at a mere 3.1% annualized rate. If I'm right, it will likely be because the increase in homeowners equivalent rent will be decelerating, as it began to last month. (See this post for details.) An easing of inflation would go a long way to restoring faith in the future, since the market would view the Fed's job as mostly done—with declining short-term interest rates breathing life into most areas of the economy. 

Here are a few charts to illustrate these points:

Chart #1


Chart #2

Chart #1 shows the level of 2-yr swap spreads. In normal times, this spread trades between 15 and 35 bps. Today it was smack in the middle of that range. Thus there is no sign of any unusual stress in the bond market, and to judge by this fact, liquidity is still abundant. This spread has spiked to 60 bps or more in advance of past recession, as Chart #2 shows.

Chart #3

Chart #3 shows the level of Credit Default Swap spreads. This is a highly liquid barometer of the health of corporate profits (tight spreads indicate strong profits, rising spreads indicate deterirorating profits). As with swap spreads, there is no sign of distress here. Indeed, the market seems to have largely brushed off the risk associated with the collapse of Silicon Valley Bank last March. 

Chart #4

Chart #4 is Bloomberg's index of financial conditions. It aggregates all sorts of sensitive, market-driven indicators (see the components listed at the bottom of the chart). Today, financial conditions appear pretty much normal, whereas they reliably decline in advance of recessions.

Finally, my contrarian instincts perk up whenever I hear almost everyone warning about an impending recession. 

Thursday, April 27, 2023

The economy continues to grow and inflation continues to decline


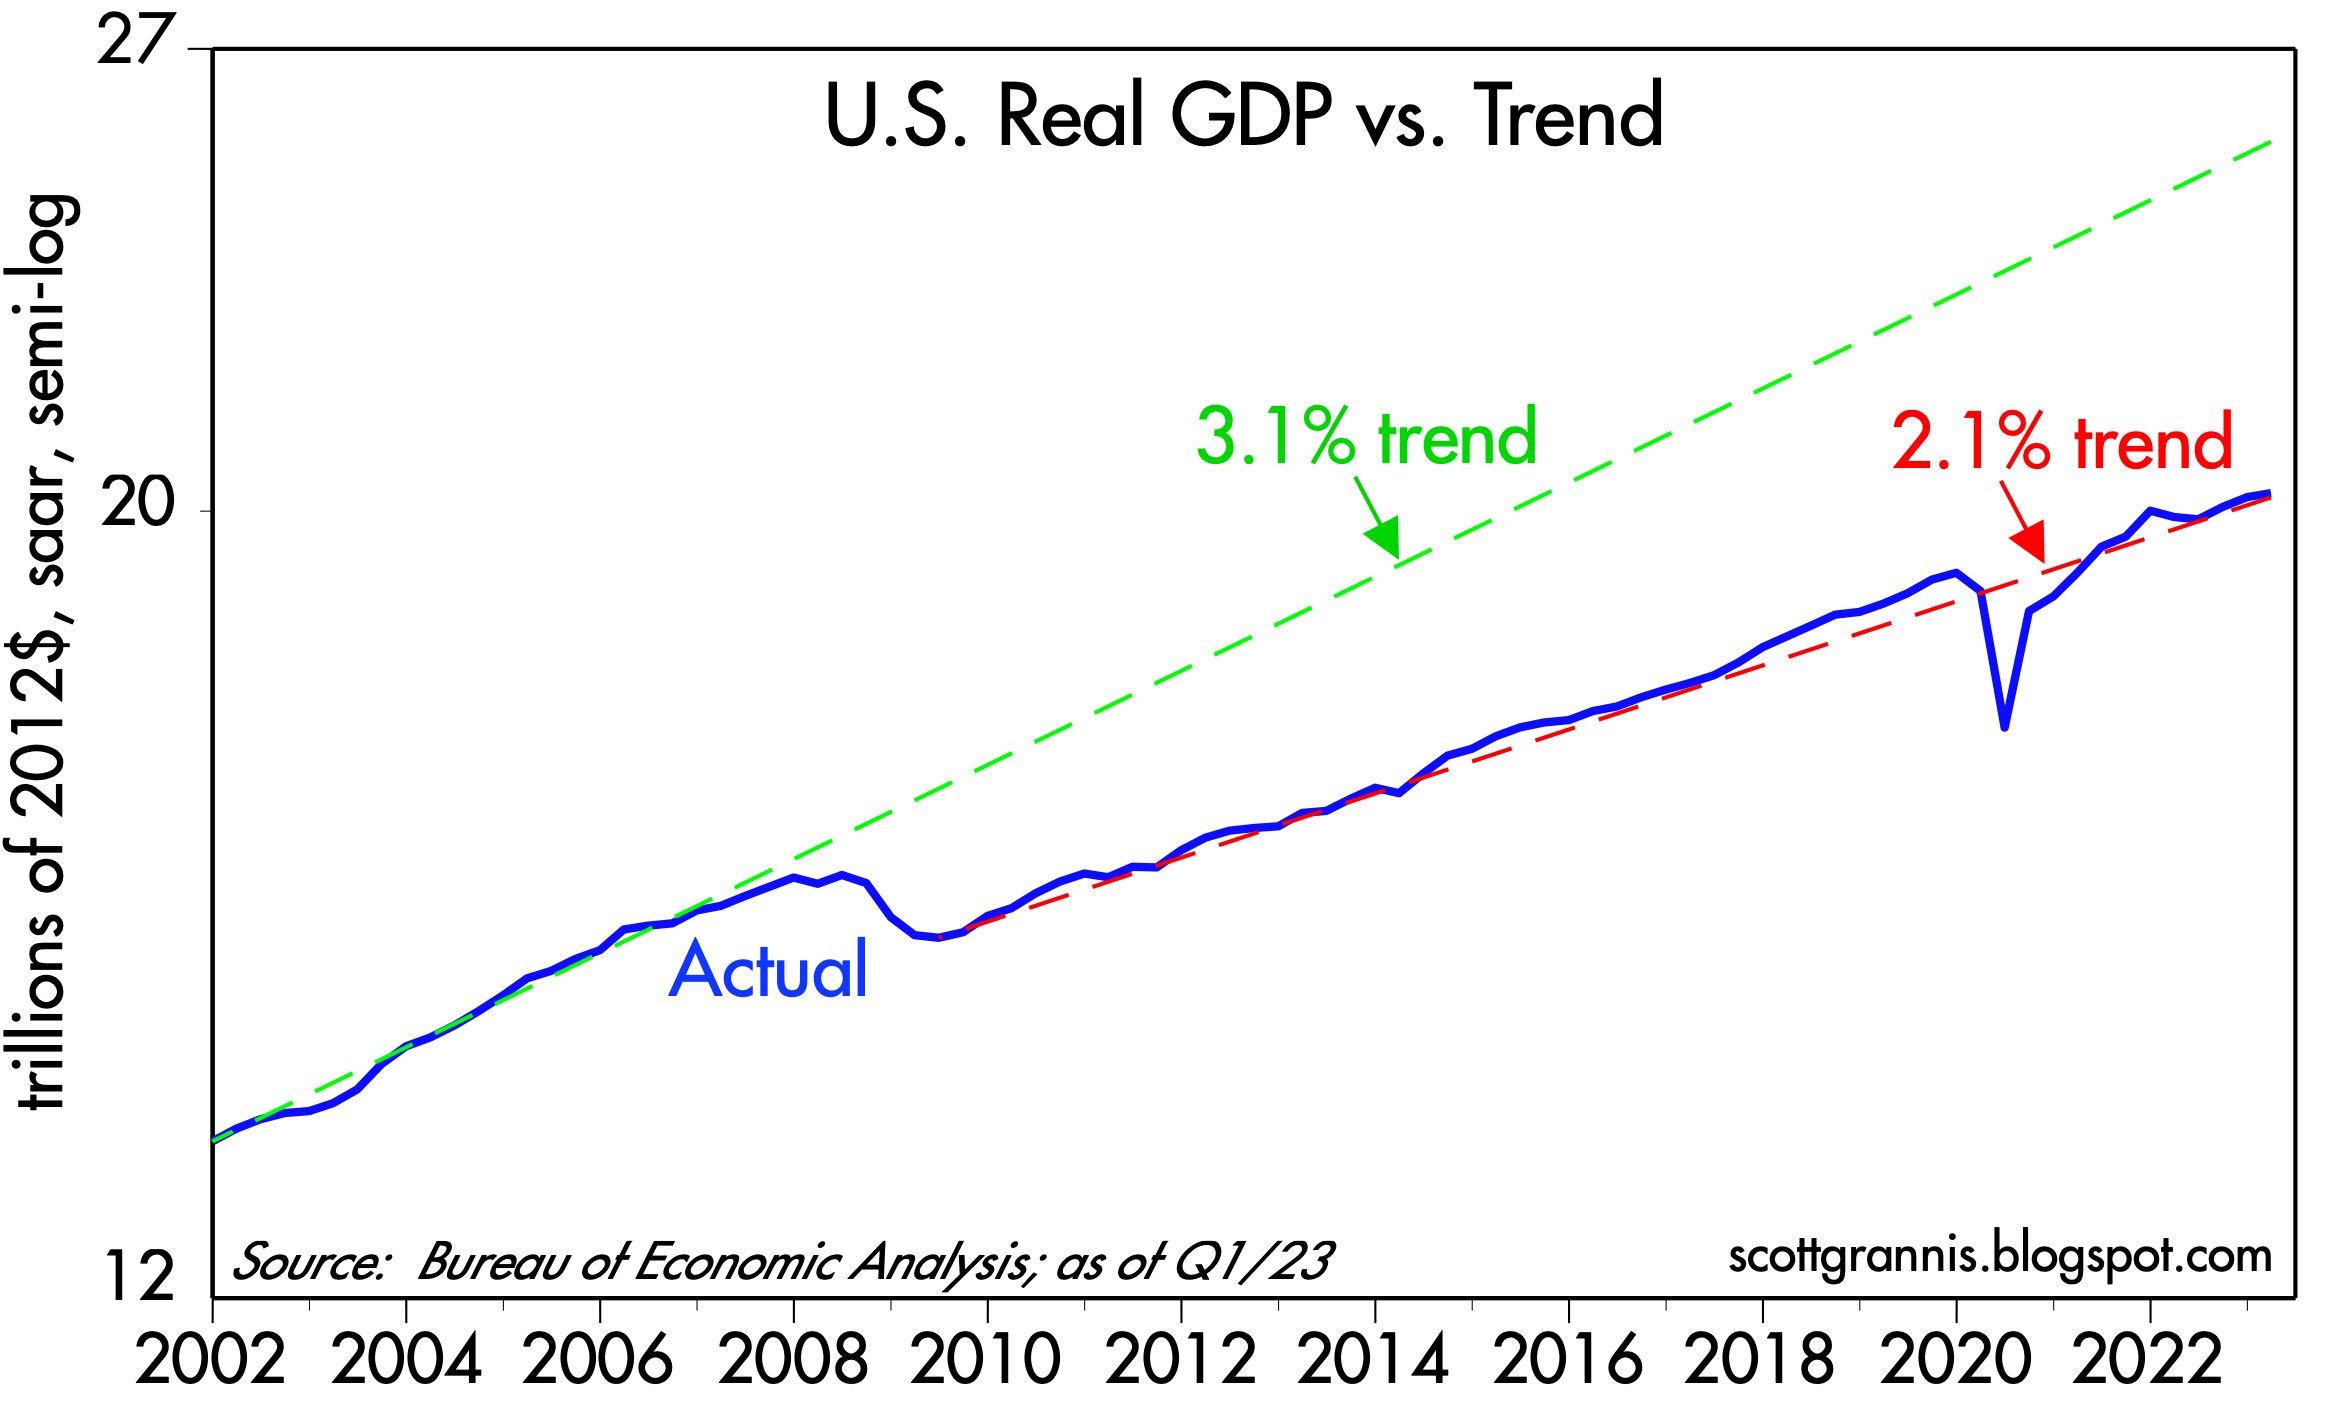
The news today was supposedly disappointing—GDP growth in the first quarter was weaker than expected, while inflation was a bit higher than expected—but I disagree. I see the economy continuing to grow at about a 2% rate and I see inflation falling. Here are two charts which I think give you a better picture of what's happening on the growth and inflation front.
 
Chart #1

Chart #1 compares the level of real GDP to different trend lines. (Note that the y-axis is logarithmic, so a straight line equates to a constant rate of growth.) From 1965 to 2008, the economy grew by about 3.1% per year on average. But then the economy's growth dynamics changed dramatically following the Great Recession of 2008-09. Since the recovery started in mid-2009, the economy has grown by 2.1% per year on average. Why? I see lots of policy headwinds: Huge increases in tax and regulatory burdens, huge increases in transfer payments, and huge spending on (inefficient) green energy sources, to name just a few, all of which I've discussed at one time or another over the years. 

Yes, annualized growth in GDP fell from a 2.6% rate in the fourth quarter to a 1.1% rate in the first quarter, but those are annualized figures which magnify the actual change in the quarterly levels. Note how you can hardly see this change in the blue line on the chart. Moreover, the mini-recession that supposedly happened in the first half of last year is just a wiggle on this chart. The broad growth trend remains about 2%. 

The net result is that 14 years of anti-growth policies have cost us over $5 trillion in lost output. Put another way, if nothing had changed since 2008, the economy would be about 25% bigger today—and incomes would also be 25% higher. To be fair, I note that demographics have changed; baby boomers retiring have reduced the growth of the labor force. Nevertheless, it's also true that the labor force participation rate has fallen from 66% in 2008 to now 62.6%. That means that some 5 million people of working age have decided to not work. I've tied that to a big increase in transfer payments, which I explained here.

Chart #2

Chart #2 compares the year over year change in the Consumer Price Index to that of the GDP Deflator, which is the broadest measure of inflation that exists. Here it should be clear that inflation by both measures is clearly declining. Moreover, the GDP deflator for the first quarter was an annualized 4%, and according to the CPI, inflation rose at an annualized rate of 3.8% in the first quarter. 

Finally, it's worth noting that swap spreads and credit spreads continue to be relatively low and well-behaved; there is nothing in those statistics which foreshadows a recession. Corporate profits have been mixed, but there have been some pleasant upside surprises of late in the tech sector (e.g., GOOG and META). A recession is far from being "baked in the cake." Nevertheless, the yield curve is still quite inverted, which means the bond market is pricing in the strong likelihood of a recession and an eventual Fed ease. In fact, the bond market assigns a high probability of another 25-50 bps rate hike at next week's FOMC meeting.

The Fed may well hike next week, but that would be a mistake in my view. If they do (because they want to regain some of the credibility they've lost over the past year or so), it won't be a surprise to the market. But if they don't, that would be a nice surprise. In any event, I prefer to bet on what is going on in the economy, not what is going on in the heads of the FOMC members. The Fed may be late to react to the economic realities, but react they will, and that's the bigger story I prefer to follow. 

An economy growing at a modest 2% rate, inflation by all measures declining significantly, combined with interest rates that are high enough to cause pain in many sectors of the economy, do not add up to a rationale for another rate hike next week. 

UPDATE (April 28): Today we received the March figures for the Personal Consumption Expenditure Deflators, which are measures of inflation at the individual level which are arguably superior to the CPI, mainly because they cover a broader basket of goods and services and the weightings of the components adjust dynamically as the economy and consumer habits change. Over long periods, the PCE deflator tends to register about 0.5% less inflation per year than the CPI, which is why many believe that the CPI tends to overstate inflation. It also explains why the Fed prefers to focus on the PCE deflator even though they talk a lot about the CPI. Chart #3 compares the two measures on a year over year basis.

Chart #3

Chart #4

Chart #4 looks at the 3 components of the PCE deflator: services, durable goods, and non-durable goods. It starts at 1995 since that was the year after China devalued its currency for the last time and simultaneously began its long march to become the world's biggest exporter of durable goods. It also marked the first year that the durable goods component of the PCE deflator turned negative. China did become a global powerhouse in durable goods and in the process they drove durable goods prices lower worldwide. US durable goods prices today are 31% lower than they were at the beginning of 1995.

Another point I want to make here is that durable and nondurable goods prices today are unchanged since last June, which not coincidentally was the high-water mark for the year over year change in the CPI and the PCE deflator. In other words, service sector prices are the sole source of whatever inflation has occurred in the US for the past 9 months. It's also important to point out that the cost of shelter (housing prices and rents)  is a significant portion of service sector prices, and as this post notes, that component of the CPI peaked last month. In the months to come, with housing and rental costs falling and durable and nondurable goods prices flat, overall inflation is almost sure to continue to fall.

Tuesday, April 25, 2023

M2 update: a return to normal by year end


Today the Fed released the M2 statistics for the month of March '23, and they were very encouraging. The decline in M2 which began about a year ago is accelerating, with the result that M2 has fallen by almost $900 billion (-4.1%) since its peak. Considering the ongoing growth in the economy and incomes, the ratio of M2 to GDP is now on track to return to pre-Covid levels by the end of this year. This is occurring despite a significant increase in federal deficit spending in the past 9 months (i.e., deficits are no longer being monetized). In short, the monetary inflation wave that flooded the US economy in recent years has receded significantly; as a result, inflation should return to some semblance of normal by the end of this year.

Chart #1

Chart #1 shows the growth of the M2 money supply, which mainly consists of currency in circulation, bank savings and deposit accounts, and retail money market funds. From 1995 through early 2020, M2 growth averaged about 6% per year. It then surged by some $6 trillion as the government began showering consumers with Covid emergency money, most of which ended up in bank savings and deposit accounts. Once the public began spending all this extra money, in early 2021, inflation began to rise.  

M2 growth started decelerating early last year and has since turned decidedly negative. As the chart suggests, the "gap" between actual M2 and where it would likely have been under normal conditions has narrowed by over 40%. At the current rate of M2 decline, the gap will be closed around January or February of next year.   

Chart #2

Chart #2 compares the growth of M2 to the size of the federal budget deficit. This is strong evidence that the outsized growth of M2 which ultimately fueled the big increase in inflation in recent years was the direct result of monetized federal deficit spending. It's VERY reassuring to see that although the federal deficit has been rising for the past 9 months, M2 growth has continued to decline. 

Conclusion #1: federal deficits are no longer being monetized. Thus, the monetary source of rising inflation has dried up. 

Chart #4

Chart #4 shows that there is about a one-year lag between growth in the money supply and the rate of inflation. (The CPI line has been shifted one year to the left so as to make this easier to appreciate.) The big acceleration in M2 growth which began in March '20 was followed by a big acceleration in inflation which began about a year later. Now the tables have turned: The sharp deceleration in M2 growth which began about two years ago was followed about one year later by a deceleration of the CPI. This strongly suggests that we are likely to see a further—and significant—decline in inflation over the course of the next 6-9 months.

Conclusion #2: there is no longer any need for the Fed to tighten monetary policy any further. Excess money dumped into the economy during the Covid crisis is being absorbed, and federal deficits are no longer being monetized. Without monetary fuel, and given that interest rates have been hiked significantly, the odds of a return to "normal" levels of inflation have improved dramatically. Instead of hiking rates next month, the Fed could, and probably should, lower rates, especially in view of increasing signs of economic weakness (e.g., disappointing corporate profits, lower confidence, a housing market on the skids).

Chart #5

Chart #5 is one I've been following for decades. It's very important because it sheds light on the all-important issue of the demand for money. As Milton Friedman taught us, inflation happens when the supply of money exceeds the demand for money. M2 is the best measure of the supply of money, but we lack any direct measure of the demand for money. As I explained in a long post early last year, Chart #5 is a good approximation for the demand for money. 

The initial surge in deficit spending (Q1, Q2, and Q3 of 2020) was effectively neutralized by an equivalent surge in money demand, with the result that inflation remained low throughout 2020 despite an enormous increase in M2. But then money demand weakened even as M2 continued to grow, and that imbalance fueled the rise in inflation that began in early 2021. The recent plunge in money demand (which began in earnest about a year ago) was offset somewhat by flat to falling growth in M2, with the result that inflation began cooling. Sharply higher interest rates, courtesy of the Fed (belatedly) also helped offset the inflationary potential of M2 by increasing the attractiveness of holding money and creating disincentives for borrowing—thus contributing to a slowing in the money supply.

At the current rate of decline in money demand, it should return to pre-Covid levels by the end of this year—at about the same time as the M2 money supply returns to its pre-Covid long-term trend. As Milton Friedman might observe, money supply and money demand are coming back into balance, and that means inflation is yesterday's news.