Showing posts sorted by relevance for query not printing money. Sort by date Show all posts

Wednesday, May 27, 2020

Monetary expansion Argentina-style

We are definitely sailing in uncharted monetary waters. In all of US history we've never come even close to today's monetary environment. Chart #1 is one that no economist ever expected to see coming out of the US:

Chart #1

In the 3 months leading up to May 11th (latest data available), the M2 measure of the US money supply has increased at an 82% annualized rate. In the past six months, it's up at a 40% annualized rate, and in the past year, M2 has increased by over 23%, and these numbers will go higher in the next week or two. This is serious, Argentine-style money growth. The big question now is whether so much monetary expansion will give us Argentine-style inflation.

Chart #2

Chart #2 shows the year over year growth rate of Argentina's M2 money supply, which is up 97% in the past year. From late 2010 through early 2018, Argentina's money growth averaged about 30% per year, and inflation was in the neighborhood of 25-30% per year. Given the recent surge in money creation, inflation in Argentina is going to be approaching 100% before too long.

Chart #3

Chart #3 shows what a decade or so of rapid money growth has done to the value of the Argentine peso. Since early 2007, the peso has fallen from just over 3 to the dollar to now 117; that translates into a 97.5% loss of value vis a vis the dollar. Since the Argentine government locked down the economy fiercely in order to fight Covid-19, revenues have all but dried up. The only way it can pay the bills is to literally print money. 

I've been an avid student of monetary policy and inflation ever since I spent four years living in Argentina in the late 1970s. Back then, inflation averaged about 125% per year, and during a visit to the country in the mid-1980s I was fascinated to watch hyperinflation unfold: prices almost tripled within the span of three weeks. In 2015 I wrote a post on the subject of inflation and Argentina, in which I explained that the conditions in Argentina that allowed a huge increase in inflation didn't exist in the U.S., despite the Fed's massive expansion of its balance sheet and the creation of trillions of dollars of bank reserves. Unlike the US, the government of Argentina relies on direct printing of money to finance its deficit, whereas the U.S. government finances its deficit by selling  bills, notes and  bonds. When the Argentine government needs to finance a budget shortfall, it can "borrow" money directly from its central bank in exchange for an IOU, which in practice is never repaid. In essence, the Argentine central bank simply runs the printing presses whenever the government needs money, and the government pays its bills with monopoly money.

Will the same happen to the US? I sincerely doubt it, but it's not impossible.

In 2013 I wrote a post entitled "The Fed is not printing money," which addressed in detail why the Fed's monetary expansion in the wake of the Great Recession was not inflationary. Over the years since then I have consistently argued that the Fed's huge expansion of bank reserves was unlikely to lead to higher inflation since the Fed was correctly supplying reserves to accommodate the banking sector's demand for safe assets (bank reserves are functionally akin to T-bills). Inflation only happens, as Milton Friedman taught us, when the supply of money exceeds the demand for it. And indeed inflation has remained relatively low and stable for most of the past decade—which in effect proves that the Fed was not "printing money."

The key feature of the US monetary system is that the Fed can not create money directly—only banks can do that. The Fed can, however, make it easier for banks to create money by increasing the supply of bank reserves. Banks need reserves in order to collateralize their deposits. The Fed creates reserves by buying securities (e.g., Treasury bills, notes and bonds, and more recently, mortgage-backed securities and some corporate bonds). In effect, the Fed buys securities and pays for them with bank reserves. But crucially, reserves are not money that can be spent anywhere. The Fed simply swaps reserves for notes and bonds, thus transmogrifying longer-term securities into short-term, risk-free securities. Reserves have become equivalent to T-bills, since they are default-free and pay a floating rate of interest.

In times of great uncertainty and surging money demand, like today, the Fed fills the market's need for short-term safe securities by buying riskier securities and paying for them with risk-free reserves. If banks don't want to hold the reserves they can use them to support increased lending, which indeed does result in a monetary expansion. But if that expansion exceeds the market's demand for money, then higher inflation will be the result. The fact that inflation so far has not risen is proof that the Fed's actions have not been inflationary. Excess reserves—which now total $3.2 trillion—have served to satisfy the banking system's demand for risk-free, short-term assets, and more recently to satisfy the public's demand for a massive increase in bank savings deposits and checking accounts, as shown in Chart #4, which in turn has been turbo-charged by all the uncertainties and disruptions caused by the Covid-19 panic:

Chart #4

Looking ahead, the most important question becomes, "What happens when the Covid uncertainties decline and the demand for risk-free assets declines?"

If the Fed does not reverse course in a timely manner (e.g., by selling notes and bonds and extinguishing bank reserves), then we will find ourselves flooded with unwanted money. And as Argentina has demonstrated, that can lead to a big increase in inflation.

And that is what my friend Nuni Cademartori is illustrating in the cartoon which follows. Too much money erodes the value of money. I've got stacks of million-peso Argentine notes printed decades ago that today are worth about the same as toilet paper.

Let's hope this does not come to pass in the US:


Thursday, October 8, 2020

On the demand for money and other considerations


This blog has consistently employed a supply-side approach to fiscal policy (e.g., improving the incentives to work and take risk tends to lead to a stronger and more prosperous economy, as does reducing regulatory burdens) and a classic approach to monetary policy (e.g., inflation occurs when the supply of money exceeds the demand for it). In this post I focus on monetary policy, reiterating and amplifying observations that I have made over the past decade or so.

It's easy to measure the supply of money, and the Fed provides those statistics weekly. The M2 measure of money is broadly favored, and it is the one I have consistently used. More recently I have emphasized two components of M2—savings deposits and demand deposits—which together comprise about 75% of the $18.4 trillion M2. I have argued that these two measures are a good proxy for the demand for money, even as they are also measures of the supply of money. Both components represent money that has been set aside my consumers and businesses as a form of saving, security and/or comfort—essentially a hedge against risk. They are distinct from checking accounts and currency in circulation, since those are held primarily for convenience (e.g., to make monthly payments and to make miscellaneous purchases) rather as a risk-free store of money.

With the interest paid on savings deposits and demand deposits now hovering just above zero, it's easy to see why these deposits are a good proxy for money demand. Since they yield practically nothing, people hold them simply because they want a store of value that is easily accessible and relatively risk-free. For most of our history, these deposits paid an attractive rate of interest that was greater than the prevailing rate of inflation (i.e., real interest rates were positive). Those conditions (high interest rates) served to muddy the monetary waters, since it's tough to know whether people held these deposits as investments or merely as a store of value. Now, with interest rates at or near zero it's easy: they respond directly to people's demand for money and safety.
As I predicted back in 2009 and 2010, when the M2 measure of money was growing faster than ever before, the then-rapid growth of money would not be inflationary, because rapid M2 growth was being driven by strong growth of savings and demand deposits. The Fed was accommodating a huge increase in the demand for money; the Fed was NOT "printing money" with abandon as so many thought. (That includes yours truly, since I worried about rising inflation in late 2008 and early 2009. I later realized I was wrong.) The proof of the monetary pudding, as it were, was to be found in the fact that inflation has been low and relatively stable for a long time. Indeed, the world has worried more about deflation in the past decade than it has about rising inflation, despite rapid growth in the money supply.

How do you get low and even falling inflation when the supply of money is expanding rapidly, as it did in late 2008 and early 2009? It can only happen if the demand for money is growing as fast or faster than the supply of money. If a farmer is selling more apples every day it's because the demand for apples is also increasing every day; otherwise he would find himself with a glut of apples and would soon have to cut the price of his apples. A lower price would be required to bring demand back into line with supply.

What follows are some charts which focus on money supply and money demand. The story they are telling is similar to what it was a decade ago: incredibly rapid money growth is occurring because the demand for money is incredibly strong. The Fed is not printing money and so, for the time being at least, there is little risk of inflation.

Chart #1

Chart #1 shows the composition of the M2 measure of the money supply. Bank savings deposits make up by far the biggest portion, and they currently total almost $11.6 trillion. Currency is the next largest portion, currently totaling $1.9 trillion. One could argue that currency in circulation in a good measure of money demand, because nobody holds onto currency unless it serves them a purpose. It's complicated, however, because foreigners hold the vast majority of US currency. Do some math, and you will see that if $1.9 trillion of currency (mostly $100 bills) were held by only US residents, then each of us would be holding almost $6,000 in cash on average. Don't know about you, but my family rarely has more than $1000 in cash lying around or stashed under the mattress. Currency tells us a lot more about foreigners' demand for money than it does about the demand for money of US residents. Interestingly, currency has surged at a 23% annual rate since last February, which suggests the whole world is scared of Covid—which is not surprising since Covid is a problem everywhere. In any event, the Fed supplies currency only on demand, and in exchange for bank reserves, so the supply of currency and the demand for it are always in balance.

Chart #2

Chart #2 shows the level of the M2 money supply compared to the long-term trend rate of M2 growth (green), which has averaged about 6.5% per year for the past 20 years. M2 exploded starting last March, as the Fed pulled out all the stops and the federal government began mailing big checks to tens of millions of displaced workers and struggling businesses. M2 has now increased by about $3.2 trillion over the past seven months. Growth in savings and demand deposits account for about 80% of the increase in M2.

Here's the underlying and underreported story: federal debt has increased by almost the same amount ($3.4 trillion) as M2 has since last March. The Fed bought substantially all of the Covid-era federal debt (notes and bonds) issued by the federal government and paid for them with bank reserves. The banking system experienced an equivalent surge in deposits, which they used to buy the treasuries the Fed then bought from them. The banking system effectively "invested" their deposit surge in bank reserves. By buying over $3 trillion of treasuries, the Fed effectively converted (transmogrified, as I like to say) notes and bonds into short-term, risk free assets, since bank reserves are essentially T-bill substitutes which the banks find to be an attractive way to invest their deposit inflows. Bottom line, the increase in the money supply was driven by an equivalent increase in the demand for money and money equivalents. That's not inflationary. 

Chart #3

Chart #3 shows the 3-mo. annualized growth rate of savings and demand deposits, which was truly explosive from early March until just a few months ago. Note how this component of M2 also experienced rapid growth around the time of the Eurozone crisis in 2011, when money fled to the security offered by US banks. Note also how the growth of savings and demand deposits slowed in the wake of the Nov. '16 elections: money held in safe form flowed back into the economy as confidence increased and the economy prospered. If we're fortunate, the economy will sooner or later lose its fear of Covid and money will once again leave deposit accounts and go back into the economy, there to fuel rising consumption and an expanding economy.

It's important to note here that the growth rate of M2 has almost completely returned to what it was prior to the Covid crisis: in the past three months M2 has increased at about a 10% annualized rate, and in the three months prior to last March, M2 increased at about a 6% annualized rate. What that means is that demand for money is no longer rising by much. Thus the Fed has little reason and little need to continue to convert notes and bonds into T-bill equivalents. Simply put, there doesn't seem to be a need for much more "monetary stimulus" as it is incorrectly referred to (actually, it's just an accommodation of increased money demand).

Chart #4

Chart #4 compares the level of nominal GDP to the level of M2. Both have increased by about the same order of magnitude over the past 60 years. Until this year, that is. What's happening is that the economy has effectively and suddenly increased its desire to hold money rather than to spend it. This is a natural reaction to the great uncertainty and fear that the Covid crisis has caused. But as that tendency reverses—as the demand for money declines—there is plenty enough money out there to fuel a big increase in real and nominal GDP.

Chart #5

Chart #5 divides the level of M2 by the level of nominal GDP. I've labeled the result "money demand." I like to think of this as being a proxy for the amount of cash and cash equivalents the public wants to hold, expressed as a percentage of average annual income. Prior to the Covid crisis, as a country we were comfortable holding a cash and cash-equivalent reserve equal to about 70% of our annual income; now it's almost 90%. Money demand was relative stable for many decades, but it has increased dramatically in the wake of the Great Recession and now during the Covid panic. However, money demand is already beginning to decline. I've estimated the value of the ratio for the third quarter, assuming 10% annualized growth in M2 and a 30% annualized growth of nominal GDP. It will probably decline a lot more in the months and the years to come as confidence returns and the economy grows.

What happens when the demand for bank deposits declines? Let's say the public decides over the next year to withdraw $1 trillion of the $3 trillion they added to bank deposits this year. As the money is withdrawn, banks will no longer need $1 trillion of the bank reserves they "bought" this year. Banks can simply sell their reserves back to the Fed in exchange for notes and bonds. They can then sell the notes and bonds in exchange for cash which they can then distribute to those who are withdrawing their money. In the process, the demand for notes and bonds will decline, and that would likely translate into higher interest rates. Which is exactly what we would expect to happen as the economy recovers and returns to more normal conditions. If the Fed is on top of this development, they will happily sell notes and bonds and retire bank reserves, and the money supply will shrink in line with a reduction in money demand. But if the Fed insists on keeping plenty of reserves in the banking system, they would risk creating a surplus of money and that would be inflationary.

One soon reaches the conclusion that the Fed has been reacting to changes in the demand for money rather than stimulating anything. I and others have said this many times in the past. The Fed would have us believe they re setting the tone and the level of interest, when in reality they are simply accommodating the mood of the market. Whatever the case, it is clear that interest rates are extremely low not because the Fed has said so, but because the market's demand for short-term, cash-equivalent assets (e.g., T-bills and bank reserves) is enormous. The market is willing to pay such a high price for them that their yield has been pushed down to near zero. Thus, the prevalence of near-zero or even negative interest rates can mean only one thing: risk aversion remains very strong these days. The market is not exuberant or irrational. The Fed has not stimulated anything.
Chart #6

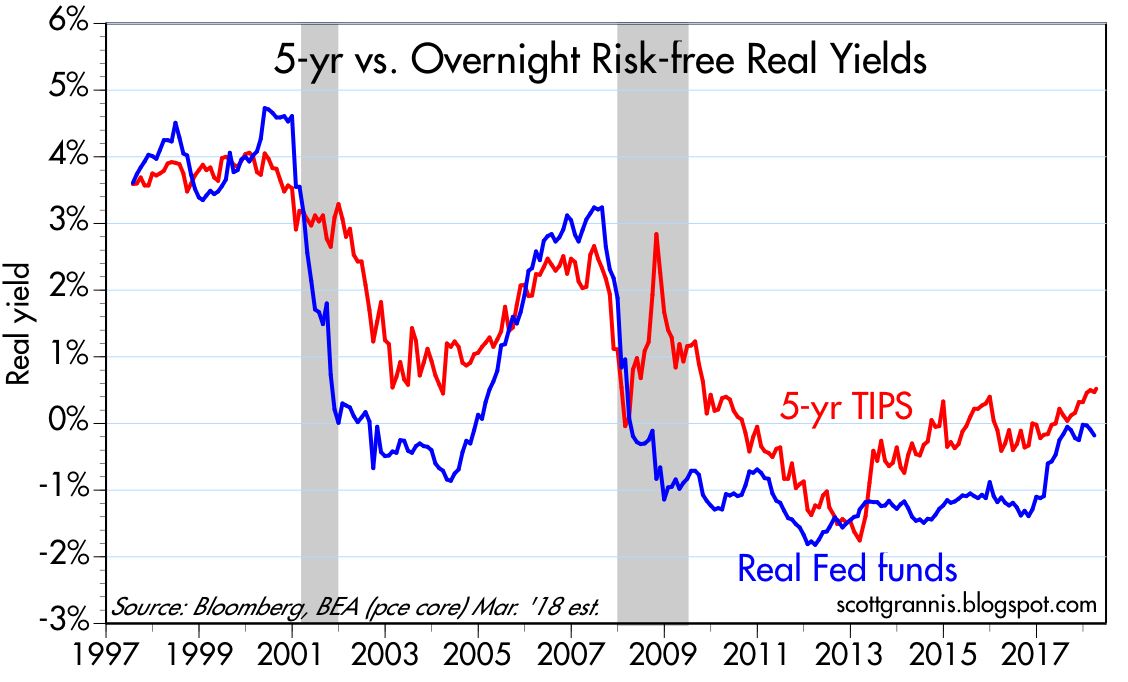
Chart #6 is my favorite way of seeing whether the Fed is behaving correctly. The blue line is the inflation-adjusted Fed funds rate (i.e., the Fed's target rate minus the year over year change in the Core Personal Consumption Deflator), and the red line is the real yield on 5-yr TIPS, which in turn is essentially the market's expectation of what the real funds rate will average over the next 5 years. When the blue line is below the red line, the Fed is behaving well and the economy is healthy, because the market is expecting the real funds rate to rise in the future. But when the blue line is above the red line this means the Fed is so "tight" that the economy is likely to weaken and the Fed will eventually need to lower the real funds rate in response. Today it looks like the Fed is just about right. 

The charts that follow are interesting in their own right, and help me to understand what's going on in the economy:

Chart #7

Chart #7 compares the price of gold to the price of 5-yr TIPS (using the inverse of their real yield as a proxy for their price). It's remarkable that the prices of these two completely different assets should be so closely correlated over so many years. I can only conclude that the market views both assets as "safe havens." Both provide insurance against nasty events: gold protects you from disasters of all sorts, and TIPS are guaranteed to protect you against a rise in inflation. Both prices appear to have peaked, which suggests that the demand for money and safety has peaked. That confirms the message of M2.

Chart #8

Initial claims for unemployment were disappointingly unchanged last week, but continuing claims continued their strong downtrend, as seen in Chart #8. From a peak of 25 million in early May, they are now down to 11 million. That means that at least 14 million people who lost their jobs have now gone back to work. In other words, 60% of the jobs lost have been recovered, which further suggests an ongoing decline in the rate of unemployment. That counts as a V-shaped recovery in may book. It's tragic, however, that there are still so many unemployed, and that their ranks are filled with the most vulnerable. The only solution for so much misery is to OPEN THE ECONOMY ASAP. Failing that, the government should somehow compensate the workers who have fallen on hard times directly as a result of terribly misguided public policy choices. 

Chart #9

Car sales, shown in Chart #9, have almost completely reversed their Covid plunge. Another V-shaped recovery.

Chart #10

CDS spreads, shown in Chart #10, are the most liquid measure of generic corporate credit risk. Happily, they are very low, as are swap spreads. This strongly suggests that liquidity conditions in the financial market are very healthy and the outlook for the economy is also very healthy. 

Chart #11

Chart #12

Charts #11 and #12 show that air travel is decidedly NOT enjoying a V-shaped recovery. For the past three months, gains in passenger traffic have been very small. Overall traffic today is still down some 66% versus year-ago levels. A sobering statistic. Fear of flying will be with us for a long time, it would appear.

Covid comments

Catching Covid is not a death sentence, as Trump has showed us: "Don't be afraid of Covid. Don't let it dominate your life." Very wise words from our Commander in Chief, who is unafraid to bow to the prevailing orthodoxy of fear. In that regard, Heather Mac Donald has a very good quote (HT Mark Perry):

"Reopening is still the right policy. Mandatory outdoor mask-wearing is merely a way for government to turn citizens into walking billboards of fear, sending the false message that danger is everywhere. Infection rarely leads to death. Most of the infected recover. Given his governmental duties, the surprise is that Trump—as president, another kind of front-line worker—has not gotten sick before now."

Don't miss the Great Barrington Declaration, an open letter signed by more than 7,000 mental & public health scientists and medical practitioners. In it they argue strongly for opening the economy, especially schools, while protecting the vulnerable (i.e., mostly the elderly and infirm). Here is a functioning link for the Great Barrington Declaration.

UPDATE: A MUST WATCH VIDEO by Dr Reiner Fullmich. An intelligent, well-argued brief for why there was never a Covid “pandemic.” It’s always been just a bad flu, as I and many others have been arguing since last April. Lockdowns have had no impact. Tests, as even the NY Times has admitted, cannot reliably detect Covid infections, and the vast majority of positive results are false positives. It’s a “case-demic” not a pandemic. Governments everywhere have systematically trampled the constitutional rights and liberties of their people without any justification. Watch it and weep for the miseries unnecessarily inflicted upon millions of innocent people and businesses.

Wednesday, July 23, 2014

Recovery rests on solid, not liquid ground

It's not hard to find analysts who argue that this recovery owes everything to the Fed's massive injections of liquidity. By pumping money and keeping short-term interest rates near zero, the Fed has forced liquidity into risky assets, thus propping up equity prices excessively and artificially.

As long-time readers of this blog know, I think that argument is weak at best. The Fed has not been printing money with its Quantitative Easing programs. The Fed has simply been swapping bank reserves (which are functionally equivalent to T-bills) for notes and bonds, and they have been doing this in size in order to accommodate the world's demand for safe assets. The Fed hasn't been dumping tons of new money into the system, the Fed has been supplying liquidity that the market demanded. We haven't seen any unusual increase in inflation because the Fed's supply of money has been equal to the demand for money.

But even if the Fed were "pumping" money into the economy, it's a stretch to think that extra money can translate into real growth. If printing money could make an economy grow, Zimbabwe and Argentina would be economic powerhouses—but they aren't. Printing money that no one wants is the basic recipe for inflation, and that's not been the story of the current business expansion in the U.S. economy.

Here are some charts that focus on the physical growth of the U.S. economy. This is real growth, not make-believe, liquidity-driven growth.


Manufacturing production (the volume output of industrial establishments in mining, quarrying, manufacturing, and public utilities) has increased by 25% in the past five years. It's almost at a new all-time high. The manufacturing side of the economy survived, and has largely recovered from, its steepest plunge in history.


Actual shipments by truck, rail, waterways, pipelines and aircraft, as measured in ton-miles by the Dept. of Transportation, has increased over 25% in the past five years, and is now at a new all-time high.


Truck tonnage, as measured by the American Trucking Association, has increased by almost 30% in the past five years and is now very close to its all-time high. As the above chart shows, there is a decent correlation between the level of truck tonnage and the real value of the equity market. When the physical size of the economy increases, so do equity prices in real terms. Furthermore, equity prices do not appear excessive when compared to the increase in the physical size of the economy. (They did look excessive in 2000, however, and they looked extremely depressed in 2009.)


The nation's architectural firms report an increasing number of billings, a good sign that the commercial real estate market is expanding.


New housing starts are up about 80% in the past five years, and builders appear reasonably confident that construction activity will continue to increase.


U.S. exports of goods have increased 65% in the past five years and are at a new all-time high.


World trade volume has increased almost 35% in the past five years, and is now at an all-time high.


U.S. crude oil production has surged over 70% in the past five years, with the result that the U.S. has surpassed Saudi Arabia as the world's largest oil producer. Back in 2008 this would have been unthinkable, and it's all due to the ingenuity of oil producers (i.e., fracking technology).


A composite index of chemical industry activity has increased 27% in the past five years, and has grown by 4.3% in the year ending June 2014—a good indicator that the U.S. economy continues to grow.


The private sector has created almost 10 million jobs in the past four years, and private sector jobs are now at a new all-time high. 


The jobs market is stronger and unemployment is lower primarily because fixed investment (e.g., investment in new things—new buildings, new homes, new plant and equipment) has increased faster than the overall economy.

There's still a lot of room for all of these indicators to improve. It's still the case that this has been the weakest recovery in history. But it is nevertheless a recovery, and the economy has without question been growing in a real, physical sense. This is a genuine economic expansion, and the rise in equity prices is a reflection of that growth. It's not a liquidity-driven mirage, it's real.

Wednesday, March 30, 2016

This is what "printing money" looks like

Since late 2008, when it launched the first of its three Quantitative Easing programs, the Fed's accusers have bemoaned its massive money-printing, sure that it would lead to the debasement of the dollar, the advent of hyperinflation, and the end of the world as we know it. I was part of that crowd initially, but soon realized that the Fed's massive expansion of bank reserves was not inflationary because it simply offset the banking system's incredible demand for safe, dollar liquidity. I've had many posts over the years which have expanded on this theme.

I've been an avid student of monetary policy and inflation ever since I spent four years living in Argentina in the late 1970s. As I recall, inflation averaged about 125% a year while I lived there, and during a visit to the country in the mid-1980s I was fascinated to watch hyperinflation unfold: prices almost tripled within the span of three weeks. A year ago I wrote a post on the subject of inflation and Argentina, in which I explained that the conditions in Argentina that allowed a huge increase in inflation don't exist here in the U.S., fortunately. The government of Argentina relies on direct printing of money to finance its deficit, whereas the U.S. government finances its deficit by selling bonds. When the Argentine government needs to finance a budget shortfall, it can "borrow" money directly from its central bank in exchange for an IOU, which in practice is never repaid. This shows up on the central bank's books as "Loans to the Federal Government." In essence, the Argentine central bank simply runs the printing presses whenever the government needs money, and the government pays its bills with funny money.

Here's what it looks like when a central bank "prints money" and high inflation results:


Argentina's most recent bout of money printing and high inflation started back in 2009, when the government started running a deficit that needed to be financed by money printing. By early 2010, the growth in the supply of currency in circulation in Argentina was nearing 30%. Currency in circulation has grown at an annualized rate of about 30% ever since, as the chart above shows—in the past six years, the supply of currency has expanded almost five-fold, from 82 billion to 400 billion pesos. In the U.S., in contrast, currency in circulation has been growing at a 6-7% annual pace for decades, and strong offshore demand for greenbacks has been the main driver of that growth.


True money printing results in higher inflation because there's basically too much money chasing too few goods and services. Printing money with no solid backing and in excess of the public's need for money simply causes the value of money to fall and prices to rise. We see this in the chart above, with the early signs of money printing showing up in the black market (referred back then as the "blue" rate of exchange) in mid-2010. Since March of 2010, the peso has fallen by almost 75% against the dollar, and inflation has been running around 30% per year. We don't know for sure how much inflation there's been, because the government office charged with measuring inflation was long ago told to just make up the numbers. The government of Cristina Kirchner didn't want to acknowledge what it was doing, but everyone who lives there knows that inflation was been very high for many years.

The new government of Mauricio Macri has vowed to stop the money printing, but it hasn't happened yet. The problem is that Argentina still can't finance its deficit by borrowing money legitimately. That may change soon if the government is able to mend relations with its foreign creditors and if it manages to rein in its excessive spending. I'm optimistic it will happen, and if it does we should see slower growth in currency, a gradual stabilization of the peso, and stronger growth in the economy. Big changes are afoot in the southern part of Latin America, and it could get pretty exciting if Brazil joins the reform movement.

Monday, March 18, 2013

The Fed is not "printing money"

The idea that the Fed is "printing money" with abandon, and that this is seriously debasing the U.S. dollar, is a fiction borne of ignorance of how monetary policy actually works. Fed policy may indeed pose the risk of serious debasement in the future, but to date there is little or no evidence to suggest that this has occurred.


The above chart is a graphical depiction of how the Fed's balance sheet (in simplified form) has changed over the past six years, from a time in early 2007 when the economy was growing normally (although the housing correction was just beginning), to the situation today. The major changes: on the liability side, relatively normal growth of currency in circulation (see below for details), and gigantic growth in bank reserves; on the asset side, the elimination of T-bills, strong growth in T-bonds, and unprecedented growth and holdings of MBS and Agency securities. Put another way, the Fed has purchased about $2.36 trillion of T-bonds, MBS, and Agency securities, shed about $280 billion of T-bills, and in the process created $420 billion of new currency and $1.7 trillion of new bank reserves.


As the chart above shows, currency has grown at a 6.8% annualized rate since early 2007, the same rate that we have seen for the past 20 years. Currency actually grew at a faster rate from 1993 through 2003 than it has in the past six years, and the former was a period when inflation averaged 2.5%. In the past six years, inflation has averaged about 2.2%. So the recent growth in currency is nothing out of the ordinary, and does not necessarily imply higher inflation than what we have seen in recent decades. It is also important to note that the Fed only supplies currency on demand, in exchange for bank reserves. Thus, the Fed cannot "force-feed" currency to the world. The world holds only as much currency as it wants to hold, so growth in currency is not necessarily inflationary at all.


In addition to currency in circulation, the other major component of the Federal Reserve's liabilities is bank reserves, shown in the chart above. Here we see enormous growth, orders of magnitude in excess of historical experience. In fact, the Fed has expanded bank reserves by a factor of 18 in the past six years. Isn't this the same as "printing money?" No, because bank reserves aren't "money" and can't be spent anywhere. Bank reserves exist only as a liability on the Fed's balance sheet. Banks can exchange their reserves for currency, and currency can be spent, but as we saw above, currency has not grown by any unusual amount. Banks have instead been content to hold on to the majority of the reserves the Fed has created. This is due to the fact that the Fed started paying interest on reserves in 2008, which makes reserves functionally equivalent to T-bills, and the fact that banks have wanted to increase their capital and fortify their balance sheets, and bank reserves fit that bill.

In effect, the Fed has been doing nothing more than swapping newly-created bank reserves for bonds and currency, and the world and the banking system have been happy to participate in the swap. The Fed has taken duration risk out of the market and supplied low-risk and highly liquid assets in return. In a post last December, I described how in a way the Fed has been acting like the world's biggest hedge fund.


Banks can exchange their reserves for currency if the public demands it, or banks can hold on to their reserves if they want to increase their capital and fortify their balance sheets. The only other thing banks can do with their reserves is to support an increase in their deposits. In our fractional reserve banking system, banks must hold about one dollar of reserves for each ten dollars of deposits. Banks are the only ones who can "print money," and that is done by extending credit to borrowers. Given the increase in bank reserves, banks could theoretically have increased their lending and their deposits (which currently total about $8.7 trillion) by a factor of 18, or over $150 trillion. Obviously, nothing of the sort has happened.


As the chart above shows, the M2 measure of the money supply has grown only slightly more than 6% per year for the past 18 years. Since early 2007, M2 has grown at an annualized rate of 6.5%, about the same as currency. Again, there is no sign here of any usually fast growth as a result of the Fed's enormous expansion of bank reserves.


The proof is in the pudding: inflation by any measure has been averaging between 2 and 2.5% for the past six years, with no signs of any acceleration. We are thus forced to the conclusion that the Fed has not allowed any undue expansion of the money supply. Whatever growth in the amount of money there has been has only been slightly in excess of the world's increased demand for money and money equivalents, and that is why inflation has been relatively low.


As the chart above shows, the world's demand for M2 money has been extraordinarily strong in recent years. Since early 2007, M2 has grown 26% more than nominal GDP, with the result that the ratio of M2 to nominal GDP has reached its highest level since the late 1950s. Monetary policy has been enormously accommodative, but at the same time money demand has been exceptionally strong. It follows that if the Fed hadn't been so accommodative, we could have suffered deflation and/or a weak economy, since the economy would have been starved for liquidity.


Since November 2008, the fastest-growing component of the U.S. money supply has been savings deposits, which have increased 68%, from $4 trillion to $6.7 trillion. The enormous growth in savings deposits has almost certainly not been driven by their attractive yields (which have been close to zero), so it must be due to an overwhelming desire for liquidity and safety. Consumers have been deleveraging and increasing their money balances to an exceptional degree because they have become more risk-averse. Most of the growth in the money supply has been due to an increased demand for money and safety.

And just as consumers have worked hard to increase their money balances, banks have been very willing to hold on to the extra bank reserves the Fed has created, as they have struggled to boost their reserves and fortify their balance sheets.

In a sense, the Fed has spent most of the past 5-6 years responding to an unprecedented increase in risk aversion, which has manifested itself in a tremendous increase in the demand for cash, cash equivalents, deposits, and bank reserves. This increased demand for safety and liquidity has been the flip side of an equally unprecedented decline in confidence and an increase in risk aversion.

All of this leads to the following conclusion: since the Fed's quantitative easing efforts to date have been only sufficient to satisfy a huge increase in the demand for cash, cash equivalents, and bank reserves, what will happen when the demand for safe and liquid assets declines? When confidence in the future returns? When risk aversion declines? Will the Fed be able to reverse its quantitative easing efforts in a timely fashion, before an excess of reserves and a declining demand for cash pushes inflation higher? As I mentioned in a post last December,

... the biggest risk we all face as a result of the Fed's unprecedented experiment in quantitative easing is the return of confidence and the decline of risk aversion. If there comes a time when banks no longer want to hold trillions of dollars worth of excess bank reserves for whatever reason (e.g., the interest rate the Fed is paying is no longer attractive, or the banks feel comfortable using their reserves to ramp up lending, or the public no longer wants to keep many of trillions of dollars in bank savings deposits), that is when things will get "interesting."

Stephen Williamson discusses this same issue in great detail here, but from a slightly different perspective. The common thread we share is that the thing to worry about going forward is a declining demand for cash, cash equivalents, and bank reserves, since that could result in higher inflation if the Fed fails to take offsetting measures (e.g., draining reserves and/or increasing the interest it pays on reserves) in a timely and potentially aggressive fashion. There is no a priori reason to think they can't, but there is certainly reason to be worried, since we are sailing in uncharted monetary waters.

Unfortunately, it's ironic and paradoxical that the Fed's efforts to supply additional reserves to the banking system—at a time when the banks have many times more reserves than they could possibly want—may be doing just the opposite of what the Fed intends. Instead of boosting confidence, the Fed may be contributing to worries about the future course of inflation and interest rates. More reserves are not going to increase bank lending, since banks already face zero constraint on that score. Will more reserves increase confidence, or will they just increase concerns about the future?

It's not clear at this point what will happen as the Fed increases its purchases of Treasuries and MBS and creates more bank reserves in the process. But as long as uncertainty exists—and the Cyprus bank deposit fiasco threatens to increase risk aversion in the Eurozone—the demand for reserves is likely to remain strong and inflation is likely to remain subdued. As for the economy, it looks like it is slowly healing and taking care of itself.

Thursday, April 12, 2018

Reading the yield curve's message

If you haven't already heard that an inverted Treasury yield curve is a good predictor of recessions, then either you haven't been reading this blog for long or you haven't been reading much in the financial press of late. (For background, see some earlier posts of mine on the subject here and here.) The subject has become the focus of attention in recent months because the yield curve has been flattening, which in turn has sparked concerns that the risk of recession is rising. These concerns are misplaced, as I explain below.

Chart #1


The top portion of Chart #1 is the standard way to display the status of the Treasury yield curve. It represents the difference between the two lines on the bottom portion: the difference or "spread" between 10-yr and 2-yr Treasury yields. The spread is effectively a measure of the slope of the yield curve, which indeed is relatively flat compared to where it was several years ago. But it's not flat nor is it inverted; it is still positively-sloped, and that means the market believes the Fed is justified in saying it plans to increase rates modestly over the next year or so. The relative flatness of the yield curve is not saying that the Fed is tightening too much or threatening growth, it's best characterized as the market's way of saying that economic growth expectations are neither exciting nor worrisome. I explain this a bit more below.

Chart #2

Chart #2 is another way of looking at the yield curve—a better way, since it gives us some important additional information. The red line in Chart #2 is similar to the blue line in Chart #1, but the blue line in Chart #2 is the important addition: it shows the real, inflation-adjusted Fed funds rate, which is the overnight rate that the Fed targets. The Fed these days has absolute control over the nominal funds rate, while the rest of the nominal yield curve is essentially a projection of what the market thinks the funds rate will average over time. Any yield curve analysis worth its salt should measure not only the slope of the Treasury curve, but also consider the level of the real Fed funds rate.

The Fed doesn't just target the funds rate. What it really targets—but rarely talks about—is the real funds rate. Borrowing money at 5% when inflation is 1% is one thing, but borrowing money at 5% when inflation is 10% is quite another (the former means borrowing is expensive, the latter means borrowing money is a good way to make money). Real borrowing costs are what truly affect behavior. When money is very expensive—when real borrowing costs are high—people are discouraged from borrowing and spending and are encouraged to save money; eventually, if real rates are forced too high, economic activity suffers. That's been the proximate cause of every one of the recessions in the past 60 years.

One thing that stands out in Chart #2 is that the real funds rate has been negative for the past decade. Doomsayers think this means the Fed has been flooding the world with money, and the sky will soon be falling. Monetarists reason that, since we have seen neither a collapse of the dollar nor soaring inflation over the past decade, this can only mean one thing: the demand for short-term financial assets has been incredibly strong for many years (another way of saying that the market has been very risk averse for most of the past decade), and, moreover, the Fed hasn't artificially depressed interest rates, nor has it flooded the market with money no one wanted. The Fed has kept rates low because the demand for money has been strong. See this post (The Fed is not "printing money") from five years ago for more background.

Chart #2 actually has two messages: 1) an inverted yield curve is a good leading indicator of a recession, and 2) very high real short-term interest rates are also a good leading indicator of a recession. When both those conditions hold, that's when you need to worry about a recession. Today we're not even close to having to worry. Despite the Fed having raised its target funds rate six times in the past 18 months (from 0.25% to today's 1.75%), the real funds rate is still in negative territory (-0.18% as of March 31 by my calculations), because inflation over the past year has been almost 2%. The Fed has raised its target for the real funds rate because the market has grown less risk-averse and economic growth expectations have improved somewhat. The Fed hasn't "tightened" in the sense that it is trying to slow things down. The Fed is just following the market.

Chart #3

Chart #3 is important because it gives us information about the slope of the real, inflation-adjusted yield curve. Real yields are just as important, if not more so, than nominal yields. The blue line, the real funds rate, is ground zero for the real yield curve, while the red line, the real yield on 5-yr TIPS, is the market's estimate for what the real Fed funds rate will average over the next 5 years. Today, the front end of the real yield curve is positively sloped (i.e., the spread between the two lines is positive), and it has actually been steepening since last summer. The message: the market agrees with the Fed that short-term interest rates, in real terms, will need to rise in coming years. Not by a whole lot, but by enough to rule out the notion that the market and/or the Fed are nervous about the health of the economy. The time to worry is when the real yield curve becomes negatively-sloped, as happened before each of the past two recessions (i.e., when the blue line exceeds the red line, because that means the Fed has tightened too much).

Another reason the Fed needs to raise real rates is to boost the attractiveness of the $2 trillion of excess bank reserves held by the banking system. Failing to do so would decrease banks' desire to hold excess reserves, and that in turn would lead to excessive lending, too much money, a weaker dollar, and rising inflation.

Chart #4

Chart #5

Chart #4 uses real and nominal 5-yr yields to give us information about the market's inflation expectations. Despite the Fed having kept real short rates negative for 10 years, inflation expectations today are no different from what they have been in the past. As Chart #5 shows, the CPI ex-energy has been on a 2% growth path for the past 15 years, and inflation expectations today, based on 5-yr TIPS and Treasury yields, are about 2.1%. That is effectively proof that the Fed has not been printing money or distorting markets. In monetarist parlance, the Fed has managed to keep the supply of money pretty much in line with the demand for money, though not completely, because inflation has averaged about 1.6% per year for the past 10 years.

Chart #6

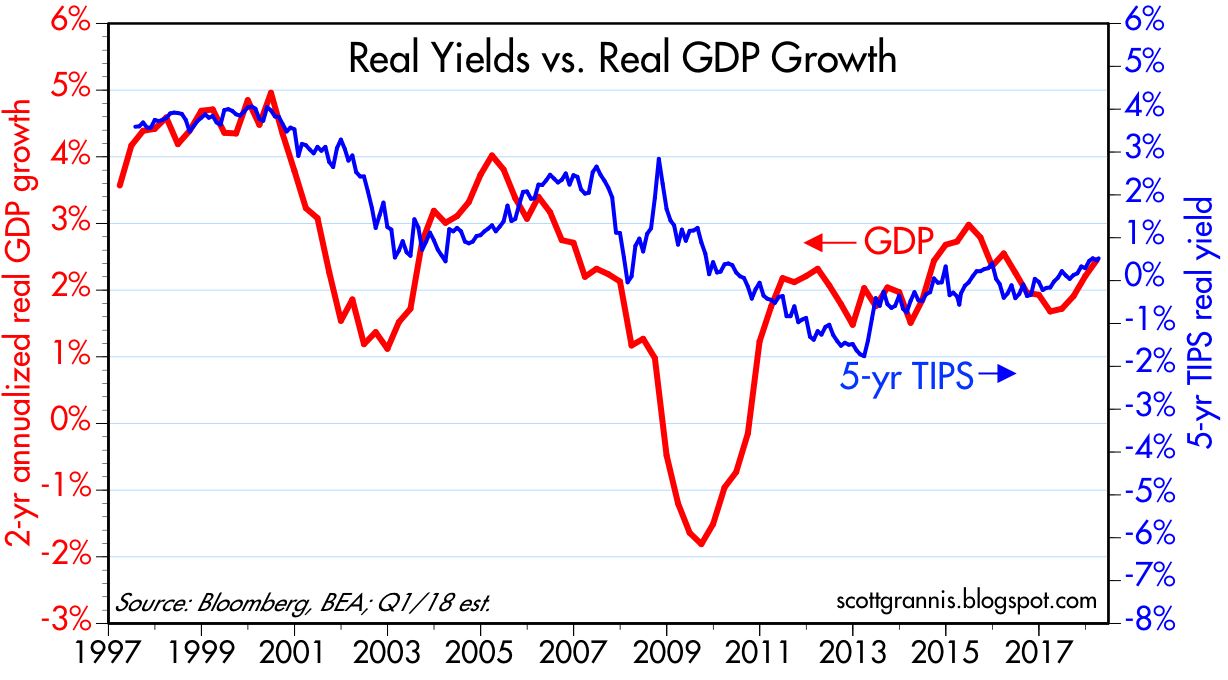
Chart #6 shows that real yields on TIPS also provide us with information about the market's GDP growth expectations. The level of real yields tends to track the level of real growth, and that is not surprising at all. A stronger economy implies higher real returns, and real yields should therefore rise in a faster-growing economy. Conversely, as economic growth weakens, as it did following 2000, real yields should fall. Currently, real yields of about 0.5% on 5-yr TIPS tell us that the market expects the economy is likely to grow about 2-2.5% per year, according to my reading of the bond market tea leaves.

If last year's tax reform results in a significant increase in economic growth, as I expect it will, then the Fed is going to have to guide real yields significantly higher as well. And that of course means significantly higher nominal yields, assuming inflation expectations remain "contained."

But for the time being, today's yield curve holds no threatening messages for the economy, and I think the market intuitively understands this.

What's worrisome today is not the yield curve, but the threat of a possible trade war with China and the ongoing tensions in the Middle East. The volatility that we are seeing is the result of the turbulence one would expect when headwinds (trade war risk, Middle East tensions) collide with tailwinds (last year's tax reform). For now, the market's judgment is that the two opposing forces effectively neutralize each other, with the result that growth is expected to be unimpressive, while inflation is expected to remain in the neighborhood of 2%.

Friday, April 19, 2019

Update on money demand, currently stable

(This is an updated and rewritten version of a post I wrote about seven months ago.)

I've mentioned the demand for money countless times in the 10-yr history of this blog because it's a very important and under-appreciated macro variable. The Fed controls the supply of money, but the demand for money is a function of a variety of factors, some of which are beyond the Fed's ability to control. The secret to any central bank's ability to deliver low and stable inflation is to keep the supply and demand for money in balance, even though it is difficult to track the demand for money without the benefit of hindsight. As Milton Friedman taught us, inflation is always and everywhere a monetary phenomenon; inflation results from an excess of money relative to the demand for it. It's that simple. Unfortunately, you don't see many people, including the Fed, talking about this, because it's not easy or straightforward. That's one of the things this blog tries to bring to the table.

From 2008 through the summer of 2017, the demand for money (which I define as the M2 money supply divided by nominal GDP) was in a pronounced uptrend, because M2 growth exceeded nominal GDP growth. This in turn was driven by a widespread desire on the part of individuals, investors, and corporations to increase their holdings of money relative to their incomes and as a share of their portfolio, which in turn was a natural reaction to the profound shock of the global financial crisis and the Great Recession of 2008-9. Everyone wanted the safety of money, and they wanted more of it.

During this same period of rising money demand, the Fed engineered an astounding and unprecedented increase in the monetary base, expanding its balance sheet by buying trillions of dollars of notes and bonds. The fact that inflation remained low (~1.5 - 2%) and relatively stable throughout this period can only mean that the Fed correctly responded to strong money demand by dramatically expanding the supply of money. Inflation was not a problem because the Fed kept the supply and demand for money in balance. 

The Fed was unfortunately a bit slow to react to the surge in money demand, but by late 2008 they adopted a radically new monetary policy which they dubbed Quantitative Easing (QE). Most people erroneously believed, and still believe, that the objective of QE was to stimulate the economy by printing money and otherwise making money cheap (i.e., by keeping interest rates artificially low). I have argued in numerous posts over the years that this was most definitely NOT the case. The purpose of QE was to accommodate the market's almost-insatiable demand for risk-free, liquid assets.

In the wake of the near-collapse of the global financial system, the world was desperate to acquire more T-bills, the gold standard for safe money. The demand for T-bills was so extreme that there were not enough in supply—in fact, the Fed was essentially forced to sell virtually all of its T-bill holdings in the first half of 2008 in an attempt to satisfy demand. Without enough safe and liquid securities to satisfy the demand for such, the financial system was in serious danger of imploding. The Fed solved this problem by buying trillions of dollars of notes and bonds and paying for them with bank reserves, which they also announced would for the first time ever begin to pay a risk-free rate of interest. (Bank reserves, crucially, are not "money" that can be spent like dollars can.) The banking system was happy to use their strong inflows of savings deposits to invest in and hold all these new bank reserves, which had suddenly become a valuable asset, being risk-free and interest-bearing, just like T-bills. Banks were risk-averse too, just like the general population. Bank reserves today are best thought of as T-bill equivalents.
Now, however, it makes sense for the Fed to reverse the QE process at least in part, because the crisis of confidence has begun to reverse, risk aversion has begun to fade, and the demand for money appears to have stabilized, at least for now. The Fed already has reversed some of its QE, by reducing excess reserves from a high of $2.7 trillion in 2014 to now $1.5 trillion. In fact, if the Fed had NOT reversed at least some of its QE, they would have run the serious risk of allowing there to be too much money relative to the demand for it, and that would have led to a destabilization/devaluation of the dollar and an unwanted rise in inflation.

If the demand for money weakens from its current level, as it likely would if confidence rises and economic growth remains healthy, then the Fed will be justified in further reducing the size of its balance sheet and raising its short-term interest rate target. And while the market may fret again about rising rates, it needn't be problematic if rising rates are tied to rising confidence, and declining risk aversion.

As always, here are charts that provide the evidence for my story:

Chart #1


The M2 measure of money supply is considered by most economists to be the best measure of "money." As Chart #1 shows, M2 consists of currency, checking accounts, bank savings deposits, and retail money market funds, all of which are liquid, safe, and easy to spend. The largest component by far is bank savings deposits, which grew from $4 trillion at the end of 2008 to now $9.4 trillion. In fact, the growth of savings deposits far outstripped the demand for the other components of M2: savings deposits were about 50% of M2 at the end of 2008, and now they are almost 65%. This is significant, because until 2017 bank savings deposits paid almost nothing in the way of interest, yet people were happy to increase their savings deposits because they offered safety and liquidity. Bank savings deposits in an era of zero interest rates were thus an excellent measure of money demand. 

Chart #2

As Chart #2 shows, the growth rate of bank savings deposits has slowed significantly in the past two years, beginning in early 2017, despite the fact that banks have increased—albeit slowly—the rate they pay on savings accounts over this same period. Prior to 2017, the rate on savings accounts was essentially zero, whereas now most banks are paying around 2%. That's significant: savings accounts on the surface have become more attractive (because they pay a higher rate of interest), yet demand for them has weakened. Why? Because risk aversion is declining and confidence has improved. In other words, slower growth in bank savings deposits today is a direct reflection of a decline in money demand.

It's noteworthy that the big decline of money demand in 2017 coincided with a surge in equity prices. People wanted less money, and they evidently wanted to put some of their money to work in the stock market. Money demand has been flat for the past year or so, so it's not surprising that equity prices have yet to meaningfully exceed their 2017 highs. (See Chart #9 below for a detailed look at equity prices in recent years.)

Chart #3

As Chart #3 shows, it's not just the demand for savings deposits that has declined—the growth rate of the larger M2 measure of money has also declined. M2 currently is growing at a 3-4% annual rate, which is meanin agfully less than the 6.5% annualized rate which has prevailed for most of the past several decades.

Chart #4

As Chart #4 shows, the growth rate of nominal GDP (shown in the blue bars) has picked up a bit in the past few years. Meanwhile, as Chart #3 shows, the growth in M2 has declined. This means that people are unwinding their holdings of cash. Since money can't disappear without help from the Fed (i.e., tight monetary policy), the only way that we collectively can reduce our money balances is by pushing up the price and the volume of transactions of everything else.

Chart #5

Chart #5 is the main exhibit, and it shows the ratio of M2 to nominal GDP. To understand this chart, think of M2 as a proxy for the amount of cash (or cash equivalents) that the average person, company, or investor wants to hold at any given time. Think of GDP as a proxy for the average person's annual income. The ratio of the two is therefore a proxy for the percentage of the average person's or corporation's annual income that is desired to be held in safe and relatively liquid form (i.e., cash or cash equivalents). In times of uncertainty, it stands to reason that most people would want to hold more of their assets in cash, and in times of optimism they would want to hold less.

The demand for money appears to have peaked in the summer of 2017, after rising strongly for the previous decade. Money demand has since fallen a bit, and that is good evidence that risk aversion and caution are slowly giving way to increased risk-seeking. The last two data points in this chart are Q4/18 and Q1/19, the latter of which I've estimated using known data for M2 growth (currently running at a 3-4% rate) and the market's current estimate for nominal GDP, which is roughly 4%. Money demand didn't change much last quarter, which I view as a function of the severe downdraft in equity prices that occurred late last year, which in turn was driven by concerns that the Fed might over-tighten monetary policy.

Going forward, however, I suspect that money demand will resume its decline, since the economic and financial fundamentals remain healthy. If this trend continues, it has profound implications for future economic growth and the conduct of monetary policy.

I believe that, beginning one year or so ago, the dominant narrative switched from one in which people were willing to pay up for safety and liquidity (by accumulating cash) to now one in which the average person (or company, or investment manager) on the margin wants to reduce their holdings of "money" in favor of increasing their holdings of risky assets or just spending it. I think that narrative remains the operative one that will continue, barring, of course, unforeseen disasters.

Chart #6

So it will be very important to monitor consumer confidence, among others. As Chart #6 shows, consumer confidence surged beginning in late 2016 (not coincidentally this was shortly after Trump's election). With increased optimism naturally comes a reduced desire to accumulate cash, and an increased desire to spend money and/or invest it. The rise in confidence was interrupted late last year however, and that is why economic growth in the first quarter of this year was almost certainly mediocre. 

This all has important implications for the Fed, because the Fed will need to take actions to offset the decline in the demand for money, or else it will risk igniting an unwanted increase in inflation. The Fed will need to raise short-term interest rates, and probably by more than the market currently expects (higher short-term rates have the effect of making savings deposits more attractive, thus counteracting the declining demand for same). The Fed will also need to resume the reduction in its balance sheet in order to reduce the supply of bank reserves as banks' demand for those reserves declines. This may cause the market consternation, but it will be exactly what is needed to ensure continued low and stable inflation and in turn a strong economy.

Chart #7

Chart #8

Chart #9

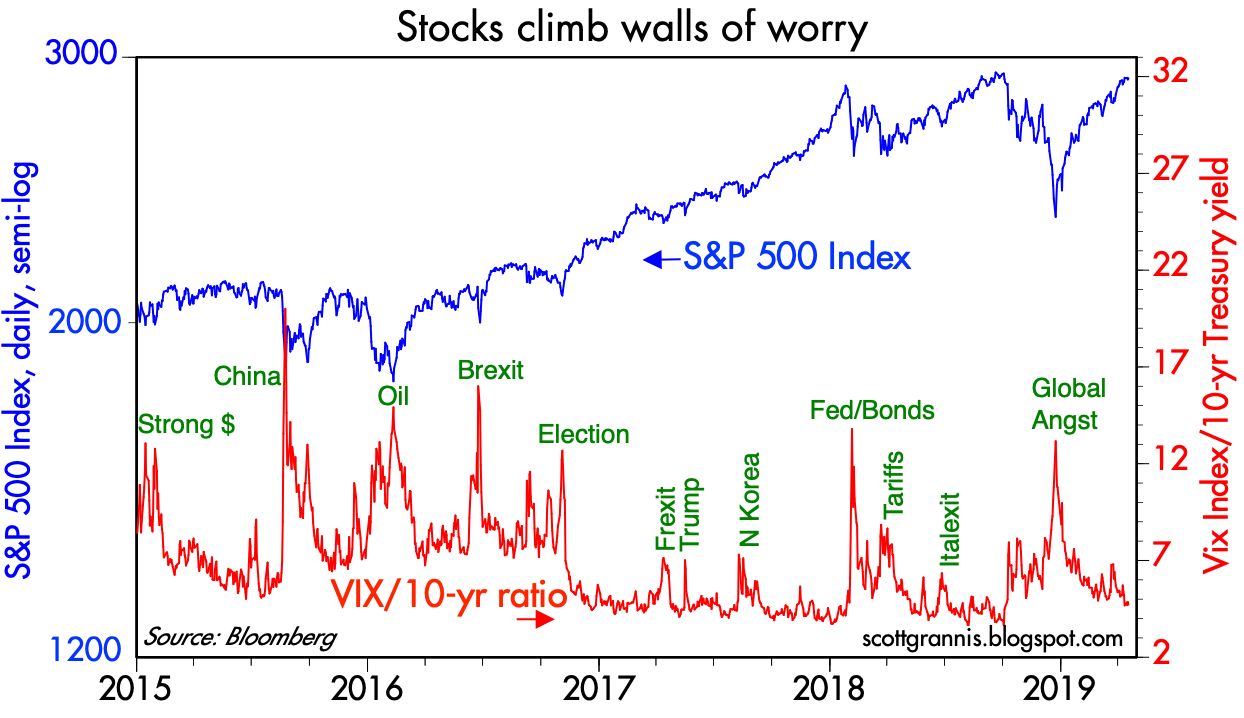
For now, things look fairly stable. Money demand and money supply are likely in balance. The economy is growing at a modest/moderate pace, and few expect that to change. Real and nominal interest rates are priced to the expectation that economic growth will be 2.5% (see Chart #7) and inflation will be about 2% for the foreseeable future (see Chart #8). Fear, uncertainty and doubt have fallen almost to normal levels (see Chart #9), and the bear market of late last year has been reversed. But a resumption in the decline of the demand for money, which would likely accompany a pickup in confidence and stronger growth, would change that dynamic, and almost certainly result in higher-than-currently-expected interest rates and higher equity prices.