Showing posts sorted by relevance for query "borrow and buy". Sort by date Show all posts

Friday, September 18, 2020

A few charts and thoughts on the election

From time to time I update a chart or make a new one, and I realize it is worthy of highlighting. But then I delay posting it, looking for some broader theme to tie it too. I invariably regret doing that, so here is a short post with just 4 charts and some brief comments.

Chart #1

Chart #2

A few days ago the Census Bureau released its calculation of Median Household Income for 2019. As Chart #1 shows, this measure of prosperity increased at a historically significant rate. It rose a record-setting 8.7% from 2018 in nominal terms, and 7% in real terms, the latter being shown in Chart #2. Trump can claim credit for much of this, given his significant tax cuts and regulatory reform which began to take effect in 2018. 

It's arguable, of course, but I think Biden's agenda, which calls for significant tax hikes across the board, as well as an environmental agenda that would involve huge costs, economic turmoil (you don't easily get rid of an addiction to fossil fuels), and re-regulation (especially of the labor market), would be a drag on growth. Biden's agenda is anti-growth and anti-business, in the belief that addressing income inequality, social justice, and global warming are paramount.

UPDATE: Mark Perry's recent post on this same subject makes an important point I overlooked. Since the size of the median family has decreased steadily for the past several decades, if this data is adjusted for household size, by measuring income per member of the median household, the increase in median income growth has been much greater than my charts show: "the percent increase in median household income per household member since 1967 of 86.6% is almost exactly twice the percent increase in real median household income over the last half-century of 43.3%."

Chart #3

Chart #3 shows a huge, record-setting increase in homebuilder sentiment, which in turn foreshadows a significant pickup in housing starts. It's no secret that historically low mortgage rates have been a boon to the housing market and home construction, as well as to consumer sentiment. Who couldn't love sub-3% mortgage rates? 

Mortgage rates are low because the 10-yr Treasury yield, currently only 0.7%, is at levels once that though impossibly low, and the 10-yr is the primary driver of mortgage rates. And Treasury yields are low not because the Fed is promising to keep short-term rates near zero for the next 2-3 years, but because investors the world over are desperately demanding safety and security. The Fed is keeping rates low because it is forced to accommodate the world's huge demand for safe assets. On the bright side, the wave of risk aversion that has carried Treasury yields to unbelievably low levels is helping to generate a wave of new willingness to invest in homes as well as many other hard and financial assets. Remember, the new meme that the Fed is promoting is "Borrow and Buy," as I have noted in recent posts. When interest rates are super-low, it pays to borrow, and it pays to buy almost anything that will eventually benefit from renewed growth and—possibly—higher inflation.

Chart #4

On a less promising note, Chart #4 shows that passenger air traffic, which a few weeks ago was picking up (Labor Day holiday-related) has now resumed its flat trend. This detracts from the otherwise V-shaped recovery narrative that we have seen in housing, employment, industrial production, and retail sales. I think the economy will continue to improve at a relatively fast pace, but it's not yet gangbusters.

For all the promise of renewed growth, it remains the case that this year's gargantuan government spending and income redistribution will be a serious drag on growth for the foreseeable future. By borrowing many trillions, the government has commandeered a significant portion of the economy's resources and redirected those resources in ways which are very likely not as efficient as if those resources had been left in the hands of the private sector. Government can never spend other people's money as wisely and as efficiently as people can spend their own money, to paraphrase the great Milton Friedman.

From my supply-side perspective, the most important things to watch are confidence, employment, investment, and incentives to work and invest, all of which drive supply. Supply, as supply-siders believe, creates its own demand. Investment, production, and risk-taking are what deliver productivity, and productivity, coupled with more people and more work, is what delivers growth and prosperity. Spending follows production and growth; spending is not what drives the economy. 

Paying extra-generous unemployment benefits surely (and justly) helps those who were on the wrong side of government-mandated shutdowns, and it helps sustain consumption. But in the end it is harmful to the overall economy. There is no free lunch. It is increasingly clear that, as I predicted last April, government-ordered shutdowns were a catastrophic mistake, since nowhere in the world have they managed to derail the spread and devastation of the Covid virus, while in every case they have been hugely expensive and economically destructive to the lives and businesses of countless millions.

Supply-siders, as well as conservatives generally, believe that free markets and individual freedom are what create the fertile ground in which growth prospers. Modern-day liberals (as opposed to traditional liberals) believe that government actions (income redistribution, subsidies, price controls, regulations, industrial policies) are the main drivers of growth. Conservatives put their trust in individuals and businesses; liberals put their trust in government. You are free to choose, especially in the upcoming elections.

UPDATE (9/19/20): Mark Perry has a very interesting post on the demographics behind the household median income data. Excerpt:

It’s highly likely that most of today’s high-income, college-educated, married Americans who are now in their peak earning years were in a lower-income quintile in their prior younger years when they were single and before they acquired education and job experience. It’s also likely that individuals in today’s top income quintiles will move back down to a lower-income quintile in the future during their retirement years, which is just part of the natural dynamic lifetime cycle of moving up and down the income quintiles for a majority of Americans. So when [we hear] the incessant chatter from the mainstream media and progressive politicians about an “income inequality crisis” in America, we should keep in mind that basic household demographics go a long way towards explaining the differences in household income in the United States. And because the key income-determining demographic variables are largely under our control and change dynamically over our lifetimes, income mobility and the American dream are still “alive and well” in the US.

Sunday, August 30, 2020

The virus, the elections, and the Fed


I haven't made a post for over three weeks. If there's a reason, it stems from the uncertainty created by the unprecedented economic collapses suffered by most of the world's economies—in turn the product of the most colossal public policy errors in the history of mankind, all for a virus that is equivalent to a bad flu—coupled with the radically different public policy prescriptions of our two presidential candidates and now magnified by the Federal Reserve's recent decision to adopt a radical change in its policy focus. And to think that, despite all this, equity prices are making new all-time highs and interest rates are marking all-time lows. 2020 really does deserve to go down in history as the Crazy Year.

I can only offer some observations which may be of help to investors trying to sort out what this all means. I'm an inveterate optimist, but even so I am humbled by the task of trying to make sense of all this. For what they are worth, here follow some observations.

I can't argue that the market is over-extended, but neither can I argue that the market is too pessimistic (which long-time readers will know is my favored habitat). Current PE ratios are historically high, but forward-looking PE ratios are only moderately elevated. That's not all that strange given the extremely low level of interest rates.

The elephant in the living room these days is the November elections. There couldn't be a starker contrast between Biden and Trump. Biden's policies would undoubtedly be bad for the economy (e.g., sharply higher tax rates and much more regulation), while Trump's would be good (lower tax rates and more deregulation). Trump brings a lot of character baggage to the race, but his accomplishments (e.g., lower taxes, deregulation, strong-arming NATO allies, getting tough on China, winding down wars instead of starting new ones) remind me that the only way to understand Trump is to pay no attention to what he says or tweets, but instead to simply focus on what he does. Biden, on the other hand is a nice, decent guy, with few if any major accomplishments to his credit, but displaying all the signs of an elder politician that is way past his prime and bordering on senility. His worst decision ever could prove to be his selection of Kamala Harris as VP, since she is a socialist at heart and a policy lightweight yet would very likely succeed Biden before his term is over. Imagine our lives if and when BLM has a friend in the White House. Since the polls still favor Biden but the market behaves as if Trump will win, I can only conclude that great downside risk lies ahead should Biden prevail.

So now we turn to the charts and what they tell us about what's going on in the economy and the markets.

Chart #1

It's been a wild and crazy ride in stocks this year, with fear being the source of nearly all the volatility, as Chart #1 shows. Since the end of 2017, the annualized total return of the S&P 500 has been 12.9%. Whether that's adequate compensation for all the nerve-wracking twists and turns along the way, I'll leave it up to each individual to decide. And as the chart also shows, the level of nervousness (as reflected in the Vix index) is still somewhat elevated.

The main source of recent fears has been a lowly virus, fear of which convinced nearly every politician in the world to shut down their economies in unprecedented fashion. As I've noted repeatedly for many months, "The decision to shut down the US economy will prove to be the most expensive self-inflicted injury in the history of mankind.™" It probably sounded foolish at the time I first said it way back in early April, but it's rapidly becoming accepted wisdom as more and more countries tally up the damage while also realizing that it's tough—if not impossible—for anyone to show any correlation between lockdowns and the eventual course of the pandemic. In fact, the anti-lockdown Sweden probably made the best decision of all: its deaths per capita are in the same ballpark as other major countries, but its economy has fared far better.

Chart #2

As Chart #2 shows, the US economy shrank at a 19.4% annualized pace in the first half of this year, with the worst of that coming in the second quarter, when GDP shrank at a 34% annualized pace. In level terms, real GDP fell by $2.26 trillion, a decline of 10.4%. In Europe it was much worse, with real GDP falling 15.2%; that decline sent the Eurozone economy back to levels last seen 15 years ago. The US economy, in contrast, was only set back a little over 5 years. Regardless, nothing even remotely similar has occurred in such a short period in recorded history. 

Chart #3

Despite all the economic and psychological devastation, some sectors of the economy have rebounded strongly. As Chart #3 shows, the residential construction industry as of last July is almost back to its pre-crash levels, and housing prices are now making new all-time highs.

Chart #4

As I've noticed while driving the freeways of Los Angeles lately, traffic is still somewhat light, but it has improved dramatically from April's lows. Chart #4 shows how motor gasoline supply has rebounded strongly in recent months, and that is as good a proxy for miles travelled as you're likely to find.

Chart #5

However, as Chart #5 shows, while the airline industry rebounded rather quickly through the end of June, since then growth has stalled. (TSA traveler checks are an excellent proxy for total air travel.) Air travel today is running about 70% below the levels that prevailed a year ago. Airlines have been hammered.

Chart #6

So the economy is definitely on the mend, but not uniformly. Unemployment remains extraordinarily high (10.2% as of last month), down from a mind-numbing high of 14.7%. Driving is almost back to normal, but air travel is still way below normal. Housing is practically on fire. Throughout all this, the Fed has reacted in extraordinary fashion—thank goodness—by reducing interest rates to near-zero and expanding bank reserves by $1.25 trillion (see Chart #6).

Chart #7

The Fed needed to greatly expand banking system liquidity in order to accommodate the huge increase in the demand for money, as shown in Chart #7. Think of this chart as showing how much cash the average person or business wants to hold as a percent of their annual income. Money demand has soared to previously unimaginable levels as the economy shrunk and tens of millions lost their jobs. People were desperate for the safety of cash because the virus and governments' response to it had put us into uncharted and frightful territory.

Chart #8

Chart #9

Everyone scrambled for safe havens. Bank checking and savings deposits exploded (see Chart #9). As Chart #8 shows, the price of gold and TIPS soared, a direct reflection of the demand for safety. But as Chart #9 also suggests, we have probably seen the peak of the demand for money and safety. 


Chart #10

Vaccines are on the horizon, therapeutics are hitting the market, confidence is slowly returning, and in most of the world we are seeing a definite and very welcome slowdown in the growth rate of new deaths (see Chart #10). 

So the economy and nerves are on the mend, albeit slowly and nervously. But we're not out of the woods by any stretch, with the biggest unknown being the future of monetary policy. The Fed recently announced a landmark shift in its policy-making. Instead of preemptively fighting inflation, the Fed is now hoping to see inflation rise. How exactly will this play out? No one has the slightest idea. 

I have always been an advocate of very low and preferably zero inflation. From my years of experience in Argentina I know first-hand how inflation distorts an economy and business decision-making, and how it ruins the lives of nearly everyone. Not many realize that the biggest victims of inflation are those who are least able to protect themselves from it: the poor, the uneducated, and the old. Already we can quantify the losses accruing to anyone these days who is holding large amounts of cash or cash equivalents (e.g., currency in circulation which totals  almost $2 trillion, and bank savings deposits which now total a gargantuan $11.6 trillion). This simple measure of "cash" is equivalent to almost 70% of GDP, and it pays almost nothing in interest. Ex-energy inflation is already running about 2% a year, so those holding cash and cash equivalents are suffering annual losses of roughly $270 billion in terms of purchasing power (2% of $13.6T). And its likely to get worse, since the Fed has all but guaranteed that short-term interest rates will remain very low for the foreseeable future while they also hope that inflation rises.

Chart #11

Even the smartest of investors can't escape the ongoing loss of purchasing power for holding cash, cash equivalents, and Treasury notes. Real short-term interest rates (available through investments in TIPS) are strongly negative. You can have the security of a 5-yr Treasury note, but you are guaranteed to lose almost 1.5% per year in the purchasing power of your investment. Yikes. And by the way, interest rates are extremely low for two reasons: 1) the demand for short-term, safe securities is intense (which causes their prices to be extremely high and their yield to be therefore exceedingly low), and 2) the Fed is promising to keep its Fed funds reference rate close to zero for the foreseeable future. 

Chart #11 shows the history of nominal and real rates on 5-yr Treasury notes, and the difference between the two, which is the market's implied expectation of future inflation (currently about 1.7% per year for the next 5 years). 

Chart #12

Chart #12 compares the ex-post real yield on Fed funds (blue) with the market's expection for what the real funds rate will average over the next 5 years (red). Both are hugging -1.5% per year. Nobody thinks rates are going to rise from their very negative real levels for many years. That thinking is driven by a combination of 1) pessimism over the economy's long-term growth prospects and 2) a belief that the Fed will deliver on its current promises to keep rates low for a long time.

But here is the real story: by promising to hold interest rates at today's rock-bottom levels for an extended period, the Fed is trying hard to discourage people from holding cash and short-term investments. The Fed wants you to spend that money instead, and it would also like you to borrow money instead of save it. The new mantra is "borrow and buy."

It shouldn't take long for people to begin to figure this out. In fact, many already have, as we'll see in the following charts.

Chart #13

As Chart #13 shows, the level of the dollar's value vis a vis other major currencies (blue) is inversely correlated to the price of gold. A weaker dollar typically leads to rising gold, and vice versa. The recent rise in gold has probably been driven by the expectation that the Fed would seek to weaken the dollar (by increasing inflation, which erodes the value of the dollar). Gold is now back to its all-time highs in inflation-adjusted terms. If this interpretation of gold is correct, then it's too late to buy gold as an inflation hedge. What the gold market expected (a very easy Fed has already happened.

Chart #14

We see the same dynamic with copper prices (Chart #14) and for most commodities as well, except that most commodities (with the exception of gold) are only now just beginning to react to a weaker dollar. Of course, rising copper prices may also be symptomatic of a stronger global economy. But if the global economy continues to improve and rising inflation begins to take hold, copper prices would likely have plenty of upside potential.

Chart #15


Chart #15 shows the stunning increase in lumber prices in the past several months. This likely reflects at least in part the robust conditions in housing construction that we saw in Chart #3. On the other hand, strong demand for housing could be due to people figuring out that in a rising inflation environment, real estate tends to do well—as do most all real assets. And it's part and parcel of today's ultra-low interest rate environment, which makes it cheap to borrow. Without saying it directly, the Fed is encouraging people to borrow and buy. The Fed is keeping interest rates low in order to reduce the attractiveness of holding money. There are two ways you can reduce your money holdings: either by borrowing money or by using your money to buy stuff. Both are now being observed in the wild. The seeds of rising inflation have been sown, but the fruits won't be seen in the official inflation statistics for awhile.

Unless, of course, the Fed is able to react to a declining demand for money by withdrawing the bank reserves which it has recently injected. What are the chances they can withdraw trillions of dollars of new reserves at just the right time to avoid unwanted and unexpected inflation? It's anybody's guess, but the stakes have never been higher.

Chart #16

Ultra-low interest rates on cash equivalents and short-term securities also encourage people to buy other types of assets. Chart #16 shows the current yields on selected sector investments. In order to find a yield higher than the Fed's 2% inflation target, you need to look at things like lower-quality corporate bonds, REITS, and emerging market debt. Stocks too offer attractive yields, with the S&P 500 currently showing an earnings yield of 3.66% (the inverse of its current 27.3 PE ratio). Stocks, in other words, are benefiting from very low interest rates. In a new age of near-zero interest rates, PE ratios of 27 may seem high from an historical perspective, but in actuality they could well be seen as attractive. And in any event, PE ratios based on 1-yr forward earnings expectations today are only 21.2. It's not obvious that stocks are over-extended at today's prices.

Chart #17

Inflation expectations have picked up a bit in recent months (see Chart #11), but they are still well within normal ranges. Likewise, the yield curve has steepened a bit (see Chart #17), but it is still relatively flat from an historical perspective. The bond market appears to be in the very early stages of anticipating rising inflation and an eventual Fed tightening. There is lots of room left in this trade.

As for Covid:

The three charts below come courtesy of Brian Wesbury at First Trust. In the first, we see that Covid deaths occur overwhelmingly among people 65 and older (gulp, that includes me!). Unfortunately, the MSM have utterly failed to communicate this effectively to the population. As a result, the country has been swept up by a pathological paranoia that has resulted in, among other bizarre behaviors, young people wearing masks outdoors even when walking alone or riding a bike. In the second we see how dramatic the decline in hospitalizations has been in states previously categorized as "hot spots." The third chart is welcome news of a quick-and-easy Covid antigen test which is just around the corner.

.


Finally, I recommend this 7-minute video ("Shut up and put on your mask") from Graco. In support of its thesis, I recommend this summary of a recent NBER study that found that lockdowns and mask mandates do NOT lead to reduced Covid transmission rates or deaths. All they succeed in doing is to destroy economies and lives, while handing immense power to public officials who have trampled the civil and constitutional rights of billions of individuals by making decisions not supported by facts. Thus, a very dangerous precedent has been set that poses significant risks to economies and the general well-being of the entire planet in the years to come.

If you want to really worry, this is where you should place your chips. Think of a mask mandate as the first step on a slippery slope to despotism and socialism. We are not "all in this together;" our leaders are not more intelligent than a market of billions of individuals. Kamala Harris, I do not need you to tell me what to wear and what to think.

Wednesday, October 13, 2021

Monetary policy is a slow-motion train wreck


There is no shortage of things to worry about. 

That's a phrase I have used several times over the past decade. I used it as a foil to argue that since the market was quite cautious (and nervous), then a surprise downturn or selloff wasn't a serious risk. Recessions usually happen when nearly everyone is feeling optimistic. Today there again is no shortage of things to worry about, and the market is within inches of its all-time high. Most disturbing, however, is that neither the Fed nor the administration nor Congress nor the bond market are very worried about inflation. Inflation and all its nasty consequences are, arguably, big things to worry about today.

Fed policy, as laid out in today's FOMC minutes, is amazingly blasé about the risks of higher inflation. The Fed currently plans to begin "tapering" its purchases of Treasuries and mortgages sometime next month, and to finish tapering by mid-2022. That's not a tightening of monetary policy; it's only making policy less accommodative over a prolonged period. Actual tightening—which would consist of draining reserves (i.e., selling bonds) and/or raising the interest rate it pays on reserves (i.e., higher short-term interest rates)—won't begin until sometime late next year. 

The market has apparently agreed that this is a sensible course of action. Inflation expectations embedded in bond prices are somewhat high, but still a relatively tame 2.75% per year (average) over the next 5 years. The bond market is currently pricing in one or two 25 bps "tightenings" by the end of next year (i.e., short-term interest rates of roughly 0.4% to 0.5%), and a 1.5% fed funds rate 3 years from now. By any standard, that would be a supremely gradual pace of monetary tightening. But at a time when inflation is at levels not seen in over 30 years? 

This is almost certainly an unsustainable situation. The Fed and the bond market are almost certainly underestimating the risks of higher-than-expected inflation. 

How do I know this? It's all about incentives. Today, the incentives to borrow are huge. Short-term interest rates are below the current level of inflation and will likely remain so for at least the next year. (Even 30-yr fixed rate mortgages are lower than the rate of inflation.) Smart investors and consumers won't find it hard to arbitrage these variables. In fact, the process is already underway. You simply borrow money and buy anything that is a productive asset and which also has roots in the nominal economy (e.g., commodities, equities, farms, factories, cars). Leverage is your friend and ally in a high-inflation, low-interest-rate world.

How does one place a bet on an asset (in this case the dollar) that is expected to decline in value (because of inflation eroding its purchasing power)? You sell it if you own it, or you sell it short (you borrow it and then sell it). You buy it back when inflation settles back down and/or interest rates rise to a level that is greater than inflation. One way to "short" the dollar is to simply borrow dollars. And a common way to do that is to get a loan from a bank. And when the bank lends you money, the bank can actually create the money it lends you, which in turn expands the money supply. Banks are uniquely able to create money, provided they have sufficient reserves on hand to collateralize their deposits. Since the banking system currently has upwards of $3 trillion in "excess" reserves, thanks to the Fed's gargantuan purchases of notes and bonds, banks have an almost unlimited ability to increase their lending.

So it's not surprising that the M2 money supply has expanded at an unprecedented rate over the past 18 months, a time in which the Fed has bought almost $3 trillion of notes and bonds and bank deposits have swelled by some $5 trillion. And it's also not surprising that in the past six months consumer price inflation has posted a 6-7% annualized rate of growth—a rate last seen in late 1990. 

As for Biden, his approval rating is now down to an abysmal 38%. His administration has committed a series of blunders, most notably with the Afghanistan withdrawal. His top priority now is to pass two bills chock full of new social spending and new taxes which he preposterously claims will cost the economy "zero." Meanwhile, inflation has risen to multi-decade highs, yet both the administration and the Fed keep insisting it's just transitory. Things will almost certainly get worse if trillions of new taxes and spending, additional layers of bureaucracy, and hundreds of billions of dollars of new handouts and subsidies get lavished on the middle class. My good friend and talented artist Nuni Cademartori sums it up in this cartoon:


As the battle in Congress over Biden's "Build Back Better" agenda rages, I would urge everyone who thinks this agenda will actually help the economy grow and prosper to read the recently released study by the Texas Public Policy Foundation in collaboration with my good friend, Steve Moore of the Committee to Unleash Prosperity.

The key findings:

• The cost of the Biden Build Back Better plan spread across two bills will reach $6.2 trillion over the next decade.

• The higher tax rates on corporate income, small business income, capital gains, and so on will raise the cost of capital and reduce national investment and the capital stock.

• Compared to baseline growth, the negative impact of these taxes over the next decade will result in 5.3 million fewer jobs, $3.7 trillion less in GDP, $1.2 trillion less in income, and $4.5 trillion in new debt.

While I'm on the subject of Steve Moore, whom I've known since the mid-1980s, I will once again recommend you read and subscribe to the Committee to Unleash Prosperity's free daily newsletter. I read it every day, as do more than 100,000 citizens and Washington policymakers. (One of his recent issues featured Nuni's cartoon, and another featured some of my recent charts.)

In the study mentioned above you will find details on a plethora of Biden's tax proposals (e.g., a 12.5% payroll tax on all income over $400K, a reduction in the estate tax exemption of $8 million, and an increase in the top marginal tax rate to 65%) and their likely negative impact on the economy and employment. It's frightening to think that the people who came up with these proposals apparently believe that the overall impact of BBB will be stimulative. Have they no common sense? Here's a fundamental supply-side truth: when you tax productive activity and success more, you will get less of it. And when the government borrows trillions only to redistribute the money to favored groups and industries, you get a weaker, less efficient economy. And you also risk boosting already-high inflation.

I'll wrap things up with some updated charts and commentary:

Chart #1

Nothing illustrates better the supply-chain bottlenecks that currently plague the global economy than Chart #1. Used car prices have literally skyrocketed; in inflation-adjusted terms, used car prices are higher than they have ever been. In nominal terms they are up over 50% since March '20. 

Chart #2

Chart #2 shows how almost half of small businesses in the US report paying higher prices. The last time this occurred was in the 1970s. It's hard to escape a higher inflation deja vu conclusion.

Chart #3

As Chart #3 shows, bank reserves are very near their all-time high. The vast majority of these reserves are "excess" reserves, meaning they are not required to collateralize bank deposits. Banks thus have enough reserves on hand to collateralize an ungodly increase in deposits via new lending (i.e, money creation). If the Fed doesn't increase the interest rate it pays on these reserves by enough to make them more attractive, on a risk-adjusted basis, than the interest rate banks can expect to earn on new lending, bank lending will surely continue to expand, and that will fuel a prolonged expansion of the money supply and ever-higher inflation. 

Chart #4

Chart #4 shows the 6-mo. annualized rate of growth of the CPI (including the ex-energy version). I think this is a fair way to measure what's happening now, since we are well past all the distortions of last year and the turmoil earlier this year. Inflation by this measure hasn't been this high since late 1990. 

Chart #5

Chart #5 compares the year over year growth in the CPI (I'm being conservative with this) to the level of 5-yr Treasury yields. Yields haven't been this low relative to inflation since the 1970s. Recall what happened back then: millions of households made a fortune borrowing money at fixed rates and buying houses. Negative real interest rates cannot be sustained for long, mainly because of the incentives they create to borrow and buy. 

Chart #6

Chart #6 is an updated version of the one featured in Steve Moore's newsletter. It's important to note that the multi-decade trend rate of M2 growth is 6-7% per year. This has been blown away in the past 18 months. If the public tires of holding $3.8 trillion more in bank deposits than they normally would at this time, that's a tsunami of money that could float higher prices for nearly everything in the next year or so. It's also worth noting that M2 has been growing at a 10-11% annualized rate so far this year. 

What worries me the most right now is how this all sorts out. The Fed seems determined to avoid even the semblance of tightening for the next 12 months. Yet if inflation turns out to not be transitory as they currently expect, how long will it be before policy becomes tight enough to threaten the economy's health?

Chart #7

Chart #7 provides some historical context which may help answer that question. Note that every recession on this chart (shaded bars), with the exception of the last, was preceded by 1) a flat or negatively-sloped Treasury yield curve, and 2) a very high real Fed funds rate. Both of those conditions confirm the existence of very tight monetary policy that was intended to keep inflation pressures at bay. Neither condition is in place today, however, which strongly suggests that monetary policy poses no threat to the economy at this time.

Past Fed tightenings, however, were different from what a tightening would look like today. To really tighten policy, the Fed would have to 1) start raising the interest rate it pays on reserves, and 2) start draining reserves by selling bonds. It might take years to get rid of all the excess reserves, however, and no one knows for sure how the economy will respond to higher short-term rates in the presence of abundant reserves—that's never happened before. In the past, the Fed simply drained reserves until they were in such short supply that the banks were willing to pay ever-higher interest rates in order to acquire enough of them to collateralize their deposits. A scarcity of reserves led to a liquidity shortage, and high real borrowing costs led to bankruptcies and weak investment. Eventually, economic growth ceased, and the inflation cycle was broken. 

The dilemma for investors: we might be years away from a return to these conditions, so selling risky assets right now might be premature. And, by the way, holding cash is a guaranteed way to lose money. But how long can you wait, knowing that another economic collapse looms on the horizon? 

In the meantime, the prospects for Biden's Build Back Better lollapaloosa are declining by the day, thankfully, and the spreading disarray in Washington only makes that more likely. I'm willing to bet that if any of his bills survive, it will be in greatly reduced form, and thus much less damaging to the economy. Just letting the economy sort things out on its own would be a great relief to everyone, in my view.

Nobody said investing was easy. There are a lot of things to worry about these days. But I wouldn't panic just yet. The next year or so might be likened to watching a train wreck in slow motion.

Monday, September 14, 2009

Market expects an easier Fed, despite signs of recovery


This chart shows the market's expectations for where 3-month Libor will be trading in September 2010. By subtracting 30 bps you get the approximate level of the market's expectations for the Fed funds rate over time; currently the market is expecting the funds rate to be about 1.0% a year from now. What strikes me about this chart is that short-term interest rate expectations have dropped  since the end of last year—the yield on the Sep '10 contract has declined from 1.9% then to 1.3% today—despite all the obvious signs of an economic recovery that have since emerged. This is one more example of the dichotomy that I mentioned in my post last Tuesday. Some things—like T-bond yields and short-term interest rate expectations—seem to be priced to a very dismal economic outlook and/or low inflation, while other things—like copper prices, gold prices, a weaker dollar, and swap spreads—reflect strength and a portent of rising inflation.

What follows is my attempt to explain how this all fits together.

At the end of last year the mood of the market was extremely pessimistic, fearing a combination of depression and deflation that would be more terrible than what happened in the 1930s. Since then, the Fed has taken extremely aggressive steps to eliminate the threat of deflation, with the result that monetary policy is now far easier than anyone could have imagined late last year. In addition, the Fed has taken pains to assure the market that policy will remain accommodative for a long time. Fed governors feel comfortable in projecting an extended period of low short-term interest rates given the degree to which the economy is operating below its capacity; this is the Phillips Curve thinking that I've referred to time and again, which can be summarized like this: as long as the economy has lots of idle capacity, then monetary policy needs to remain very accommodative in order to counteract the risk of deflation. Put another way, with a near-10% unemployment rate, the last thing we need to worry about is inflation. (Note: this is not my view, rather what I think is driving the market and the Fed's view of the current situation.)

Looking back to the end of last year from today's vantage point, we see that on the margin, there has been a huge change in the market's perception of monetary policy. The market has shifted from expecting monetary policy to be so tight as to generate a prolonged bout of deflation, to now expecting policy to be easy enough to allow inflation of 2 – 2.5%. Such a dramatic easing of policy goes a long way to explaining why the dollar is weaker today than it was at year-end, and why gold is stronger: the supply of dollars has increased relative to what the market expected, and so the value of the dollar has dropped. It also helps explain why 10-year Treasury yields are up 135 bps over the same period, and TIPS breakeven inflation rates are up 160 bps.

But why are 10-year Treasury yields still so low from an historical perspective? (They were only lower on a sustained basis during the Depression.) Why isn't the Treasury market pricing in a higher rate of inflation, given the Fed's massive easing of monetary policy? Why is the market still so apparently eager to buy Treasuries, knowing full well that deficits will be on the order of a trillion dollars or so for as far as the eye can see?

A good friend of mine, David Malpass, suggests that the dichotomy (relatively low Treasury yields versus rising equity and commodity prices) reflects a market that is investing for two extremes (a "barbell" trade), trying to protect against inflation and deflation at the same time. Buy Treasuries to protect against deflation, since deflation would mean lower yields, while buying equities and commodities to protect against rising inflation. I'm not sure this is a robust explanation (TIPS spreads should be quite narrow, for example, if deflation fears were motivating Treasury purchases), but it does have some appeal and it squares with the continued relatively high level of implied volatility in both stocks and bonds, because it reflects a great deal of uncertainty about the future.

I think we have to look at the mechanics of the bond market for an answer to these questions, and to the pervasive and strongly-held belief that the U.S. economy will be very weak for a long time.


No matter how hard you look, you can't find any evidence today that the bond market thinks the Fed is going to make an inflationary mistake, or that there is any risk of deflation. The breakeven spread on 10-year TIPS is a benign 1.8%; and the 5-year, 5-year forward inflation rate implied by the TIPS market is about 2.25%. As far as the bond market is concerned, the Fed has addressed the deflationary concerns of late last year without jeopardizing the long-term outlook for inflation.

Furthermore, the market apparently agrees with the Fed that there is no need to raise short-term rates for quite some time, since it will be years before the unemployment rate comes back to levels even approaching full employment (variously estimated to be about 5 or 6%). According to the pricing of fed funds and eurodollar futures, the funds rate is expected to be unchanged for another six months or so, and then to creep up only gradually. 2-year Treasury yields today tell us that the market expects the funds rate to average only 0.9% over the next two years. That means you can finance 10-year Treasuries yielding 3.4% for two years and only pay 0.9%, earning a spread of 2.5% per year on average. That's a compelling investment for the bond market, since the Fed is essentially promising that it won't upset the carry trade applecart by raising rates prematurely; the Fed wants people to borrow and buy things.

As the next two charts show, the slope of the yield curve from 2 to 10 years (which is a good proxy for the appeal of the carry trade) is about as steep now as it has ever been. The steep curve makes for a compelling carry trade. 10-year yields are being held down because 2-year yields are very low. T-bond yields are thus unlikely to rise unless and until the market realizes that the Fed needs to raise short-term rates sooner than currently expected. When that happens is anyone's guess, of course, but I think it is likely to happen sooner rather than later. That better be the case, however, since being short bonds in a steep yield curve environment has a big negative carry cost. Indeed, it costs over 3% per annum to be short the 10-year Treasury right now. Unless you have a strong conviction that the Fed is going to have to surprise people by raising rates sooner than expected, you would be very reluctant to short Treasuries right now. The Fed, in short, holds the key to why T-bond yields are so low today.


I've been pointing out since late last year that forward-looking, market-based indicators of inflation have all been flashing warning signs: rising gold prices, a weaker dollar, rising commodity prices, a steep yield curve, and rising breakeven spreads on TIPS are all signs that inflation risk is picking up, not to mention the extra $1 trillion of bank reserves the Fed has dumped into the banking system. The market has been studiously ignoring these harbingers of rising inflation because the economy has fallen so far below its potential. Yet these same signs are telling us that the Fed's generously low level of interest rates is progressively weakening the demand for money; people are increasingly willing to borrow (and less likely to hold onto existing money balances) and increasingly willing to buy things like other currencies, gold, and commodities. Which is another way of saying that the Fed is oversupplying money to the system, and this will very likely fuel a higher rate of inflation in the future.

The tension that this creates—the market's confidence in a low inflation future versus the warning signs of rising inflationary pressures—can be found, I submit, in the continued, relatively high level of implied volatility in both the bond and stock markets. And that's how I tie everything together in what I hope is a coherent story.

Wednesday, June 24, 2009

FOMC stuck in the "slack" rut


The Federal Open Market Committee today told us that while they see signs that "the pace of economic contraction is slowing," they anticipate that economic conditions will be so bad for so long as "to warrant exceptionally low levels of the federal funds rate for an extended period." The main reason they cite for this conclusion is that "substantial resource slack is likely to dampen cost pressures."

In other words, they are likely to make the same mistake they made in late 2003, when they telegraphed their intention to keep the funds rate at 1% for an "extended period." From their statement today we can infer that the line on this chart will be somewhere in the range of -1 to -3% for the next few years. And that, in turn, means monetary policy will be about as easy as it's ever been. Easy enough to create at least another bubble or two, the main question being where.

In essence, the Fed is offering the world a free lunch: borrow overnight and buy just about anything that moves—move out the curve and pick up yield, buy real estate, buy stocks of companies that can merely survive, buy commodities. This is the closest thing to a risk-free arbitrage that one can imagine.

If this doesn't result in the banking system putting all those excess reserves that are currently sitting idle at the Fed to work, I don't know what will. Banks themselves now have the ability to engage in almost riskless arbitrage, using their reserves to buy all sorts of things—especially Treasury notes and bonds—that yield more.

As this op-ed in yesterday's WSJ reminded us, the Fed made a similar decision in late 2003 which ended up contributing to the bubble in housing prices, oil prices, and commodity prices. At the time, the economy was turning up, and there were plenty of warning signs that the Fed was too easy: the dollar was down, gold was rising, commodity prices were rising. Instead of tightening, they kept the fed funds rate at extremely low levels, in both real and nominal terms, for about two years. Although the signs of a recovery today aren't as strong as they were in late 2003, the warning signs of too much money are much stronger: the dollar is 10% weaker, gold has more than doubled, commodity prices are up 30%, oil has more than doubled, and the yield curve is steeper.

The rationale for all this ease is "slack," which is a codeword for the Phillips Curve theory of inflation. This theory, which has been discredited by several studies by the Fed's own economists and by others, holds that inflation has little or nothing to do with monetary policy, and everything to do with how strong or weak the economy is. The Fed's role, according to this theory, is to raise and lower rates in order to fine-tune how fast or how slow the economy grows, thus indirectly controlling inflation by first controlling economic growth. Unfortunately, hubris has trumped common sense, since no person or committee is smart enough to know what magic overnight interest rate will produce the desired level of growth. And it is arguable whether the Fed has any ability at all to fine-tune growth with its interest rate too. Plus, no one really knows how to estimate "slack," whatever that is. It's a fool's game, but the Fed just keeps playing it.

The bond market sold off today, ostensibly because the FOMC announcement ruled out any increase in the Fed's planned purchases of T-bonds and mortgage-backed securities. That's a fool's game as well, since the Fed has no ability to influence the level of bond yields. Indeed, the more bonds it purchases, the less likely that bond prices will rise; the market will realize that the Fed is monetizing debt, and that will render Treasury bonds instantly less attractive by increasing future inflation.

So the real message of the FOMC today was not that it won't increase its bond purchases, it's that the FOMC still believes in the wrong theory of inflation. Consequently, it is more likely to make a monetary error. This error could show up as another asset price bubble somewhere, a faster rate of inflation, a weaker dollar, higher interest rates in the future, and/or higher gold and commodity prices. It is not going to be of great help to the economy today, just as Obama's stimulus plans are more depressing than they are stimulative (because of the very real threat of a significant increase in tax burdens). Quantitative easing made sense when the financial markets and the economy were on the ropes. But now with the economy beginning a recovery and the warning signs of too much money growing, easy money is a fool's game. It only fuels speculative activities, while at the same time reducing investment in the U.S. because it undermines the strength of the dollar and by inference reduces the return on U.S. investments.

Despite this nasty combination of bad fiscal and monetary policy, however, I do remain optimistic. I think the economy can still manage to grow, just not as much as it otherwise could. I think the market is still priced to the belief that growth is going to be almost nonexistent or very weak, so even a modest 3% rate of growth (very modest given how much economic growth has fallen in the past year) going forward would be a welcome surprise.

In the meantime, the Fed is sending investors and households several messages: 1) buy that house you were thinking of buying sooner rather than later; 2) get rid of some of the cash you have stockpiled—since it will likely pay a negative real rate of interest—and buy just about anything else instead; 4) for the money that you want to keep in a really safe place, consider TIPS; and 5) avoid lending any of your money to Treasury (i.e., don't buy Treasury notes or bonds).

Full disclosure: I am long equities, long TIPS, long housing, and short T-bonds as of the time of this writing.

Wednesday, September 29, 2010

Thoughts on quantitative easing


Ever since the Aug 10th FOMC statement—in which the Fed announced it would be buying longer-term Treasury securities with the proceeds of its maturing or prepaid Agency and MBS holdings—there has been a very interesting and tight correlation between the slope of the Treasury yield curve from 10 to 30 years and the market's own inflation expectations. This is shown in the above chart, with the red line representing the 5-yr, 5-yr forward inflation expectations embedded in TIPS securities, and the blue line representing the slope of the Treasury yield curve from 10 to 30 years.

What stands out is that the slope of the longer end of the yield curve is now a good proxy for the market's inflation expectations. That is at it should be, of course, since the higher inflation expectations, the greater the premium that investors should demand to own 30-yr bonds instead of 10-yr bonds. But it hasn't been that way for some time. And as the next chart shows, the slope of the 2-10 portion of the yield curve has been trending down all year even as inflation expectations have perked up. Plus, the flattening of the 2-10 portion of the curve has occurred under very unusual circumstances. (Typically, the curve flattens when the Fed pushes up short-term rates, and it steepens when the Fed lowers rates. For some time now, the Fed has kept short-term rates steady at very low levels, while longer-term rates have been falling.)


So the behavior of the yield curve is telling us something important, namely that the Fed's purchases of (and intention to continue purchasing) longer-term Treasury notes is having an impact. The Fed is artificially depressing yields out to 10 years, and that's not surprising because that's what they are aiming for. The Fed believes that lower long-term yields will be stimulative for the economy.

Whether the Fed's purchases of bonds will prove to be a stimulus for the economy remains to be seen, of course. Since early August, lower 5-yr and 10-yr Treasury yields have not resulted in any significant decline in mortgage rates, for example, because the spread between Treasuries and mortgage rates has simply widened. This is not unusual at all, it is simply the market saying that it doesn't believe lower Treasury yields are permanent, and/or it doesn't think that buying mortgages at lower yields is likely to prove profitable. And even if the Fed were able to drive mortgage rates to artificially low levels, I think it's questionable at best whether this would prove to be a stimulus for the economy.

Artificially low borrowing costs are part of the reason we're in the mess we're in. Cheap credit, among other things, helped fuel the housing boom, which eventually went bust. Flooding the system with money could help bail out underwater homeowners by pushing up home prices, but only at the cost of another round of reflation (perhaps housing prices, or in some other area of the economy, who knows?). Plus, it's hard to convince people to borrow these days, when so many are still smarting from having borrowed too much some years ago.

But I suppose that if the Fed tried hard enough for long enough, it would soon become apparent to intelligent people that taking out a whopping big mortgage was a good way to become rich. Borrow now at a super-low fixed rate for 30 years, buy a bigger home or some other tangible asset, then sit back and wait for the price level to rise and reduce the cost of repaying your loan. If enough people decide to borrow more, that translates into a reduction in the demand for money, and that has the effect of increasing the amount of money in the system relative to the prices of goods and services. It shouldn't be hard to see how that would in turn result in a higher price level for just about everything. It won't, however, result in any material change in the economy's ability to grow, since growth only occurs when the productivity of labor rises—when we collectively produce more for a given amount of effort.

I think the bond market is already thinking along these lines, and that is why the long end of the yield curve is steepening. The Fed may be able to depress 10-yr yields by promising to keep the funds rate at zero for an extended period of time, but there is no way the Fed can convince investors to buy 30-yr bonds a ridiculously low yields. Savvy investors are figuring this out: quantitative easing is going to push up inflation, so the thing to do is to shun long-term bonds (or borrow at long-term rates), and buy tangible assets or other currencies. Did I mention that gold and other currencies are already rising? And that's why the steepening of the long end of the curve is indeed a good sign that quantitative easing is going to lift inflation.

Along the way to higher inflation—which could take years to show up—this Fed exercise in quantitative easing may have at least one salutary effect, and that will be to vanquish the widespread fears of deflation. Convincing people that holding onto cash yielding zero is a bad idea is one way of boosting the velocity of money, and that is in turn a way of boosting the economy, if only because velocity has been very depressed. People have been hoarding money since the financial crisis erupted, and the hoarding continues to this day. That has depressed growth in the economy, which is another way of saying that fear of the future and risk aversion are not compatible with healthy growth.

I'm not condoning a QE2, however. I am hopeful, in fact, that it will not prove necessary, and I think that will become obvious as more signs of economic growth show up in coming months.

Sunday, February 20, 2022

The Fed is not addressing perverse incentives


Faced with much-higher-than-expected inflation, the Fed is nevertheless taking great pains to assure markets that they will address the problem in a slow and gradual fashion, by taking 25 bps baby steps per month to raise the federal funds rate beginning next month. They seem to be aligning with a school of thought that says the economy these days is too weak to sustain a rapid increase in interest rates, so it's better to be slow and gradual than shock and awe.

While this reinforces the point of my last post (i.e., the Fed poses no near-term threat to the economy), it will likely only make things worse in the long run. Why? Because by pre-announcing a gradualist approach they have given investors and the public a green light to take advantage of incredibly cheap financing costs, and that will only make inflation harder to control in the future. Why harder to control? Because increasing the incentive to borrow money to buy things (cars, houses, commodities, property, plant and equipment) is equivalent to decreasing the incentive to hold money.  Borrowing money means going short money: you win if the value of the dollar declines. Paying off debt means going long money: you win if the value of the dollar increases. With the supply of money (e.g., M2) obviously in over-supply, the Fed is incredibly trying to undermine the demand for holding that money. They couldn't be more wrong.

From a monetary perspective, the U.S. faces a gigantic, two-sided problem: a huge surplus of money and a lack of demand for all that money. That adds up to a turbo-charged inflation environment wherein money becomes a hot potato that no one wants to hold because it is losing value. To better understand that process, once again I recommend my post from last summer: "Argentina inflation lessons for the U.S." 

What follows are some charts that help illustrate what is going on.

Chart #1

Chart #1 shows the real and nominal value of used cars, as calculated by the folks at Manheim Consulting (and using the CPI to determine inflation-adjusted prices). Prices in nominal terms have nearly doubled in the past two years! Sure, a lot of this is due to supply chain problems—with no chips they can't build and sell new cars, so with demand pumped up with lots of transfer payments, car prices have nowhere to go but up. That's the argument for the current inflation spike to be transient. But that ignores the fact that a whole lot of prices are up and people are paying those prices and still want more. Those who are flush with cash can pay those higher prices, but that doesn't reduce the cash available to spend, since the cash that buyer A hands over then sits in the account of seller B. More rapid spending doesn't deplete the stock of excess cash, it simply spreads it around. Without excess cash there could not be a general increase in prices.

Chart #2

Chart #2 is one of the most important yet largely ignored chart in the world today, in my view. It's a graphic depiction of just how much extra money is sitting in the bank accounts of the U.S. public (M2 excludes corporate cash, by the way). Relative to what we would have expected M2 to be today, there is an extra $4.3 trillion dollars that has landed in bank accounts in the past two years. At first, with Covid lockdowns and general panic reigning, the public was happy to have all that money socked away, but now that life is getting back to normal, people are trying to spend it. And it shows—just look at the soaring prices of homes, cars, commodities, food, etc.

There are two ways the Fed can fix this problem, but those solutions are not yet even on the table. For one, they can reduce banks' ability to increase their lending by dramatically shrinking the Fed's balance sheet (i.e., the Fed needs to sell trillions of bonds in order to soak up trillions of excess reserves held by the nation's banks—a process otherwise known as Quantitative Tightening). Alternatively, and additionally, they can raise the interest rate they pay banks that hold those extra reserves, thus making lending to the private sector less appealing than lending to the Fed (lending to the Fed by holding bank reserves is a no-risk proposition, unlike lending to the public). And of course they can and most probably will do both—eventually. But to do it right they need to act swiftly and decisively. If they don't, troublesome inflation is going to be with us for years.

Chart #3

Chart #3 shows the history of rates on 30-yr fixed rate mortgages. Just a few months ago they were trading at all-time lows—less than 3%! Just think of all the happy people who refinanced their mortgage in recent years and then discovered that housing prices have risen over 20% in just the past year. Do the math: if you got a 3% mortgage with a 20% down payment ($100,000) to buy a $500,000 house a year ago, you have paid only $15,000 in interest and your house has gone up by 20% ($100,000). That equals a total return on your down payment of 85% ($85,000)! There's a handy shortcut to figure out how much profit you can make by borrowing money to buy property: If the required down payment is 20%, then you are taking on 5 times leverage (100/20). Multiply the amount of leverage by the difference between the asset's annual appreciation and your annual interest cost (in this case, 5*(20% - 3%) = 85%, and you get your profit. 

I'll bet lots of people today are looking at borrowing costs and comparing that to their expected returns. If you bought a car a year ago with a 3% loan and 10% down, you could realize an obscene profit by selling the car today. Say you sell it for only 25% more than its initial selling price (I'm being really conservative here). That would give you a profit of 10*(25% - 3%) = 220%!

With interest rates so low relative to inflation, it's no wonder the money supply is surging: when banks make loans, they create money out of thin air by crediting the borrower's account. Rising inflation expectations encourage borrowing, and more borrowing expands the supply of money. 

So, is the recent 1-point jump in mortgage rates likely to crush the housing market? I seriously doubt it, as long as home prices rise by more than the current mortgage rate, which is about 4%. 

Chart #4

Chart #5

Chart #6

Chart #4 shows the level of single family home sales, which has been rising for the past decade. Over that same period, national home prices have increased by an annualized rate of just over 7%, according to the Case Shiller data, and 30-yr fixed rate mortgage rates have averaged about 3.8%. Someone lucky/smart enough to buy a home a decade ago with 10% down has made a profit of 32%.

Charts #5 and #6 are the natural result of these factors: people are buying homes faster than they come on the market. Nationwide, the supply of unsold homes has never been so low relative to the pace of sales. And of course that only keeps upward pressure on home prices. One caveat: Chart #6 suggests that real home prices tend to rise, on average, by about 1.1% per year. Current prices are running hot (over trend), so they might not have a lot further to go. I would expect them to cool off; in real terms, that means they continue to rise by something less than prevailing rate of inflation. The Fed needs to jack rates higher—much higher to avoid this.

Moral of the story: when interest rates are low relative to inflation, people are incentivized to borrow and buy. Which is what I've been recommending for many years, by the way. And that in turn fuels inflation by expanding the money supply. Unless, of course, the Fed takes steps to unwind the perverse incentives that are in place today. 

Chart #7

Now back to the bond market and what it is thinking about inflation. That's summarized in Chart #7, which show 5-yr real and nominal Treasury yields and their difference, which is what the market expects that consumer price inflation will average over the next 5 years. Inflation expectations have now reached their highest point since the introduction of TIPS in 1997: 2.9%. (Prior to that we had no way of directly measuring inflation expectations.) But expectations are still far short of where actual inflation is, which means the bond market is pretty confident that the Fed will get things right before too long. But I'm not so sure.

Chart #8

Chart #8 compares the real yield on 5-yr TIPS to the current real yield on Fed funds. The former is best described as the value that the market expects the latter to average over the next 5 years. Apparently, the bond market expects the Fed to raise the real yield on overnight assets significantly over the next 5 years from its current abysmally low level of almost -5% at the same time that inflation falls significantly. Regardless, the market doesn't expect real yields to be positive until many years in the future, which implies the market is quite pessimistic about the long-term health of the economy. So: the bond market thinks the economy will be quite weak for the foreseeable future, and inflation will soon return to levels that the Fed is targeting (2-3%). Those are courageous assumptions, I would argue.

Chart #9

Meanwhile, we can't lose sight of the fact that interest rates are currently WAY below the level of inflation. As explained above, this by itself creates incentives which work to push inflation higher. It's useful to compare today to the 1970s to fully appreciate the Fed's predicament today. Back then, inflation surprised to the upside and it took the Fed more than 10 years to get it back under control. The Fed broke the back of inflation only after it raised rates (by curtailing growth of the M2 money supply and jacking up the Fed funds rate) to a level which exceeded the rate of inflation. They may well have to do that again. Unfortunately, almost no one expects that to happen. So the next several years could be a bumpy ride, but the bumps won't start coming for awhile.

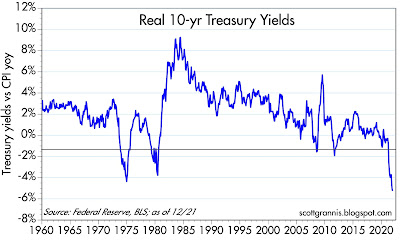
Note also that once inflation started to decline in the early 1980s, the bond market was very slow to react. Real interest rates (the difference between the blue and red lines) were very high initially and then gradually subsided. Today real interest rates are decidedly negative, much as they were during a portion of the 1970s (see Chart #10). Negative real rates tend to occur during times when inflation exceeds expectations and the Fed is slow to respond—that is what happened in the late 1970s, and the past looks set to repeat.

Chart #10

I will be watching breathlessly for the monthly M2 numbers to be released around the end of the third week of each month. I will only breathe easy if they start showing a declining rate of growth, which is currently around 12-13% on an annual basis. I will be pleased if the Fed becomes more concerned about inflation and starts raising the Fed funds rate more aggressively at the same time they start selling the bonds they hold (to reduce bank reserves) more aggressively. The Fed desperately needs to address the perverse incentives they have created.

Although the market might well react negatively to an aggressively tightening Fed, I would see it as a reason to be optimistic. How could it be bad for the Fed to do what they should be doing?