Sunday, December 4, 2022

Lower interest rates to the rescue


A few days ago, Chairman Powell essentially admitted that the Fed will no longer be pursuing an aggressive tightening policy. Since then, key interest rates have registered some significant declines, and that is good news for the housing market, the economy in general, and the stock market. We have probably seen the end of the shortest and most dramatic round of Fed tightening in history.

The Fed was late to see the inflation problem, which is very unfortunate, but they have not hesitated to act forcefully, and it seems to have worked. As almost always happens in the end stages of a Fed tightening, real yields have soared (up almost 400 bps in less than one year), the yield curve has inverted, the dollar has surged, commodity prices have dropped, the housing market has run into a brick wall, the stock market has sunk, and the economy appears set to enter a recession. All, of course, classic signs of very tight monetary conditions—tight enough to bring inflation down, and that is indeed what's happening.

There are some unique features to this tightening cycle which bear attention. Most importantly, there is no liquidity shortage. Liquidity is the lifeblood of the bond and stock markets, because liquidity means that people can easily and quickly trade their positions and adjust their exposure to risk. We all know what happens when someone yells "Fire!" in a crowded theater: panic sets in and the exits quickly jam—casualties occur. But with plentiful liquidity, it's like being in a crowded open-air theater when someone yells fire—you simply walk outside unimpeded. And so it is today; there are few if any signs of the distress that typically accompanies very tight money. Credit spreads are low, especially the all-important swap spreads, which are a gauge of how easy it is for people to buy and sell all kinds of securities and risks in size (see Chart #1 in this post for a history of swap spreads). Credit default spreads are low. Volatility is subsiding. There has been a surge of layoffs, but they are mostly concentrated in tech companies that had become seriously bloated. Unemployment claims are low and job growth has exceeded expectations; in fact, there are more job openings than there are people willing to work. 

Another key difference this time around is that the bout of inflation we have suffered was not the result of Fed policy (it is usually is). It was the result of a massive surge in Covid "stimulus" payments which put trillions of dollars into the hands of people who were still hunkered down and unable to spend it. The result was a multi-trillion dollar surge in bank savings and deposit accounts. Once the Covid scare passed, the liquidity dam broke and a tsunami of price increases spread throughout the economy. 

So it wasn't low interest rates that caused the problem, it was too much government spending. Higher interest rates came to the rescue, giving people and incentive to hold on to their extra cash, and that minimized the spending tsunami. Now, interest rates can decline and help the economy get back on a normal track fairly easily. It won't all happen at once, but the wheels have been set in motion. Meanwhile, M2 is declining, which means that excess cash is being reduced with the passage of time.

Chart #1

Chart #1 shows the level of real yields on 5-yr TIPS. In the past year they have surged from -2% to almost +2%. That's an unprecedented swing of almost 400 bps in a relatively short time frame. That's why this year proved to be the most painful in history for anyone exposed to higher interest rates. Fortunately we appear to be waking up from this nightmare.

Chart #2

Chart #2 shows the national average rate on 30-yr fixed-rate mortgages. This has dropped from a high of 7.3% to now 6.5%: a decline of almost 80 bps in less than two months. This is the first step in making homes more affordable, but it won't be the last. Rates are going to have to decline significantly, and they should, even if 10-yr Treasury yields don't fall further. Chart #3 explains why.

Chart #3
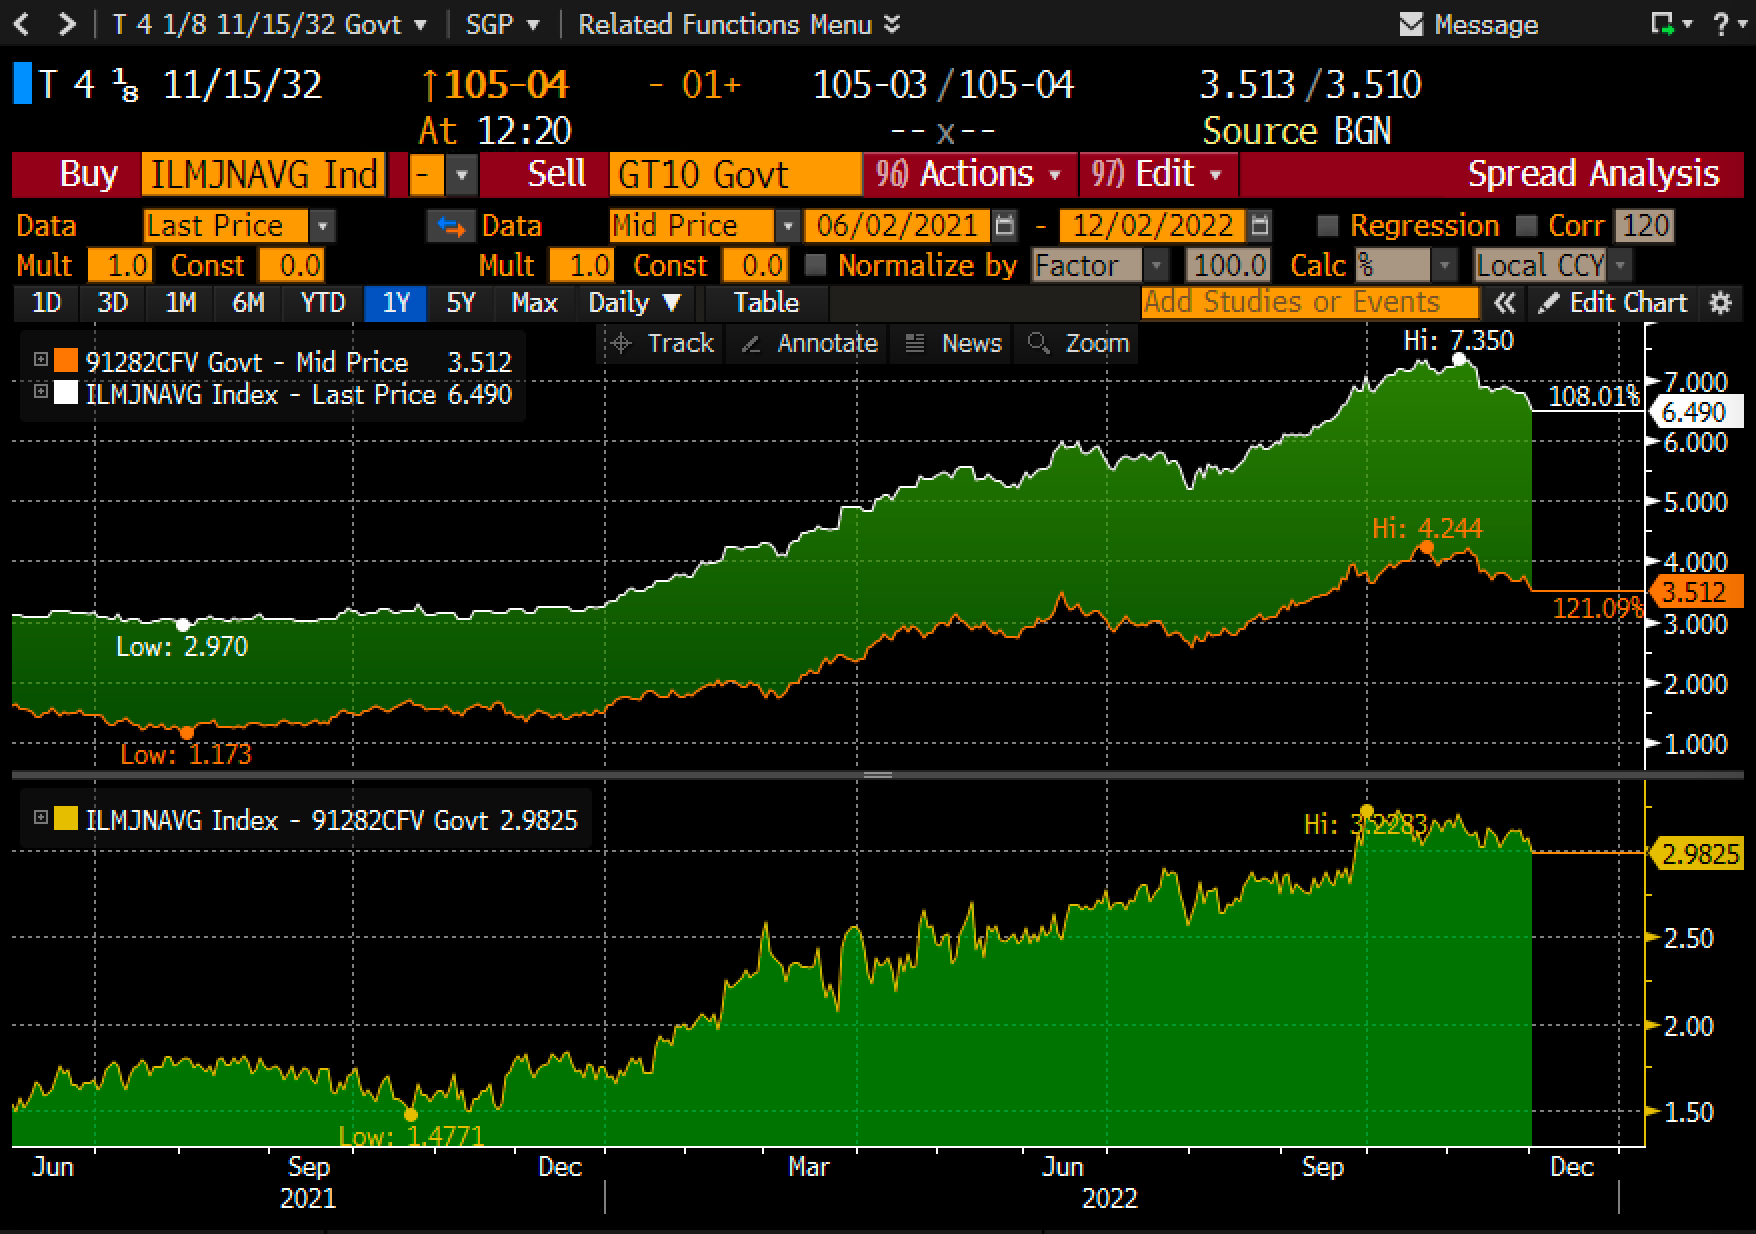
Chart #3 shows 30-yr mortgage rates (white line in the top half of the chart), 10-yr Treasury yields (orange line), and the spread between in the two in the bottom half of the chart. 10-yr Treasury yields are the benchmark for mortgage rates; mortgage rates typically run about 150 basis points above the 10-yr Treasury yield. In recent months, however, the spread ballooned to over 300 bps—twice the normal spread. If 10-yr Treasury yields stabilize around 3.5%, 30-yr mortgage rates should eventually decline to about 5%

Chart #4

Chart #4 shows Credit Default Swap spreads, which reflect the market's assessment of the health of the economy and corporate profits. Spreads are still somewhat elevated, but they have declined impressively in the past few months. This is not what you would expect to see if the economy, as many seem to believe, were on the cusp of a recession. 

While we're on the subject of market fears, it's timely to look at the burden of our surging federal debt, which has now reached $24.6 trillion. You have probably seen many analysts saying it is $34.1 trillion, but that includes $6.9 trillion of intragovernmental holdings which is just an accounting fiction: money that one part of the government owes another. What counts is the debt that our government owes to the public.

$24.6 trillion is still an immense amount of debt. Relative to GDP, our national debt, now about 95% of GDP, was only once higher, at the tail end of World War II. Back then it got to almost 125% of GDP, but the world didn't end. In fact, after WWII, our debt/GDP ratio plunged as the economy boomed. It might seem improbable, but there is no a priori reason it can't happen again.

Chart #5


Furthermore, it is not inevitable that all this debt will push interest rates higher, thus imposing an impossible burden of debt service as many fear mongers are arguing. As Chart #5 shows, it would appear that a rising debt/GDP ratio can occur with lower interest rates, not higher. And a falling debt/GDP ratio can even correspond to higher interest rates.

Chart #6

Chart #6 shows the burden of our national debt, which is the cost of servicing the debt as a percentage of GDP. I've estimated what it will be by the end of this year. And as you can see, it will still be very low from an historical perspective because interest rates are still relatively low. If interest rates stabilize or decline from current levels, and the economy remains reasonably healthy, the debt burden is unlikely to reach unprecedented levels. 

It all depends on how the economy behaves—how much inflation we have and how much growth. Higher inflation shrinks the burden of debt, because it can be paid back with cheaper dollars. A stronger economy boosts tax revenues, which helps support debt repayment. And in any event, paying back the debt is not equivalent to flushing money down the toilet. Every dollar of interest paid on our debt goes into someone's pocket. It doesn't disappear from the economy.

What's bad about our national debt is not the amount of debt that must be serviced, it's what was done with the money we borrowed. Therein lies the real burden of debt. If the money borrowed is squandered, then that places a huge burden on an economy that has not become more productive or more efficient. Unfortunately, a huge portion of our current debt (about $5-6 trillion) was money that was borrowed—or printed—and then handed out to the public. Using debt to finance spending is terrible, since it doesn't enhance the economy's productivity. We essentially wasted $5-6 trillion that might have been better spent on investments that create jobs. The real burden of that debt will thus be paid by future generations, in the form of a slower-than-average rise in living standards. 

Wednesday, November 23, 2022

The Fed pivots—finally!


Thanks to today's release of the November 2nd FOMC meeting minutes, we know that the Fed has "pivoted" as expected; they are backing off of their aggressive tightening agenda. Instead of hiking rates another 75 bps at their December 14th meeting, we are likely to see only a 50 bps hike, to 4.5%, and that could well be the last hike of this tightening cycle—which would make it the shortest tightening cycle on record (less than one year). And they might not even raise rates at all in December—that would be my preference.

For more than two years I have been one of a handful of economists keeping an eye on the rapid growth of the M2 money supply. Initially I warned that it portended much higher inflation than the market was expecting. But since May of this year I have argued that inflation pressures have peaked: "Many factors have contributed to this: growth in the M2 money supply has been essentially zero since late last year; the stimulus checks have ceased; the dollar has been very strong; commodity prices have been very weak; and soaring interest rates have brought the housing market to its knees. All of these developments mean that the supply of money and the demand to hold it have come back to some semblance of balance." To sum it up, I think the Fed has gotten policy back on track, so there's no need to do more. In fact, the October M2 release showed even more of a slowdown than previously, thus underscoring the need to avoid further tightening.

For a recap of my thinking on all this, here is a short summary of relevant posts:

October '20: On the demand for money and other considerations

March '21: The problem with unwanted money and More signs that inflation is set to increase

July '21: Big changes in inflation and government finances

August '21: Inflation update: this is serious

September '21: Money and inflation update

October '21: Monetary policy is a slow-motion train wreck

November '21: Recession risk is very low, but inflation risk is high

January '22: The bond market is wrong about inflation

Beginning last May I began arguing that we had seen the peak of inflation pressures, thanks to a big decline in the growth of the M2 money supply.

May '22: M2 growth slows: light at the end of the inflation...

August '22: Inflation pressures cool, economic outlook improves

Sep '22: Inflation pressures are in fact cooling ...

I'm still firmly in the inflation-is-falling camp, and it's because of the unprecedented decline in the M2 money supply, coupled with forceful actions on the part of the Fed to bolster money demand with sharply higher interest rates. As a result, I believe we are going to see a gradual decline in inflation over the next year or so.

The following charts round out the story:

Chart #1

Chart #1 has got to be the most significant monetary development that almost no one is paying attention to. It shows how M2 surged above its long-term trend growth rate beginning in April 2020, and then stopped growing about one year ago. It is still quite elevated (i.e., there is a lot of "excess" money sloshing around), but the growth rate of M2 is now negative: over the past six months M2 is down at an annualized rate of -2%, and over the past 3 months it is down at a -4% annualized rate. This adds up to the weakest growth of M2 since at least 1960—and possibly the weakest growth ever. M2 today is about 22% above its long-term trend, whereas it was almost 30% above trend earlier this year. The amount of "excess" money is declining rapidly, and that is a good thing.

Chart #2

Chart #2 shows how the surge in M2 growth was almost entirely driven by massive federal deficit spending from 2020 through late 2021. In effect, the government sent out many trillions in "stimulus" checks to people and most of that money ended up being stashed in bank deposit and savings accounts. The demand for money was intense back then since there was great pandemic-fueled uncertainty and besides, lockdowns left people with little ability to spend money. All that money wasn't a problem until early this year, when the pandemic crisis began to recede. That marked the point when people started to spend the money they had stockpiled, and that spending surge combined with supply-chain bottlenecks to produce a wave of higher prices for nearly everything. In short, an improving outlook and a return of confidence meant that the demand for all that money was evaporating.

Chart #3

Chart #3 tracks the demand for money as defined by the ratio of M2 to nominal GDP. Let me explain: M2 is a proxy for the amount of money the average person holds in currency and bank deposits. Nominal GDP is a proxy for average annual incomes. The ratio of the two therefore tells us what percent of one's annual salary is held in the form of readily-spendable money. When the ratio is higher than people feel comfortable with (i.e., when there is no longer a need to stockpile funds for a rainy day), people attempt to spend down their money balances, and that fuels a surge in demand. Money balances decline, and nominal GDP surges. I estimate that the ratio of M2 to GDP will fall to almost 80% by the end of this year, down from just over 90% at its peak in Q2/20. Today there is simply no need for people to hold so much of their income in the form of cash. Indeed, I don't see why this ratio can't fall back to 70%, where it was before the pandemic hit. For that to happen, nominal GDP (mostly inflation) is almost certainly going to continue to grow, albeit at a slower pace, and M2 balances are likely to decline some more.

(Note: for those who prefer to think in terms of the velocity of money, just invert Chart #3. Velocity is simply the inverse of money demand, and vice versa. Today velocity is definitely picking up. For a longer explanation of this see this post.)

As Milton Friedman taught us, inflation happens when the supply of money exceeds the demand for it. It's critical to understand that rapid growth in M2 from Q2/20 through Q3/21 was not inflationary because the demand for money was very strong during that period. But when the demand for money started to fall early this year, then inflation surged, even though M2 was no longer growing. From this we can infer that the demand for money fell significantly.

Money demand is likely still declining, and money supply is still contracting, but the huge rise in interest rates this year has acted to bolster money demand: earning 4-5% on bank CDs is an incentive to hold on to that money you stashed in the bank—at least some it. The net result of all this is an easing of inflationary pressures. That can be seen already in falling commodity prices and housing prices.


Chart #4

Chart #4 shows the level of bank reserves held by US banks. Recall that bank reserves are not money that can be spent anywhere. They are assets of the banking system and liabilities of the Fed; their main role today is to collateralize deposits and provide abundant risk-free assets to the banking system, since bank reserves are essentially default-free. Reserves are still super-abundant, thanks to the Fed's decision in late 2008 to permanently expand the level of bank reserves while controlling interest rates directly (i.e, by paying interest on reserves). In prior tightening cycles, the Fed had to drain reserves in order to force interest rates higher; that put a real squeeze on financial markets since it reduced liquidity. Now the Fed simply pays a higher rate on reserves instead of shrinking their supply, so the system is spared a liquidity crunch.

Chart #5

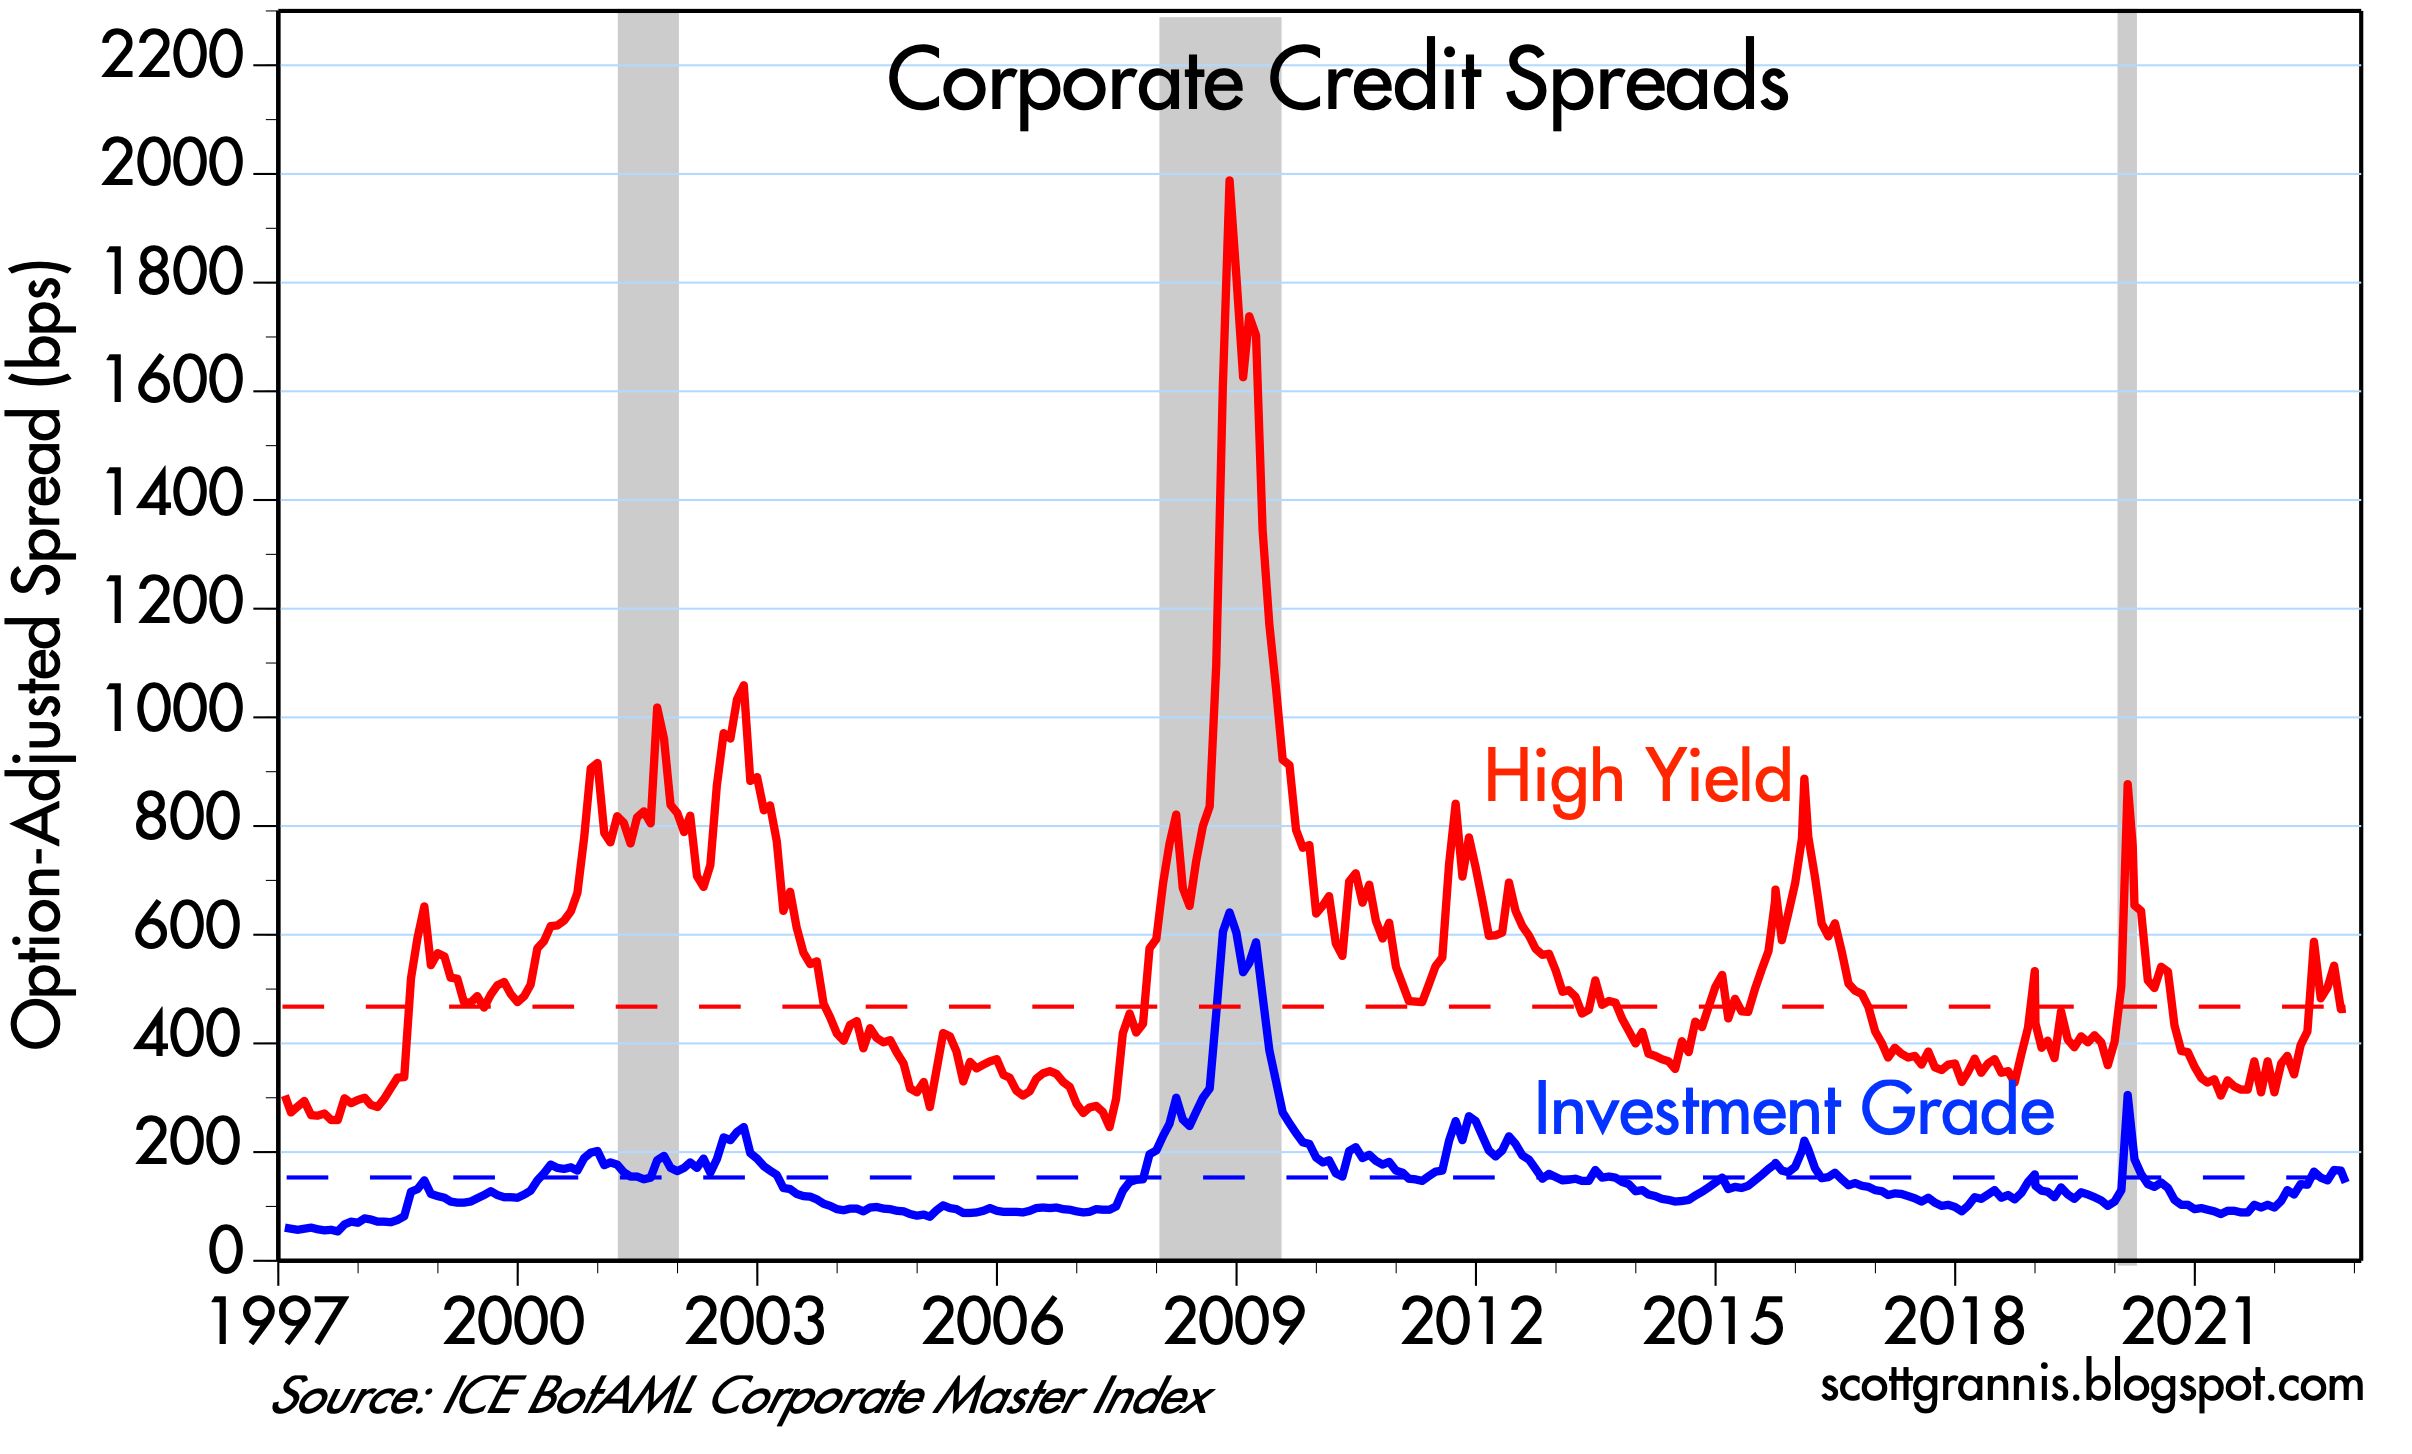
Chart #5 shows option-adjusted credit spreads for corporate bonds. This is an excellent proxy for the level of economic and financial stress in the US economy. As we see, despite a massive amount of monetary tightening, spreads are still at relatively low levels. In prior tightening episodes, spreads surged and bankruptcies followed, because the Fed was restricting liquidity. This time around things are very different. The risk of a recession is therefore much lower in today's monetary environment. Another great indicator of financial and economic stress is 2-yr swap spreads, and today they are a mere 31 bps, well within the range of normal.

Chart #6

Chart #6 shows us that household financial burdens (financial-related payments as a percent of disposable income) are unusually low. They were much higher going into recessions in the past. Businesses and households are still in pretty good shape despite all the tightening. Thus a recession is less likely now than during prior tightening cycles.

Shall we call this "tightening lite?"

Tuesday, November 15, 2022

Near-term Fed pivot almost guaranteed


The release this morning of October Producer Price indices brings yet more evidence that the inflationary pressures sparked by multi-trillion dollar Covid "stimulus" checks in 2020 and 2021 peaked earlier this year, as I have been pointing out for months. Many factors have contributed to this: growth in the M2 money supply has been essentially zero since late last year; the stimulus checks have ceased; the dollar has been very strong; commodity prices have been very weak; and soaring interest rates have brought the housing market to its knees. All of these developments mean that the supply of money and the demand to hold it have come back to some semblance of balance, and that is of course essential if inflation is to return to a low and steady rate of, say, 2%.

This all but guarantees that the Fed soon will be scaling back on its tightening agenda. For my money, the FOMC's November 2 rate hike (from 3.25% to 4.0%) should be the last, but a hike next month of 50 bps (to 4.5%) is likely to be the Fed's last move for the foreseeable future. The Fed simply can't react as fast as the market does to changing realities—unfortunately, the Fed is usually "behind the curve." In any event, a 4.5% funds rate by year end is fully priced into the market and thus it should not be very impactful. What will change though is the market's expectation for where rates will be a year from now: lower than currently expected, and that is what is driving equity prices higher. 

What's most important is that the market is now beginning to see across the valley of uncertainty to a time when inflation comes back down to 2%. It may take up to a year for that to happen, however, but as long as we know that the worst is over, markets can anticipate a lower-inflation future and equity markets can drift higher. And although it's very good news that inflation has peaked and is now declining, the bad news is that thanks to the 2020-2021 explosion of M2, the general price level will have suffered a major increase that is unlikely to be reversed. Real incomes have suffered and it will take a long time for them to recover.

Chart #1

Chart #1 shows the year over year changes in the total and core (ex-food and energy) versions of the Producer Price index. Both peaked about six months ago, and that was about six months after M2 stopped growing. 

Chart #2

Chart #2 shows the 6-mo. annualized change in the total and core versions of the PPI; this highlights the degree of change that has occurred in the past six months. 

Chart #3

Chart #3 shows the year over year and 6-mo. annualized changes in the final demand version of the PPI (a version which began in 2009). Here the change is even more dramatic. Overall, these three charts tell a story of a rapid deceleration in the growth of prices in the early stages of the supply chain. These changes are likely to be reflected in the months to come in a moderation of the growth of the CPI. 

Chart #4

Chart #4 shows the ex-energy version of the CPI index (plotted on a log scale so that changes in growth rates can be more easily visible). This version of the CPI (which I think is best because it eliminates the extreme volatility of energy prices) has been growing at about 2% per year for a long time. After March 2021 it suddenly picked up to a 7% rate of growth. It is likely to continue to grow faster than the former 2% annual trend for perhaps the next 12-15 months even as the year over year growth rate declines. I'm guessing that when the CPI returns to a 2% annual growth rate, the index will be at least 10-12% higher than the original 2% trend, and that would be about 20% above the level of March '21. Meaning, of course, that the price level will have experienced a one-time increase of at least 10% on top of its typical 2% annual rise. 

Inflation will be with us for some time to come, but its rate of increase will continue to moderate. This doesn't mean the Fed has to continue to tighten, however. Just maintaining its current stance would probably be sufficient to get inflation back down to 2%. That assumes, however, that M2 growth continues to be essentially flat and the government avoids sending out another massive batch of checks funded with the printing press.