Wednesday, August 3, 2011
Random charts and observations
The August ISM Service Sector indices weren't nearly as bad as the manufacturing indices. According to the Business Activity Index (top chart), conditions actually improved a bit last month. The employment index dipped, but remains at levels consistent with the sub-par growth we have seen so far in this recovery.
The ADP estimate of July private sector payroll gains fell a bit from last month's level, but as this chart suggests, it points to the likelihood that Friday's reported job gains will be a lot stronger than the previous month's, since the BLS data is probably going to "catch up" to the ADP data. Not surprisingly, according to Bloomberg, the consensus is calling for an increase of 115K private sector jobs, about double June's number. Again, slow growth, but still growth.
The Challenger survey recorded a jump in July announced corporate layoffs, but as the chart shows, such fluctuations are entirely within the range of what one might expect even when the economy is reasonably healthy.
The RadarLogic survey of home prices shows prices (measured on a per square foot basis and using a weighted average of the past three months) have increased over 4% from last February's lows. This is a typical seasonal pattern, however, so I include this chart of the past 5 years to show that the current reading (185.9) is only 5% below the same week's reading in 2009. Prices have fallen only modestly in recent years, despite a significant increase in distressed sales and foreclosures.
The impressive decline in fixed mortgage rates is a story with several themes. Very low mortgage rates suggest that the demand for mortgages is very weak, and indeed, new applications for mortgages are at levels that are significantly lower than what we saw several years ago (see chart below). However, I note that the chart also shows a modest increase new mortgage applications over the past year. Very low mortgage rates also suggest that the supply of mortgage lending funds has generally exceeded the demand for those funds in recent years. In other words, there is no shortage of money; the problem lies more with a shortage of borrowers (lots of people still trying to deleverage, strong demand for rentals, and lots of foreigners buying homes with cash) and stricter lending standards. Looking back at the chart above, I note that the spread between conforming and jumbo loans has shrunk from a high of just over 200 bps in March 2008, to only 40 bps currently. This is a direct reflection of the improved liquidity conditions in the mortgage market and the return of market efficiency. Prior to 2007, the spread averaged just over 20 bps, so conditions have almost returned to "normal."
In short, there has been an awful lot of adjustment going on in recent years, thanks to market pricing (i.e., the price of homes and the price of money) which has enabled this very distressed market to clear without significant disruptions in recent years. Things are getting better on a daily basis, in fact, as excess housing inventories are worked off.
Tuesday, August 2, 2011
Record lows in TIPS yields reflect deep pessimism
Real yields on TIPS of all maturities today reached a new record low. The main cause of lower real yields is falling nominal yields, since the difference between the two (aka expected inflation) has been largely unchanged. Long-term inflation expectations remain "anchored" around 2.5%, although shorter term inflation expectations embedded in TIPS and Treasury pricing point to inflation of around 3%. The main cause of lower nominal yields, in contrast, is the market's concern that the economy is very weak and liable to slip into a double-dip recession, as reflected in the chart below.
Undoubtedly the market remains concerned that the ratings agencies may downgrade Treasury debt in spite of today's accord to raise the debt ceiling. It is more likely, however, that the market is being driven by its Keynesian instincts which say that the big cuts in spending in today's bill will weaken the economy at a time when it is already weak.
I think these concerns are overblown. To begin with, as I outlined in a post last week, there will be no spending cuts at all. The "cuts" contained in the debt accord add up to a very modest reduction in the future growth rate of government spending. If the huge pickup in government spending failed to "stimulate" the economy, then a modest reduction in the growth of spending going forward is very unlikely to kill the economy. By gradually reducing the share of the economy that is managed by the federal government over time, today's bill should result, eventually, in a modest increase in the economy's growth because the private sector will increase its control over the economy's scarce resources and that, in turn, will result in greater efficiency, productivity, and growth.
The other side to the record-low real yield story is that the market remains concerned about inflation. Inflation expectations have not declined materially even as the economy has slowed substantially this year. The record highs that gold continues to post ($1658/oz. as I write this), coupled with a dollar that is very close to its record lows, confirm that inflation fears are alive and well. Rising gold prices also reflect, I think, a market that looks at all the sound and fury that was expended on the debt negotiations, and the paltry sums that were promised to be shaved from future spending hikes, and concludes that Washington is still miles away from where it needs to be to restore fiscal sanity.
In short, the big decline in yields this past week is the sound of deflating confidence in the future, a sentiment expressed in light-hearted fashion in the cartoon below.
Monday, August 1, 2011
Manufacturing weakens, but it's not a death knell
The July ISM Manufacturing Index was disappointingly weak, and so was last week's GDP report. But as this chart suggests, the current reading on the ISM index does not imply a recession nor does it imply that growth in the current quarter will be weaker than it was in the second quarter. The correlation between the ISM manufacturing index is reasonably strong, but far from perfect. In any event, the level of the July ISM index is consistent with third quarter GDP in the 2-3% range; as the chart suggests, it would take a much weaker ISM index (e.g., below 47) to point to a double-dip recession.
Nevertheless, the bond market continues to behave as if we are on the verge of a recession, with 10-yr yields today falling to 2.74%, and closing in on the lows that we saw last October when the market thought a double-dip recession was in the bag (but which subsequently failed to show up). I might be more worried about the weakness in the ISM index if there were other fundamental indicators pointing towards recession, but there are none that I consider important to be found. Consider this quick recap of important and leading fundamental indicators:
This chart focuses on the monetary and bond market precursors of recessions. Every recession in the past 50 years has been preceded by a significant rise in the real Federal funds rate (blue line), and a flat or inverted yield curve (red line). Currently we have just the opposite: negative real yields and an unusually steep yield curve. This points to an extremely low probability of recession, and a high probability of continued growth. Negative real yields mean very low borrowing costs for many businesses, and a steep yield curve means very juicy profits for banks, since they can borrow at very low rates and lend out at much higher rates. A steep yield curve also means that the bond market sees stronger growth in the future.
Swap spreads are excellent indicators of systemic risk and have predicted the last three recessions. Currently, swap spreads are very low, a good sign that the banking system is sound and the market's risk tolerance is healthy. If the market sensed the approach of a recession, spreads would be much higher as investors attempted to lay off risk in general and avoid counterparty risk in particular.
Credit spreads are also good predictors of recessions. Although the first chart above shows that average credit spreads currently are at levels that preceded the past two recessions, they are far below their highs of 2008 and 2009, and show no material increase in recent months. The main reason that these spreads are so high is that Treasury yields are extremely low—spreads aren't predicting a future increase in corporate default rates, they are one way the market can express a view that extremely low Treasury yields are likely to be somewhat temporary. As the second chart above shows, spreads on long-dated corporate bonds (which are less affected by the extremely low level of short- and medium-term Treasury yields) are relatively low and show no unusual behavior. The third chart above, which compares the yields on A1 industrials with the yield on 5-yr Treasuries, confirms that the somewhat-elevated level of corporate spreads in no way reflects a material increase in corporate borrowing costs or a scarcity of money; indeed, many large corporations today can borrow at the lowest rates in many generations.
Commodity prices show no sign whatsoever of any material weakness in economic activity. Indeed, prices remain very close to all-time highs, suggesting that at the very least global demand and manufacturing activity remain robust. Strong commodity prices also signal that monetary policy is very accommodative, and thus poses no threat per se to the economy.
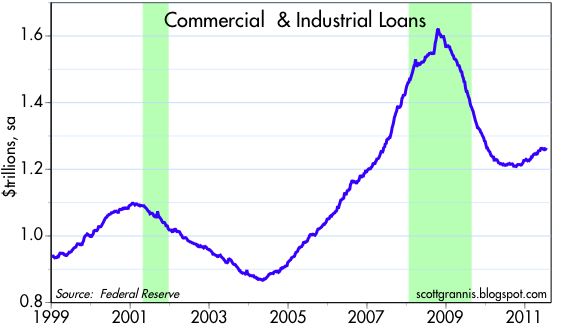
Commercial & Industrial Loans—a good proxy for bank lending to small and medium-sized businesses—have been growing for over seven months. This suggests that banks are slowly relaxing their lending standards, and businesses are finally reversing their deleveraging efforts. Both are consistent with an increased tolerance for risk and are thus a predictor of growth in investment and rising economic activity.
Bloomberg's index of financial conditions has declined a bit over the past month, but it is not low enough to signal any material deterioration in key financial market indicators or the onset of a recession.
New orders for capital goods are a good proxy for business investment, and they continue to rise. Business investment is an essential ingredient for healthy economic growth.
Despite all the economic weakness we've seen in the first half of this year, and despite the fact that tax rates haven't risen (payroll taxes have actually been cut this year) federal revenues have risen by almost 9%. This is fairly impressive, and suggests that this year's economic weakness likely has been caused by temporary and emotional factors (e.g., the Japanese tsunami which disrupted the manufacturing supply chain, unusually bad weather, and concerns that the U.S. government might default or Treasury debt downgraded), rather than any meaningful deterioration in the economic fundamentals.
Despite the weak economy, corporate profits are at record highs. We've never seen a recession come on the heels of a surge in profits.
All of this adds up to a picture of an economy that is weak in general, but with pockets of still-impressive strength; not an economy that is headed for a recession or even further weakness. Important measures of economic and financial fundamentals are still in good shape, and many point to improving activity in the months ahead.
Subscribe to:
Posts (Atom)