This brief post highlights some under-appreciated news contained in today's revised estimate of Q2/23 GDP. Real growth in the quarter (annualized) was revised down from 2.4% to 2.1%, and inflation (according to the all-encompassing GDP deflator, also annualized) was revised down from 2.2% to 2.0%. We're very much in a 2% growth world, as I noted last May. Inflation, meanwhile, has plunged from a high of 9.1% a year ago to a mere 2.0%.
These facts lay bare the false belief that inflation is the by-product of an economy that is "running hot," and that in order to bring inflation down the economy must suffer a period of "below-trend" growth. It just doesn't work that way. The economy has been growing at a sub-par rate since 2009, while inflation has been all over the map. Inflation is the result of too much money relative to the demand for money.
These facts also highlight just how wrong the market is to worry that the economy is "too strong" and therefore the Fed must keep short-term rates at a high level for an extended period. I see the 3.4% rally in the S&P 500 over the past 12 days as evidence that the market is just beginning to appreciate these facts.
Chart #1
Chart #1 shows the path of real GDP compared to two different trend lines. (Note: the y-axis uses a semi-log scale which shows constant rates of growth as straight lines.) The 3.2% trend was in effect from 1955 through 2007, while the 2.1% trend has been in effect since mid-2009. This highlights the grim reality that the U.S. economy has been suffering from a prolonged period of sub-par growth, thanks mainly to unusually high regulatory and tax burdens, coupled with excessive government spending, which in turn has been driven primarily by transfer payments (i.e., sending out checks to people without demanding any work in return).
Chart #2
Chart #2 shows the quarterly annualized rate of growth of the GDP deflator—the broadest, most inclusive, and most timely measure of inflation that we have. (Most folks seem to prefer a narrow, year over year measure of inflation, which is guaranteed to obscure important changes on the margin.) Why don't you see this 2% number in the press? Why is the Fed bemoaning the fact that inflation is still "too high?" Go figure.
One thing for sure: it's only a matter of time before the Fed realizes that instead of keeping rates high for longer, it's time to bring them back down.
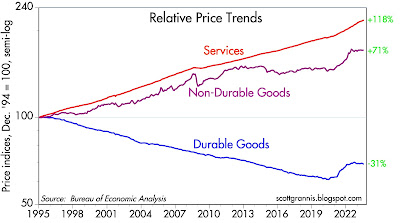
P.S. (8/31): Don't forget that as of July, the CPI ex-shelter index was up only 0.85% year over year. See Chart #2 at this post. Shelter costs are almost certain to decline in coming months since they lag the housing market by about one year. And as Chart #3 shows (below), durable and nondurable goods prices have been flat to down over the 12 months ending in July, leaving services (which includes shelter costs) as the only source of inflation.
Chart #3


9 comments:
There are so many price indices, I have no idea which to say is "best". If the Fed/Powell is going to be very picky on the 2% goal, it will be interesting. He recently specifically mentioned core: “Core goods inflation has fallen sharply, particularly for durable goods, as both tighter monetary policy and the slow unwinding of supply and demand dislocations are bringing it down,” ; and they usually look at PCE.
So, if they really want 2% core PCE, it might be a while, as in several months, before they get there. Based on some credible economics outfits, it might be 12 months.
It is looking like energy costs are rising. I think if they start cutting rates, RE and vehicles would start to rise. That would cause significant economic stress----i.e. likely recession.
They don't have an easy job.
Thanks for the post.
Scott, great observation and post! What is your view on using the Gross Domestic Purchases Price Index rather than the GDP Price Deflator (or CPE/CPI). Even though the trends are certainly the same, I tend to favor the the Price Index as it includes imported goods.
Hi Scott:
What's your view of the Housing market, particularly here in CA, sir? It seems like it is headed for much lower prices...though there are not crazy loans like the GFC had. I truly respect your opinion and analysis. Thanks so much!
There is no such thing as a ABCT curative recession". There’s too much money to mop up.
The economy is being run in reverse. The GINI coefficient has headed higher. Asset prices need deflated.
https://fred.stlouisfed.org/series/FIXHAI
https://twitter.com/NickTimiraos/status/1697203322665509363
"Atlanta Fed's Bostic: If "not for stubborn (and lagging) housing services prices, the core CPI would be running at 2.6% on a year-over-year basis.
Given the lagging nature of rental prices...underlying inflation may well be close to our target already."
Maybe he started reading this blog ...
Re my view on the CA housing market: Prices in most places are very high. Moreover, mortgage rates are extremely high. The combination makes housing very, very unaffordable for most people. Meanwhile, the level of transactions is unusually low, with most of the sales activity coming in new housing. All this amounts to an illiquid market that is poised to reprice lower. Prices and mortgage rates have to come down, and by a significant amount in the next year or so.
Thanks Scott. Much appreciated, sir! I imagine that the economy in general, and the stock market will suffer too, for a year or two.
Great work as usual Scott. Yes, slow GDP in US due to out of control government spending is the bigger issue, not inflation.
Hi Scott; Is there a relationship between housing and the stock market, in your opinion? than you, sir!
Post a Comment