


Is inflation "running hot" because the January stats on the CPI and PPI were stronger than expected? No. Ups and downs in the monthly data are to be expected, so this is not necessarily something to worry about, especially since the macro picture hasn't changed for the worse at all.
Keep focused on the all-important monetary and macro variables: M2 and interest rates. The M2 measure of money supply is declining, and higher interest rates are increasing the demand for money; this is a one-two punch (an increased demand for a smaller supply of money) which is rapidly snuffing out inflation. Higher rates are having a big impact on the housing market, and the bond market continues to price in low inflation and a positive economic outlook. The dollar remains strong, gold is weaker on the margin, and commodity prices are soft. The result of all of this is that inflation pressures are declining on the margin.
One of the biggest factors behind the January CPI surprise was Owners' Equivalent Rent. Housing is a big component of CPI and it's been very strong of late, but this is almost certainly going to reverse later this year. Meanwhile, there is still no sign of the kind of economic or financial market stress that would trigger a recession.
And now some charts to round out the story:
Chart #1

Chart #1 compares the rate of increase in housing prices (blue line) with the rate of increase in the so-called "Owner's Equivalent Rent," (red line) which comprises more than one-third of the CPI. I've shifted the red line about 18 months to the left in order to show that changes in housing prices take about 18 months to show up in increases in OER. This means that the 2021 increase in housing prices is now boosting the CPI today, and this will likely be the case for at least the the next several months. But the chart also shows that there has been a significant slowdown in the rate of home price appreciation which began almost a year ago, so at some point—later this year—the OER component of the CPI will drop considerably. Worrying about the January "jump" in CPI inflation just doesn't make sense. You have to look at where the CPI is going to be going over the course of this year, and that is very likely to be in the direction of lower inflation.
Chart #2
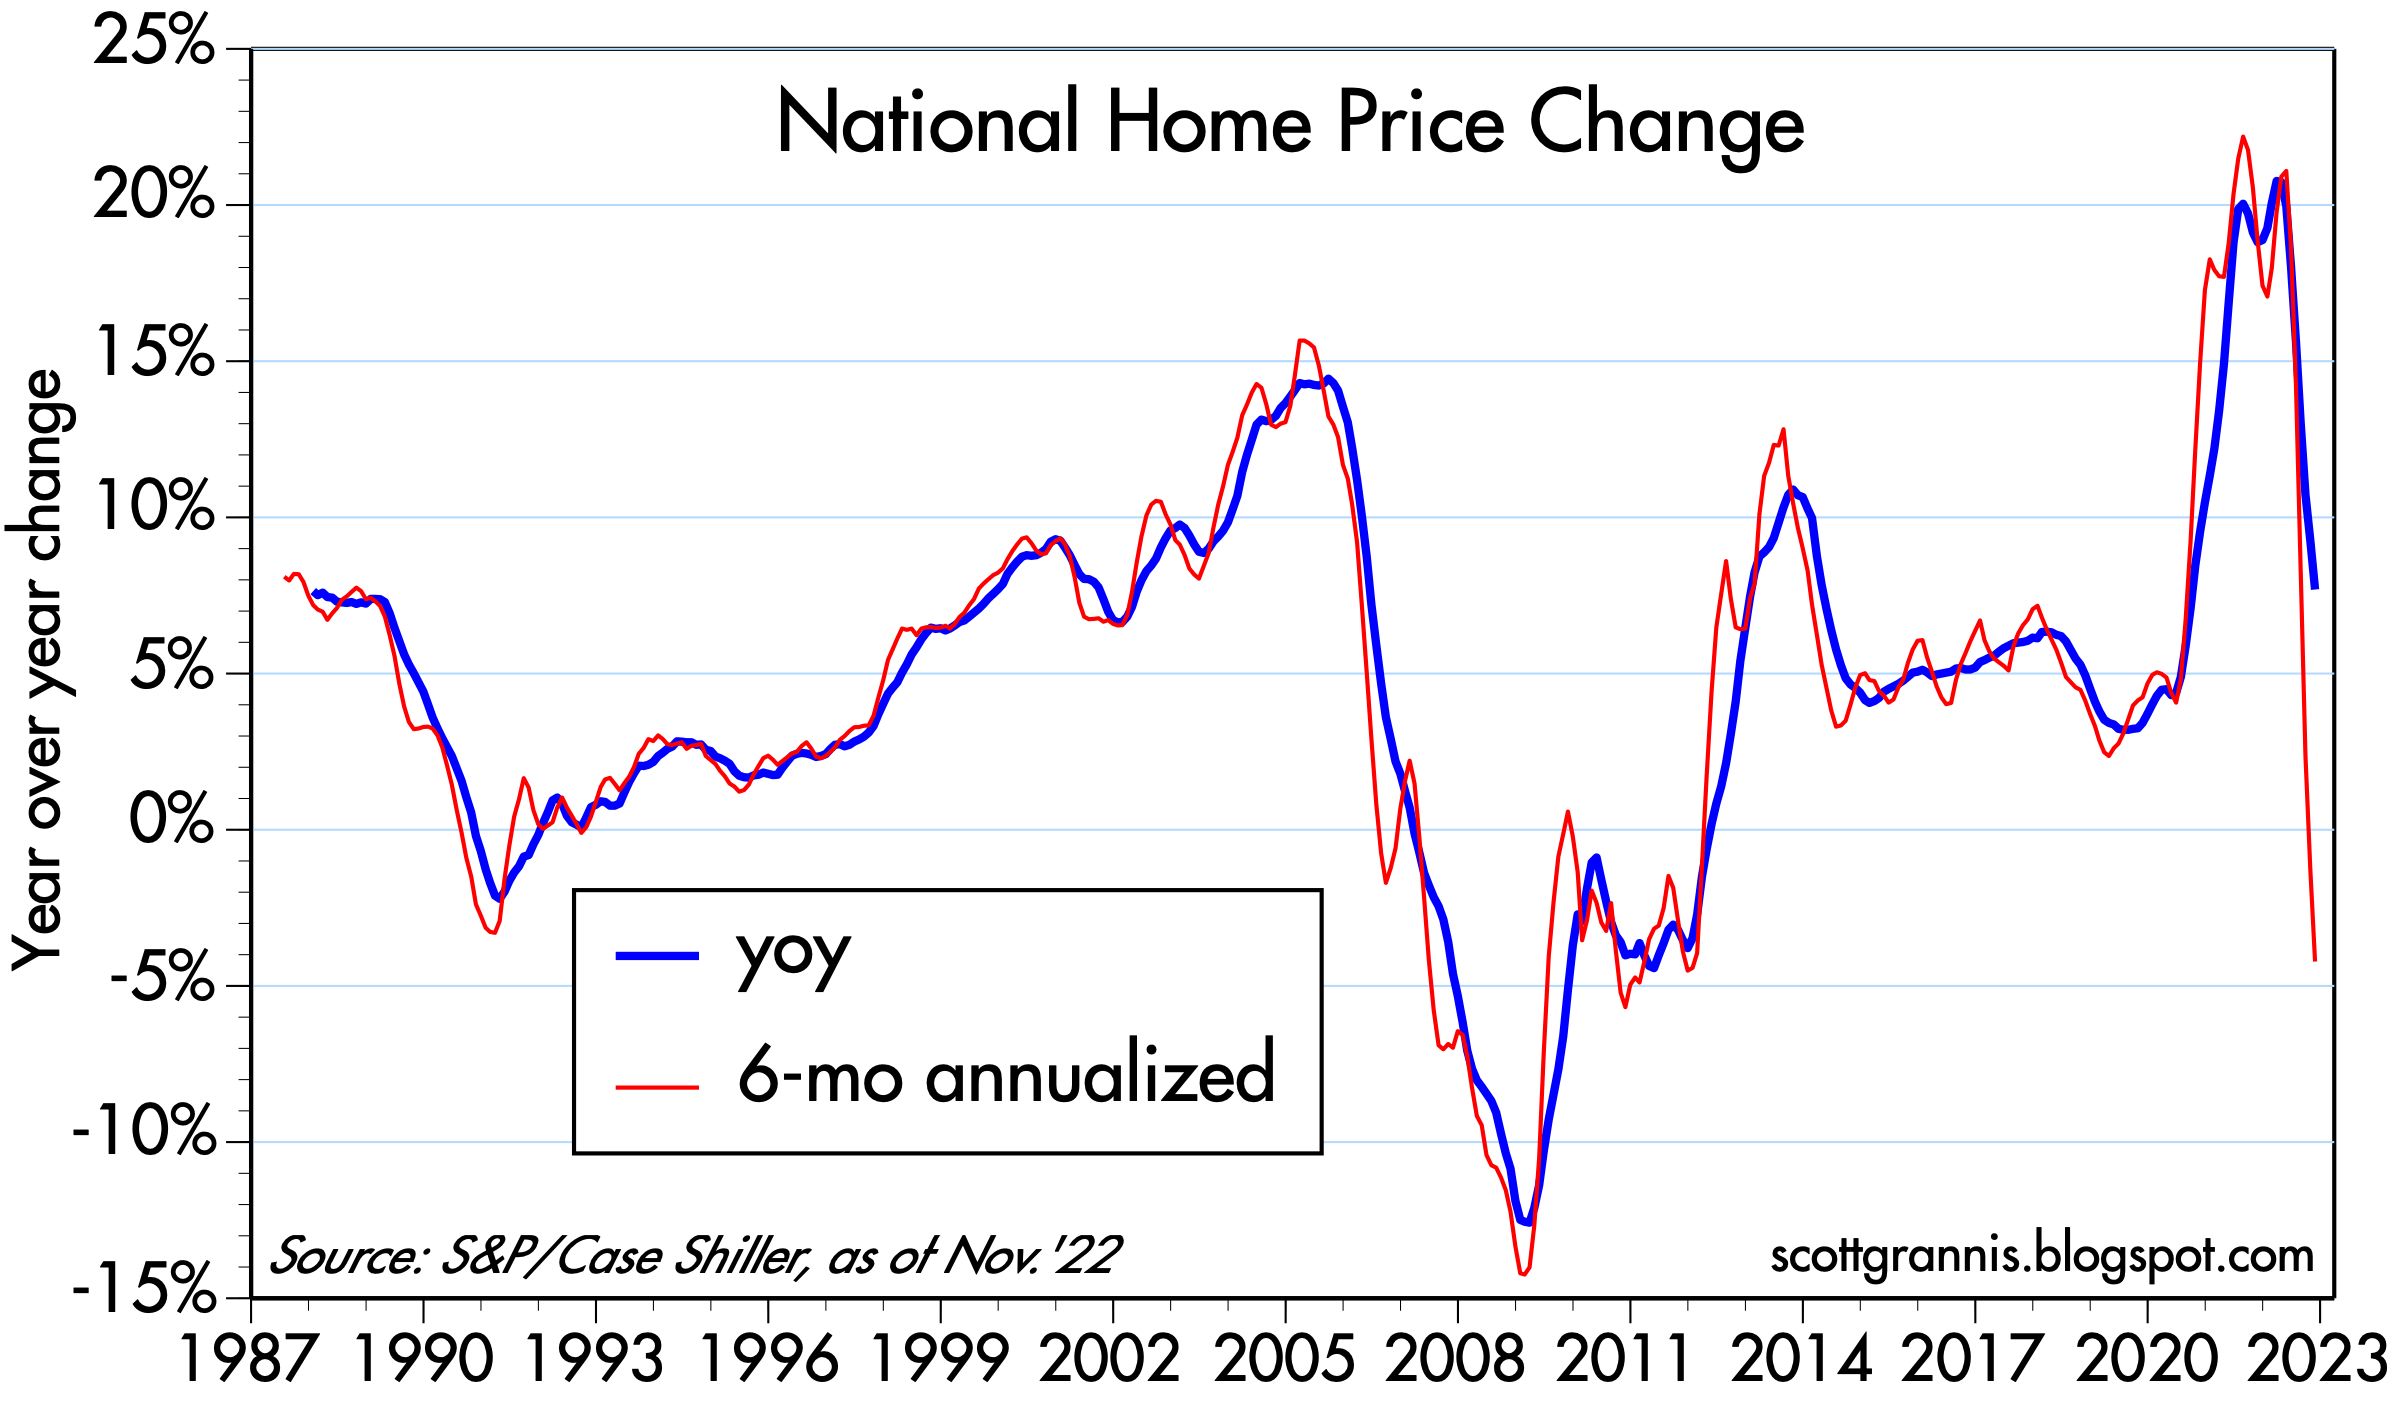
Chart #3
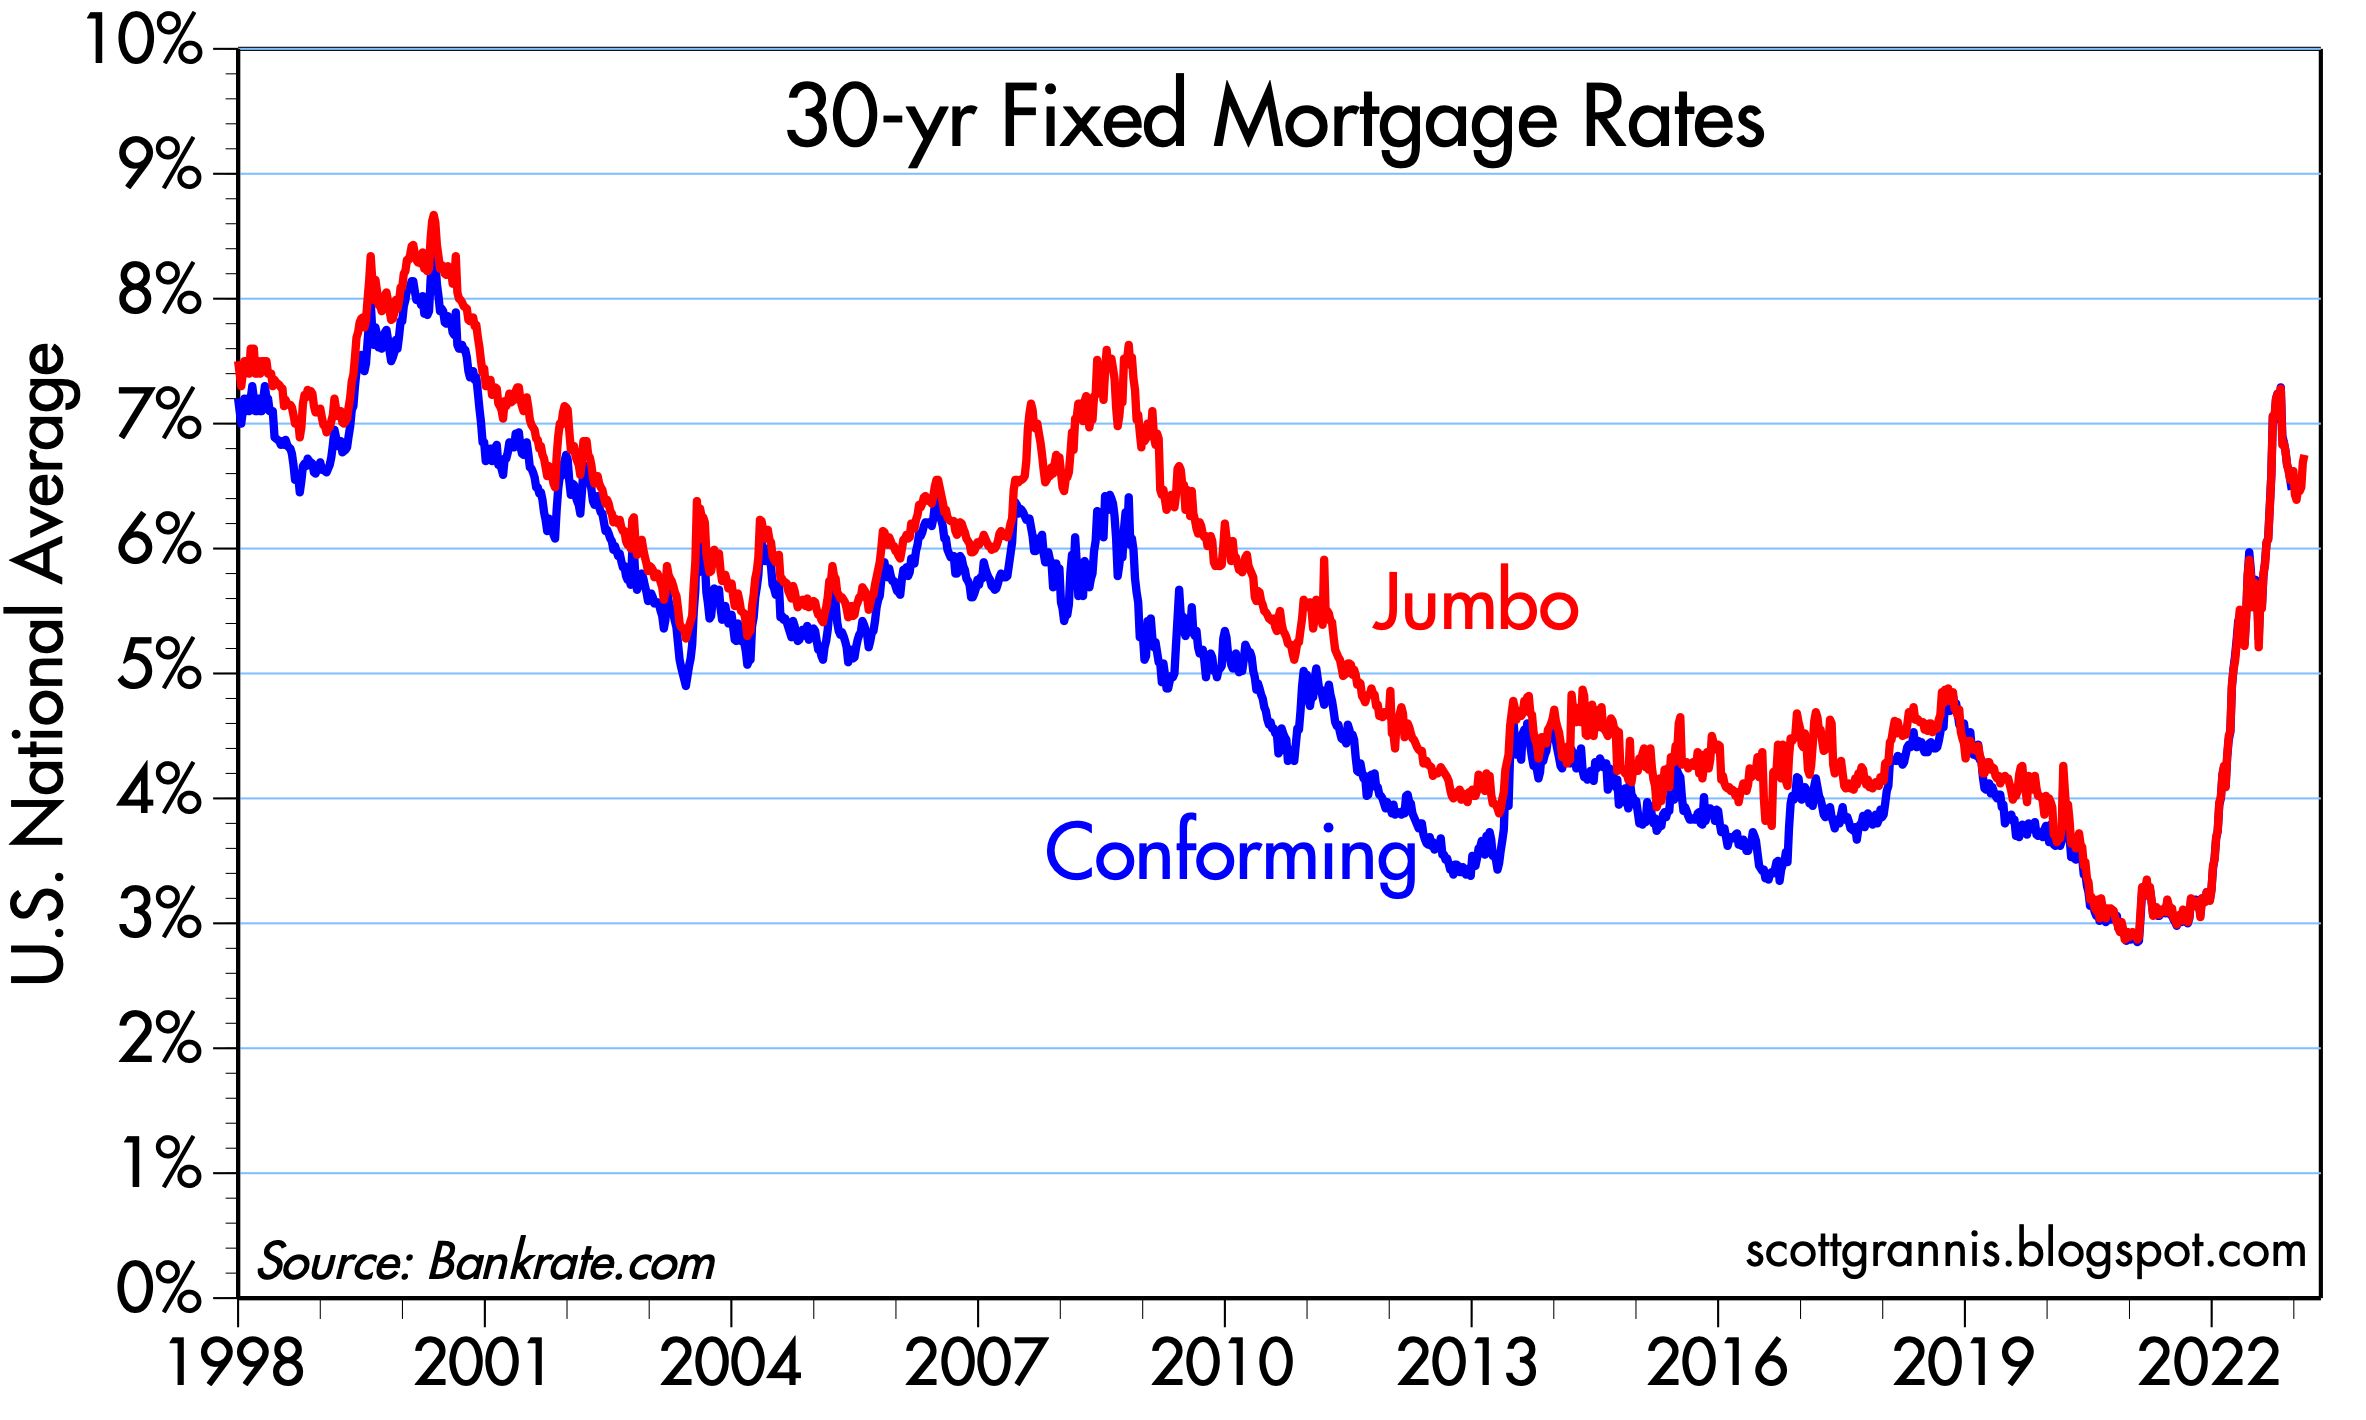
Chart #3 goes a long way to explaining why housing prices have dropped this past year. 30-yr mortgage rates have more than doubled. In fact, we've never seen mortgage rates increase so fast by so much. In turn, that has dramatically increased the cost of home ownership, on top of the increased level of prices. Housing has become unaffordable to millions of families in a relatively short period.
Chart #4

Chart #5

Chart #4 shows just how much the slowdown in housing has impacted residential construction. Housing starts have fallen 27% since their April '22 high, and homebuilders' sentiment as all but collapsed. As Chart #5 shows, building permits are down 30% since the end of '21, though they have been relatively flat for the past 3 months. It's a meaningful decline, but it's not likely to be a replay of the housing market collapse that led up to the 2008 financial crisis. There has been no overbuilding of homes, and Congress has not encouraged the banks to lend to marginal borrowers.
In short, there has been a massive adjustment in the housing market to higher interest rates, and it's going to put lots of downward pressure on the CPI starting later this year.
Chart #6

As the red line in Chart #6 shows, producer prices in January also surprised to the upside, but I strongly doubt this marks a change in the downward trend. The year over year measure continues to decline, and the 6-mo. annualized rate remains quite low, even though it ticked up in January.
Chart #7

Chart #8
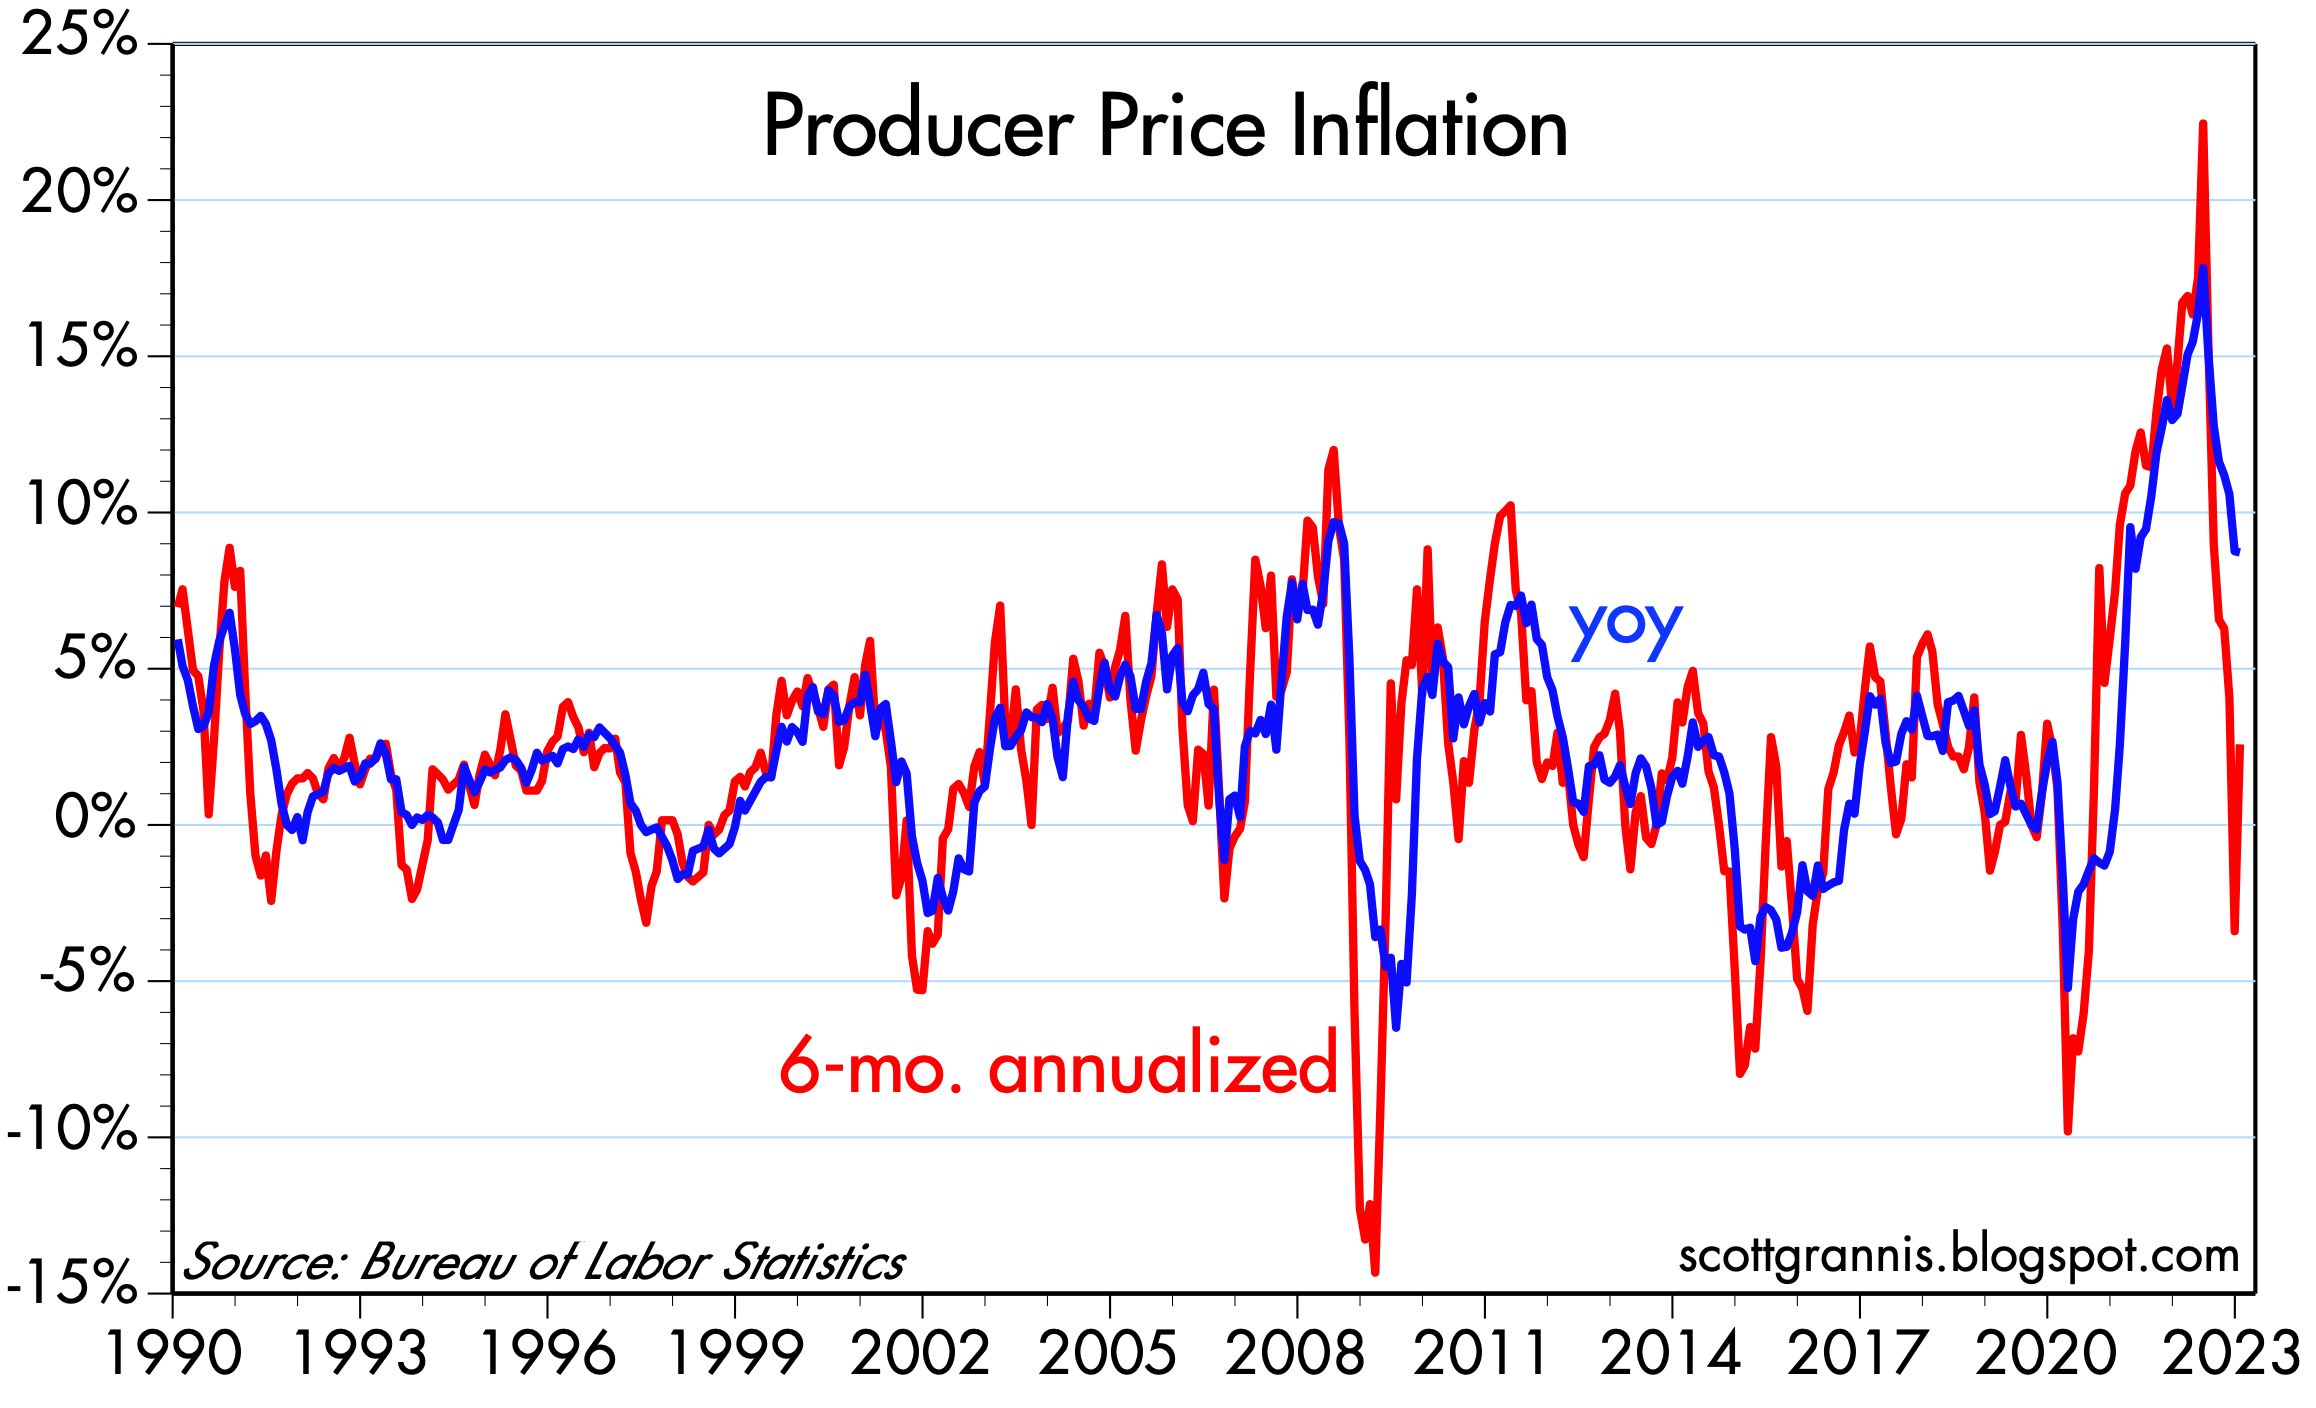
Chart #9

Chart #9 compares the year over year growth rate of M2 (blue line) with the year over year growth in the consumer price index (red line), the latter being shifted one year to the left in order to show that it takes a year or so for changes in M2 to show up in changes in inflation. The decline in M2 this past year strongly suggests that CPI inflation will continue to fall over the course of this year. Steve Hanke and John Greenwood recently wrote about this in the WSJ, and they echo many of the things I have been saying in this blog. We have been on the same M2 page for a long time. (But I'm not quite as concerned about recession as they are.)
Chart #10

Chart #10 shows the Baltic Dry Index, which is a proxy for dry bulk shipping costs around the world. What it shows is that shipping bottlenecks have almost completely disappeared, and shipping costs have plunged. This augurs well for future world trade and prosperity, as well as lower input costs for many goods. The global economy is most definitely NOT "running hot."
Chart #11

The Fed's drive to push rates higher has made a significant difference in the inflation fundamentals, because they have dramatically altered the incentives to borrow, spend, and hold money. Higher rates have NOT adversely impacted the economy like they have in the past, moreover. Why not? Because the Fed has limited its tightening to interest rates while leaving an abundance of bank reserves in the system. It's not really the case that money is "tight" in the sense that it's hard to come by. The Fed has responded to the abundance of liquidity (and the 2020-2021 surge in the M2 money supply) by dramatically increasing (using the tool of higher interest rates) the world's incentives to hold on to money rather than to just spend it wantonly. And it's working.

15 comments:
Prescient. 21 months of the CPI > 5%. Incomes haven't kept up. Money has done a lot of damage. Money is not neutral. It affects real variables too.
Recessions occur when the short-term rate-of-change in money flows, the volume and velocity of money, decelerate, turn negative. That would portend a drop in Vt.
With O/N RRPs @ 2023-02-17: 2,059.662 There’s no shortage of cash. There's a surfeit of savings over investment opportunities.
Hi Scott - I enjoy your analysis. Thank you for your blog. I'd be interested to know how you would quantify the effect of quantitative tightening on the interest rates or any other important effects.
If there wasn't a floor on interest rates (the O/N RRP award rate), there'd be negative short-term nominal interest rates.
Thanks for the discussion of the economy vs. debt/interest rate markets.
"The Fed has responded to the abundance of liquidity (and the 2020-2021 surge in the M2 money supply) by dramatically increasing (using the tool of higher interest rates) the world's incentives to hold on to money rather than to just spend it wantonly. "
I do empirical work which gets reduced to math for investment buy/sell signals. They are of course correlated to the economy. Right now, the economic indicators I watch are still weakening, but the investment markets flashed some buy signals back in October. There are some more investment market signals that are near to flashing buy- even while the economy seems to be weakening. These signals can reverse in the matter of weeks-to months.
The variables never exactly reproduce past cycles, so vigilance is basically always called for.
Thanks again.
Kevin’s: I too see signs of economic weakness (faltering industrial production, very weak sentiment indicators, big slowdown in housing and construction, inverted yield curve). But I also see important signs of economic health: falling swap, credit and default swap spreads, falling implied volatility (Vix index), corporate profits steady, very low default rates, a relatively strong dollar, and a cautious recovery in equity markets. Above all, I see abundant liquidity, which is essential for markets to function. Markets are capable of lots of things if they are allowed to operate freely.
gkaufman (“quantify the effect of quantitative tightening on the interest rates or any other important effects.”)
I would begin by challenging the notion that the Fed is applying quantitative tightening. Bank reserves have fallen moderately, but they are still extremely abundant by historical standards. By that measure we still have quantitative easing to some degree. The Fed is controlling interest rates not by withdrawing reserves from the banking system (as they used to prior to 2008) but by paying interest on bank reserves (which they never did prior to 2008) and by offering to pay the same rate to numerous counterparties via reverse repo operations. This effectively sets a floor on short-term interest rates. But all other interest rates are free to find their own level. So many things are different this time around!
I hope the Fed goes easy, and tolerates above target inflation for a couple of years.
The Reserve Bank of Australia has a 2% to 3% target-band. The People's Bank of China has an "about" 3% target. India has a 4% target, plus or minus 2% (and terrific real growth, btw).
Great post by Scott Grannis once again.
I hope either party comes up with a centrist, sensible, alert, pro-business kind of person in the next presidential election.
Scott: “all other interest rates are free to find their own level”
I have been thinking this same thing. It seems the only entities bearing the cost of higher interest rates are the Fed (paying the bill on Reserves and Reverse Repo) and, for the time being, housing. What is to stop banks from realizing that they can loan money at rates below the Reserve rate, at whatever rates allow them to fill their book of business (within their capital requirements)? This goes for mortgage lenders as well? (i.e. did the knee jerk reaction of mortgage rates going so much higher than treasuries really make sense? I have not heard of any great explanation yet).
Generally speaking, since banks no longer have any reserve requirements, how can the Fed control rates very much - so long as banks stay within their capital requirements?
Generally speaking, since banks no longer have any reserve requirements, how can the Fed control rates very much - so long as banks stay within their capital requirements?--Richard H.
Well, the Fed pays risk-free interest on reserves. So, if bank can make more (risk-adjusted) profit by sitting on reserves than by extending loans...
BTW, when commercial banks n thrifts extend loans, they essentially print money....
Side note: The commercial banks have a rather nice arrangement. By doing nothing, they can collect money from the federal government(meaning, you and me).
Thanks Benjamin.
Yes, but can't the banks have their cake and eat it too? i.e. get their interest on Reserves, and make more money on new loans at whatever (lower) rates the market will bear ...
@Benjamin
What do you think would happen to reference short term interest rates if the Fed would not pay interest on reserves, at this point?
An uptake in inflation:
https://fredaccount.stlouisfed.org/public/dashboard/77560#:~:text=PCE%20Inflation%20%28Fed%27s%20Preferred%20Measure%29%205.0%25%20Change%20from,FRED%20Core%20PCE%20Inflation%20%28Fed%27s%20Preferred%20Measure%29%204.4%25
The strict quantity theorists regard the velocity of money as a datum which can be ignored in the long run. This implies no long-term up or down trend in velocity. The data does not support this assumption. It is evident that the differences in Vt are so pronounced, and the periods involved of such length, that no theory which ignores changes in velocity can purport to be an accurate explanation of the role of monetary forces in the economy.
See: “The Case of the Missing Money” STEPHEN M. GOLDFELD Princeton University
See: Velocity: Money’s Second Dimension – By. Bryon Higgins
“Money has a ‘second dimension’’, namely, velocity . . .. ” Arthur F. Burns in Congressional Testimony.
See: “Quantity leads and velocity follows” Cit. Dying of Money -By Jens O. Parsson
See: “Was the 1982 Velocity Decline Unusual?” – by JOHN A. TATOM
It is obvious that money has no significant impact on prices unless it is being exchanged.
In Alfred Marshall’s “Cash Balances Approach” (the demand for money), K = “the length of the period over whose transactions purchasing power in the form of money is held”. K is related to Vt; it is the reciprocal.
O/N RRPs hit 2022-12-30 2553.716. On 2023-02-24 they were 2142.141. That's a significant easing of monetary policy.
The O/N RRP turned outside money into inside money. Contrary to the FED’s spurious accounting, re: “the bond underlying the repo transaction is still recorded on the Fed balance sheet”, O/N RRPs have become expansionary.
That, of course, is an accounting error according to the Federal Reserve Bank of Chicago’s “Modern Money Mechanics”. “If the buyer of a reverse repo or a security sold by the Fed is a nonbank (which 90% of RRPs are), and pays for the purchase using its bank account, the money supply is directly affected”.
Dear Scott,
Your commentary is terrific and you make the case for lower rates elegantly. What’s been left out of any discussion on rates is the rate of change over the past year. 1 year note + 130X and 2 year note up 12X. Not sustainable.
If GameStop (up 40X in 2021) was the poster child for the excess resulting from transfer payments, the Fed’s takeaway trumps that.
Clay
Post a Comment