


Some charts that help put things into perspective:
Chart #1

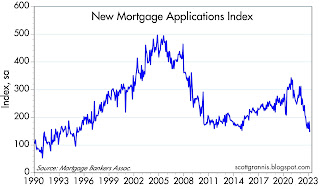

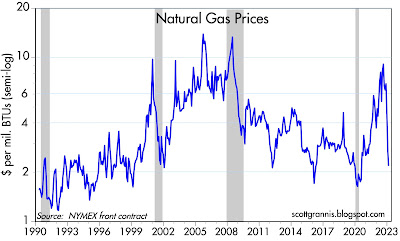
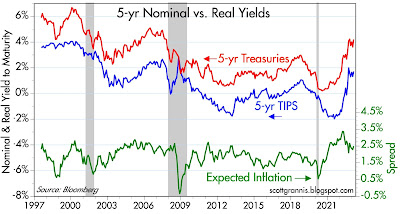
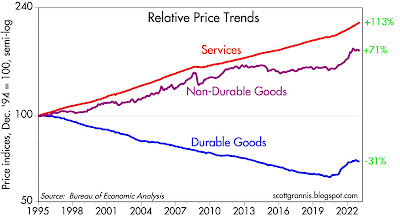
Chart #1

Chart #1 shows that existing home sales have fallen by 36% in the past year. This is extraordinary. Given the lags in reporting this data, the reality is likely worse. We are in the midst of dramatic weakness in the housing sector.
Chart #2

Chart #2 shows the likely culprit: a once-in-a-lifetime surge in the cost of borrowing money to buy a house. 30-yr fixed rate mortgages are now back to 7%, which is more than double the level that prevailed just over a year ago. Combined with rising home prices, this has increased the cost of buying a house by at least one-third in a very short time span. It's likely that the market has not yet had time to fully adjust to this new reality. It can only mean further weakness in the housing market.
Chart #3

Chart #3 shows that applications for new mortgages have dropped an astonishing 58% in the past year. The Fed missed the signs of rising inflation (they should have been watching M2 growth years ago) and now they have slammed on the brakes and are talking tough. Sharply higher interest rates, in turn, have dramatically affected the public's ability and willingness to buy a home. There is no question that monetary policy has had a dramatic impact on the real economy and on prices. Conclusion: the Fed should stand pat and watch how things evolve from here.
Chart #4

Chart #4 compares the level of 30-year fixed mortgage rates (white line) with the 10-yr Treasury yield (orange line), and the spread between the two (bottom half of the chart). This is what happens when bond yields surge unexpectedly: investors in bonds and mortgages have been burned (it's been the worse bond market in many lifetimes) and now they are twice shy. Demand for these securities has collapsed, pushing mortgage rates to an almost-unprecedented level above that of 10-yr Treasury yields. Normally this spread would be about 150-200 bps, but now it's over 300. The bond market has amplified the Fed's tightening efforts. It's VERY expensive to borrow at fixed rates these days.
Chart #5

Chart #5 shows that natural gas prices have truly collapsed, falling by way more than ever before in a short span of time. Traders say it's due to warm weather in the East. Regardless, this is an important source of energy for vast swaths of the economy, and it equates to a powerful deflationary force. And let's not forget that oil prices have plunged 35% from their highs last May. It's not just the weather; commodity prices are down across the board over the past 6-12 months. Monetary policy is undoubtedly one of the reasons.
Chart #6

Chart #6 tells us that the bond market feels pretty good about the outlook for inflation. The spread between 5-yr Treasuries and 5-yr TIPS is now less than 2.5%, which means that the bond market expects the CPI to average less than 2.5% per year for the next 5 years. Higher interest rates have convinced bond traders that the Fed has done enough. Chairman Powell, are you listening?
Chart #7

Chart #7 compares the relative prices of services, non-durable goods, and durable goods. What an amazing divergence! Service prices are largely driven by wages, and durable goods prices have fallen thanks in large part to Chinese exports (which began to get underway in 1995). Durable and non-durable goods prices have been flat for the past 5-6 months, while service sector prices continue to rise. The Fed presumably worries that wages and low unemployment rates will continue to drive inflation higher. Do they really want to see bread lines showing up all over the country? Wages don't cause inflation: they are driven by productivity and the imbalances between the supply and demand for money.
As for productivity: since 1995 service sector prices have increased 3 times more than durable goods prices! In rough terms, that means that one hour of the average worker's time today buys 3 times as much in the way of durable goods than it did in 1995. No wonder nearly everyone is able to afford to carry a super-computer, high-end camera, and internet connection in his or her pocket.
Chart #8

Chart #8 shows the year over year changes in the Personal Consumption Deflators (with the Core version being the Fed's favorite measure of inflation). Both rates came in a few tenths of a percent higher than the market expected. Does that sound like inflation accelerating? Or running hot? No. Inflation pressures peaked many months ago. Both of these measures are on track to show year over year gains that are much lower than their current level. It takes time for monetary policy–which is undoubtedly tight—to work its way through the economy. We just need to be patient.
Next Tuesday we'll have the all-important release of the January M2 money supply number. I expect it will show a continued decline, which will strongly reinforce the outlook for slowing inflation in the months to come.

30 comments:
"Conclusion: the Fed should stand pat and watch how things evolve from here."
But you know DAMN well they won't. It's when what the Fed and markets do Vs what they SHOULD do when traders like me make the most critical decisions. As a bond trader (although never treasuries) I expect higher yields and lower prices near term and unlike the recent past, I'm getting paid fairly well to wait a bit.
"Regardless, this is an important source of energy for vast swaths of the economy, and it equates to a powerful deflationary force."
For LNG, it drives most electric companies in the production of electricity. But since they are regulated, the prices the consumers get charged is locked in by the state level Public Utility Commissions on an annual bid basis. So even though NG prices are dropping electic bills will remain high for consumers.
Bullish for electric companies, bad for consumers pockets.
Thanks as always
It took several years for Volcker's inflation to subside. It'll take several years for Powell's inflation to subside. Volcker reaccelerated inflation by mistake - which extended the time inflation receded. Maybe Powell learned something from Volcker's errors.
Powell should have known that the money stock can never be properly managed by any attempt to control the cost of credit. The 1951 Treasury-Reserve Accord should have established that dictum.
Here in California we have the privilege of paying natural gas bills that are three times higher than last year. Why? Because our Guv has banned fracking (which produces tons of natural gas). Also, our utilities are charged with paying for all the inefficient windmills and solar panels that have been built using subsidies from the same utilities.
Green Energy is one big reason our economy is growing at a sub-par pace. It's simply very inefficient and costly.
steve: Powell is capable of changing his mind. He switched from being hawkish at the end of 2018 to being a dove in early 2019.
California energy utility: PG&E
"Green Energy is one big reason"
PG&E has a complex history (in the past~30 years), as do all commercial enterprises that have been "captured" by the government. The bankruptcies (Yes, more than one), are a travesty. I believe PG&E is the biggest utility on the planet.
The PG&E management just bows to the state government now because that government has enough control to bankrupt them practically at will. This is the "new socialism". Socialists say "it's not socialism unless the state owns the business". If there are enough regulations, effectively, the state does own the business, and that's what PG&E is now.
The price of Nat Gas is incredibly low (again). Anybody who doesn't want to optimize their energy usage around this (fantastic!) reality (because of fracking), is not competent.
Thus is the Peoples Republic of California.
Thanks for the post.
As to the bread lines, the tone-deafness of the Fed reminds me of the late 1920s. I hope they ease up before we end up there.
"Powell is capable of changing his mind. He switched from being hawkish at the end of 2018 to being a dove in early 2019."
I mean, I guess anything is possible but he has been so verbose about erring on the side of inflation reduction and the recent numbers have been fairly robust that my strong hunch is more rate increases coming. That market is echoing that opinion.
re: "one big reason our economy is growing at a sub-par pace"
Secular stagnation was predicted in 1961.
“Should Commercial Banks Accept Savings Deposits?” Conference on Savings and Residential Financing 1961 Proceedings, United States Savings and loan league, Chicago, 1961, 42, 43.
“Profit or Loss from Time Deposit Banking”, Banking and Monetary Studies, Comptroller of the Currency, United States Treasury Department, Irwin, 1963, pp. 369-386
Link: The riddle of money, finally solved BY PHILIP GEORGE viz., the corrected money supply
http://www.philipji.com/
The deceleration in the transaction's velocity of funds was predicted in May 1980 by the same author, i.e., the turning point.
“The Depository Institutions Monetary Control Act will have a pronounced effect in reducing money velocity”
From the standpoint of the system, banks don't lend deposits. Deposits are the result of lending/investing. Bank held-savings have a zero payment's velocity.
Never are the commercial banks intermediaries in the savings-investment process. From the standpoint of the entire payment’s system, commercial banks never loan out, and can’t loan out, existing funds in any deposit classification (saved or otherwise), or the owner’s equity, or any liability item. Every time a DFI makes a loan to, or buys securities from, the non-bank public, it creates new money – demand deposits, somewhere in the system. I.e., all deposits are the result of lending and not the other way around.
All monetary savings originate within the payment’s system. The source of interest-bearing deposits is non-interest-bearing deposits, directly or indirectly via the currency route (never more than a short-term seasonal situation), or through the bank’s undivided profits accounts. This is the cause of secular stagnation, the deceleration in velocity.
The correct response to stagflation is the 1966 Interest Rate Adjustment Act. “while the aggregate of time and demand deposits continued to increase after July, the proportion of time to demand deposits diminished. Whereas time deposits were 105 percent of demand deposits in July, by the end of the year, the proportion had fallen to 98 percent. These were all desirable developments.”
M1 peaked @137.2 on 1/1/1966 and didn’t exceed that # until 9/1/1967. Deposit rates of banks decreased from a high range of 5 1/2 to a low range of 4 % (albeit not enough). A .75% interest rate differential was given to the nonbanks.
And during this period, the unemployment rate and inflation rates fell. And real interest rates rose.
See: Dr. Philip George - October 9, 2018: “At the moment, one can safely say that the Fed's plan for three more rate hikes in 2019 will not materialise. The US economy will go into a tailspin much before that.”
Wake up and smell the coffee. The complete deregulation of interest rates was a ruse perpetrated by the ABA. The NBFIs are not in competition with the DFIs. The NBFIs are the DFI's customers. Driving the banks out of the savings business does not reduce the size of the payment's system, as savings flowing through the nonbanks never leaves the commercial banking system. It just results in a redistribution of deposits.
That goes a long way in explaining Scott Grannis' "DEMAND FOR MONEY".
The deceleration in M2 is entirely due to dis-savings (drop in savings deposits relative to means-of-payment money). At some point, this decrease in money demand, temporary rise in Vt, will end.
The volume of currency in circulation is already at recessionary levels.
My two cents is Scott Grannis is right on this one. The Fed can pause and see what happens. A few years of moderate inflation is not the end of the world. It might even reduce the debt to GDP ratio.
Brian Wesbury just said that "if we get more growth than expected in the near-term, that means more pain later on when the recession hits." He also said that "the economic morphine of government checks and loose monetary policy is wearing off", stoking recession fears and ignoring the fact that getting the "morphine" through the system is what ultimately brings inflation down.
I've never seen Grannis and Wesbury this at odds.
Thank you for being the antidote to the antidote to conventional wisdom.
Re Brian Wesbury: I don't think we've ever been in such disagreement. The primary source of the disagreement, I think, is our reading of M2. He sees the decline in M2 over the past year as a serious problem because apparently he believes this means the economy is being starved of liquidity. I see the M2 decline as a welcome reversal of a huge excess supply of money. I think the economy is still chock-full of liquidity, but this problem is receding.
I don't believe the economy is set to boom. I think we'll see sub-par growth (~2%) for the foreseeable future. Brian expects a recession. There are indeed signs that point to a recession (inverted yield curve, sharply higher short-term rates, a big slowdown in housing, low consumer confidence) but there are classic recession signs that don't point to recession (relatively low swap and credit spreads, falling energy prices, real yields that are still relatively low).
Reasonable people can disagree, and this is one of those times.
Dr. Daniel Thornton: "Because the concept of velocity stems directly from the theory of the demand for money, anything that affects velocity can be related to some aspect of the
demand for money."
https://files.stlouisfed.org/files/htdocs/publications/review/87/08/Solving_Aug_Sep1987.pdf
It's very easy to see why two excellent economic minds disagree so much. The cross currents of data are so mixed it almost depends on what you want to find credible. Layoffs galore in tech and RE while robust in leisure, entertainment and travel. Americans are for sure still spending $ like it's hey days and that I find concerning. I tend to believe the bond market over the stock market and a 10 yr yield of nearly 4% and 1 yr bills at over 5% does not give me a comfy cozy feeling. That and I for one do NOT believe the Fed will stand pat (but I agree with Scott that they SHOULD) and as such it's hard to be optimistic near term.
Waller, Williams, and Logan seem to agree. They “believe the Fed can keep unloading bonds even when officials cut interest rates at some future date.”
link Daniel L. Thornton, Vice President and Economic Adviser: Research Division, Federal Reserve Bank of St. Louis, Working Paper Series
“Monetary Policy: Why Money Matters and Interest Rates Don’t”
bit.ly/1OJ9jhU
The FED could stop inflation dead in its tracks. But Powell thinks banks are intermediaries, lending savings to borrowers.
In 2010, the PBOC’s RRR went to 18.5% – “to sterilize over-liquidity and get the money supply under control in order to prevent inflation or over-heating”
The budget impasse will likely have some unplanned tightening:
"Such swings in bill supply would not only make the securities expensive relative to other instruments like overnight index swaps, but also motivate investors that have access to the Federal Reserve’s overnight reverse repurchase agreement facility to park more cash there."
Carl: Thank your most recent help. Sorry I did not get back earlier. I think I get when and how the Fed and/or Banks create money now.
But a couple of house cleaning questions: (for you, or Scott or Salmon, or anyone to answer please).
First, I understand that under normal circumstances Reserves stay only in the banking system.
But what about non-normal circumstances when the public wants their money, i.e. cash and currency? Since Reserves can be turned into currency/coin then it would mean that Reserves really are money as well. After all, the only time things matter is when the sh.. hits the fan in life - that’s when you find out how things really work.
I would also like to ask, as there seems to be some disagreement with readers of this blog, as to whether the Banks create money when they “buy” securities (as opposed to making loans). Would this difference of opinion be resolved by specifying whether the bank is actually buying the security, as opposed to swapping it?
Salmon: I have been reading, and rereading, many of your posts and your reference links.
There are some things though that I still cannot wrap my head around (notwithstanding your metaphor of holding two incongruous ideas in your head at the same time).
Can you give me a common sense explanation, or even strung-out example, as to why changes in Vt (velocity of transactions in the economy) affect prices? Assuming you have some minimal amount of transactions, why would 2X or 3X this make for an increase in prices?
Also, your much emphasized position that “Banks never loan out, and can’t loan out, existing deposits in any deposit classification” I think I understand as:
because banks create deposits through their loans, those deposits cannot themselves be loaned out,
and because they cannot be loaned out you also state the following:
“all DFI held savings are lost to both consumption and investment”
I.e. dead money.
But, to my thinking, this newly created money is the new investment/consumption. Of course it can’t be loaned out again - by the bank at least. You seem to be expecting that this money, like in old fractional reserve banking, should be able to be loaned out again - by the bank??
But this new money will be invested/consumed by the loan recipient. No?
Thank you.
Why changes in Vt affect prices?
The transactions concept of money velocity, Vt, has its roots in Irving Fisher’s truistic "equation of exchange": P*T = M*Vt, where (1) M equals the volume of means-of-payment money; (2) Vt, the transactions’ rate of turnover of this money; (3) T, the volume of transactions units; and (4) P, the average price of all transactions units.
The “econometric” people don’t like the equation because it is impossible to calculate P and T. Presumably therefore the equation lacks validity. Actually the equation is a truism – to sell 100 bushels of wheat "T", at $4 a bushel "P" requires the exchange of $400 "M" once, or $200 "Vt" twice, etc.
The real impact of monetary demand on the prices of goods and services requires the analysis of “monetary flows”, and the only valid velocity figure in calculating monetary flows is Vt. Milton Friedman’s income velocity, Vi, is a contrived figure (Vi = Nominal GDP/M). It is a “residual calculation - not a real physical observable and measureable statistic.” The product of M*Vi is obviously N-gDp.
Remember that in 1978 (when Vt rose, but Vi fell) all economist’s forecasts for inflation were drastically wrong.
Put into perspective: There were 27 price forecasts by individuals and 9 by econometric models for the year 1978 (Business Week). The lowest (Gary Schilling, White Weld), the highest, (Freund, NY, Stock Exch) and (Sprinkel, Harris Trust and Sav.).
The range CPI, 4.9 – 6.5 percent. For the Econometric models, low (Wharton, U. of Penn) 5.7%; high, 6.6% U. of Ga.). For 1978 inflation based upon the CPI figure was 9.018% [and Leland Prichard, in his Money and Banking class, predicted 9%].
The BOE's explanation is convoluted:
https://www.bankofengland.co.uk/-/media/boe/files/quarterly-bulletin/2014/money-creation-in-the-modern-economy.pdf
Double-entry bookkeeping on a national scale proves that banks always create new money when they lend/invest. I.e., if you tally the inputs and outputs to the commercial banking system you will find that they're offsetting. The only conclusion left is that the banks have created new money.
Professional economists have no excuse for misinterpreting the savings investment process. They are paid to understand and interpret what is happening in the whole economy at any one time. For the commercial banking system, this requires constructing a balance sheet for the system, an income and expense statement for the system, and a simultaneous analysis of the flow of funds in the entire economy.
The expansion of bank credit and new money by the DFIs can be demonstrated by examining the differences in the consolidated condition statements for both the banks and the monetary system at two points in time.
Increases in the DFI’s loans & investments/earning assets/bank credit, are initially approximately the same as increases in transaction accounts, & time (savings) deposits, TDs, liabilities (“bank credit proxy”). That the net absolute increase in these two figures is so nearly identical is no happenstance, for transaction deposits, TRs, largely come into being through the credit creating process, & time deposits, TDs, owe their origin almost exclusively to TRs.
There are many factors, which can, & do, alter the volume of bank deposits, including: (1) changes in currency held by the non-bank public, (2) in bank capital accounts, (3) in reverse repurchase agreements, (4) in the volume of Treasury currency issued & outstanding, & (5) in Reserve Bank credit. Although these principal items are largest in aggregate, they nevertheless have been peripheral in altering the aggregate total of bank deposits.
re: “all DFI held savings are lost to both consumption and investment”
I.e. dead money."
It is an extraordinary delusion that banks lend deposits. Princeton Professor Dr. Lester V. Chandler, Ph.D., Economics Yale, theoretical explanation was:
1961 - “that monetary policy has as an objective a certain level of spending for gDp (sounds like N-gDp level targeting today), and that a growth in time (savings) deposits involves a decrease in the demand for money balances, and that this shift will be reflected in an offsetting increase in the velocity of demand deposits, DDs.”
Chandler’s conjecture was correct from 1961 up until 1981 (during the “monetization” of time deposits, the transition from clerical processing to electronic process, and the end of gated deposits).
Thus, the saturation of DD Vt (end game) according to Corwin D. Edwards, professor of economics. [Edwards attended Oxford University in England on a Rhodes scholarship and earned a doctorate in economics at Cornell University. He spent a year teaching at Cambridge University in England in 1932. He taught at New York University in 1954, the Chicago School from 1955-1963, the University of Virginia, and the University of Oregon from 1963-1971.]
Edwards: "It seems to be quite obvious that over time the “demand for money” cannot continue to shift to the left as people buildup their savings deposits; if it did, the time would come when there would be no demand for money at all”
That is, as stagnant (or frozen) time deposits became unhinged (the deregulation of Reg. Q ceilings), the velocity in the residual deposits were to be an offset in AD. The increased “demand for money” would thus be compensated in the turnover of the ungated transactions’ deposits.
Leland Pritchard, Ph.D., Economics, Chicago, 1933, M.S. Statistics, Syracuse: “It seems highly improbable (and in contradiction to Professor Chandler’s theoretical analysis, that the stoppage in the flow of these funds is entirely compensated for aby an increased velocity of the remaining demand deposits. It is quite probable that the growth of time deposits shrinks aggregate demand and therefore produces adverse effects on gDp.”
So we see why Dr. Philip George's "The Riddle of Money Finally Solved" works:
Dr. Philip George - October 9, 2018: “At the moment, one can safely say that the Fed's plan for three more rate hikes in 2019 will not materialise. The US economy will go into a tailspin much before that.”
Pritchard said the same thing 30 years earlier:
This results in a double-bind for the Fed (FOMC schizophrenia: Do I stop because inflation is increasing? Or do I go because R-gDp is falling?). If it pursues a rather restrictive monetary policy, e.g., QT, interest rates tend to rise.
This places a damper on the creation of new money but, paradoxically drives existing money (savings) out of circulation into frozen deposits (un-used and un-spent, lost to both consumption and investment). In a twinkling, the economy begins to suffer.
So, secular stagnation is nothing other than the deceleration in the velocity of circulation, or as Martin Wolf says: "chronically deficient AD").
Japan is unique in that the Japanese save a higher proportion of their income, and then keep a higher proportion of that savings in their banks. But all bank-held savings are frozen. Bank-held savings have a zero payments velocity. That's why income velocity in Japan is .55 and in the U.S. it is 1.12.
“Japanese households have 52% of their money in currency & deposits, vs 35% for people in the Eurozone and 14% for the US.” The BOJ also has unlimited transaction's deposit insurance.
From the standpoint of the individual banker his institution is an intermediary. An inflow of deposits increases his bank’s clearing balances, and probably its legal reserves – and thereby it’s lending capacity. But all such inflows involve a decrease in the lending capacity of other banks, unless the inflow results from a return flow of currency to the banking system or is a consequence of an expansion of Reserve Bank credit.
"it seems that the modification of Regulation D in late April has effectively rendered savings accounts almost indistinguishable from checking accounts from the perspective of depositors and banks. Accordingly, the composition of M2 between M1 and non-M1 components conveys little economic information."
The FRED Blog
What's behind the recent surge in the M1 money supply?
https://fredblog.stlouisfed.org/2021/01/whats-behind-the-recent-surge-in-the-m1-money-supply/
You'd have to go back to 2010 to find the rate-of-change in currency in circulation this low.
The new money #'s are contractionary.
Scott,
As usual enjoy your blogs and thought provoking graphs. Three charts though caught my eye and am looking for your thoughts on my take on them. First, sales of single family homes and applications for new mortgages are down sharply and your take is that it is deflationary. As I travel around, I notice very few places for sale. It appears that with a shortage of labor, very few people have financial problems and need to sell. In addition almost everybody has refinanced with mortgage rates below 3% so they have no interest in moving to a new place with a 6-7% mortgage. Cash sales are also taking up a larger portion of sales as people have so much equity in their houses. We still have a housing shortage in this country as building is expensive and slowing down due to high interest rates. As a result I see little decrease in housing prices.
The third chart is the price of natural gas which has dropped 75% to a level that discourages production. The main for the drop in inflation from 9.2%to 6.4% has been due to energy prices dropping sharply. Prices are at such a low level that further decreases are unlikely and now would not directly affect further drops in inflation. In fact increases are occurring now and actually putting pressure on raising inflation.
Re housing: As I see it, the market is "frozen" for the time being at levels that are unsustainable for much longer. The combo of high prices and very high mortgage rates has made housing extremely unaffordable for the average person. So there is a shortage of buyers. At the same time, sellers realize that if they need to buy another home it will be with a much higher mortgage rate, so there is a dearth of sellers. Eventually, prices will need to fall and interest rates will need to fall in order for an equilibrium to be restored, and for the market to clear. How long that will take is anyone's guess.
@George B
What would you say then is the main reason for the drop in any Core measure (PPI, PCE, CPI, etc.)?
All of those measures strip out energy and are still trending down in obvious fashion. I think its helpful to view the price of energy more as noise that detracts from the trend, rather than information relevant to the overall nature of price movements.
Thank you Salmo for taking the time.
You say: “to sell 100 bushels of wheat "T", at $4 a bushel "P" requires the exchange of $400 "M" once, or $200 "Vt" twice, etc”.
But why is Vt inserted here; shouldn’t this also be “$200 “M” twice”. That is, yes the transaction is happening twice, but it is still “M” of $200 we are talking about.
Anyway, I was hoping for an actual example of velocity pushing prices, as opposed to Mr. Fischer’s equation (i.e. yes, the equation is true if in fact velocity pushes prices, assuming constant money supply) (i.e. the equation is self-referential without proving this). So, I still don't fully understand why an increase in the velocity of transactions necessarily increases prices.
I would be curious what other readers of this blog think about this. What would Milton Friedman think of Vt, with respect to prices?
Post a Comment