


As I've argued in recent posts, there's plenty of evidence to suggest the Fed has already tightened by enough to bring inflation down: the dollar is super-strong, real yields have risen sharply, the yield curve is inverted, commodity prices are plunging, and the housing market has run into a brick wall. Yet the Fed seems determined to tighten even more. I think they're driving by looking into the rear-view mirror. They're trying to burnish their reputation as an inflation fighter, after having fallen miserably behind the inflation curve in 2020 and 2021. And I think that the long-discredited Phillips Curve (which posits that unemployment must rise if inflation is to fall) still haunts the Fed governors' minds. It's all so unfortunate.
Fortunately, however, a recession is neither imminent nor inevitable. Industrial production and jobs are still growing at decent rates, 2-yr swap spreads are still in normal territory, and real interest rates are not prohibitively high. But the economy could fall into a recession if the Fed doesn't change course (aka "pivot") before too long. There's a precedent for this—in January 2019, when the Fed realized it had become too tight and reversed course—and I don't see why they can't do it again.
Chart #1
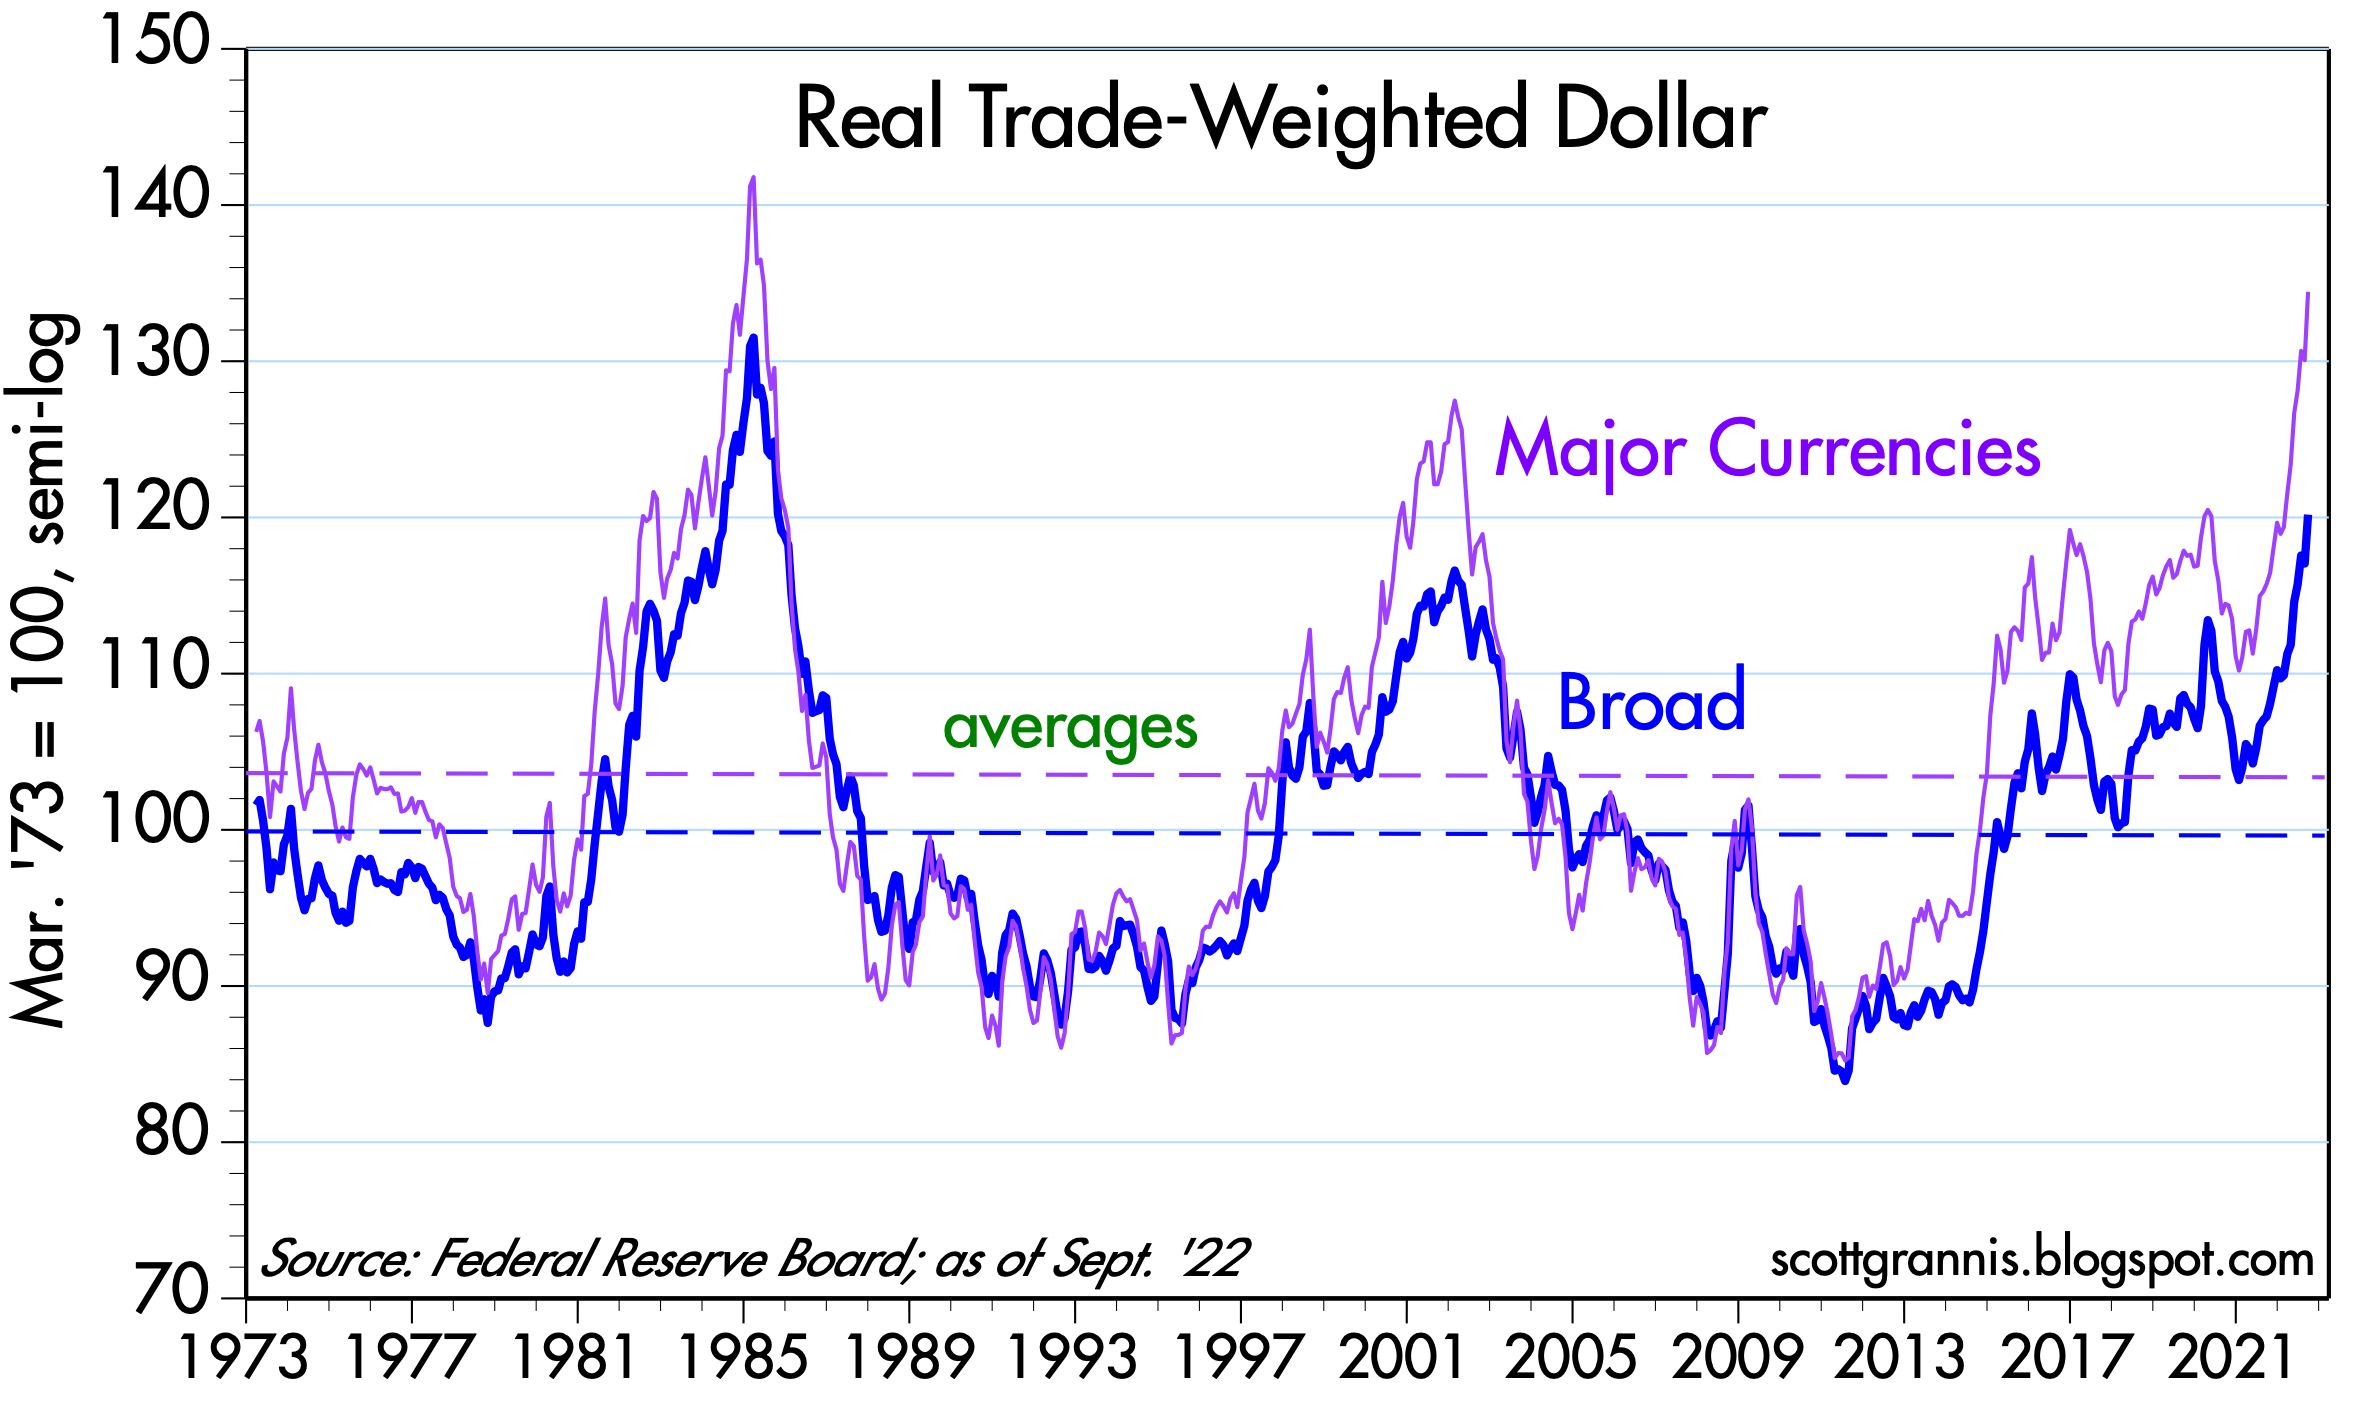
Chart #1 shows two measures of the inflation-adjusted and trade-weighted value of the dollar. By any measure the dollar is very strong. This is fully consistent with US monetary policy being tight and much tighter than that of any other major economy. Demand for dollars is strong, and there is no shortage of reasons for why that is so: geopolitical turmoil in Europe and East Asia would surely suffice. From an economics point of view, it would be highly unusual for a very strong currency to also be experiencing inflation (otherwise known as a loss of purchasing power). Prices all over the world, when translated into dollars, are falling.
Chart #2

Chart #2 compares the inflation-adjusted value of gold (red line) to the inverted value of the dollar (blue line). Big moves in the dollar's value almost always accompany inverse moves in commodity and gold prices. What's striking about today is that gold and commodity prices have not fallen further given the strength of the dollar. Long-time readers will note that this chart, which has appeared many times in recent years, has correctly predicted falling gold prices.
Chart #3

Chart #3 compares the nationwide average rate for 30-yr mortgages (orange line) to an index of new mortgage originations (mortgages taken on to finance the purchase of a new home). Mortgage rates have doubled this year, and new mortgage originations have fallen by half. That's a huge development! In other words, soaring mortgage rates combined with very high prices have dealt a heavy blow to the housing market. This is a perfect example of how higher interest rates can change incentives and also slow the economy. People today are much less willing to borrow (which implies higher money demand) and much less willing to buy (which also implies a demand for cash rather than goods. The sharply increased demand for money is acting directly to neutralize much of the extra M2 money supply that was created a few years ago. And that, in turn, means declining inflation pressures. (Recall that M2 has been flat for the past 9 months or so.)
Chart #4

Chart #4 compares housing starts (blue line) with an index of homebuilders' sentiment. Sentiment has plunged in recent months as homebuilders have seen a sudden slowdown in home purchases. In the past, sentiment has often been a very good predictor of housing starts. We could be on the verge of seeing a big slowdown in residential construction, and that would be a surefire contributor to a recession. Chairman Powell, please take note!
Chart #5

The top portion of Chart #5 compares the average rate on 30-yr mortgages (white line) with the yield on 10-yr Treasuries (orange line). The bottom portion shows the difference between the two, which looks to average about 150 bps in normal times. The spread today, in contrast, is over 300 bps; no wonder the housing market is in trouble. As the bottom chart also suggests, such peaks in spreads is typically short-lived, since they most likely reflect panicked selling and hedging by institutional players. Something is likely to change before too long, and it's likely that mortgage rates and spreads to Treasuries will decline.
Chart #6

Chart #6 compares the value of the dollar (orange line) with the real yield on 5-yr TIPS. As I've noted before, 5-yr real yields on TIPS are equivalent to the market's expectation for what the real Fed funds is going to average over the next 5 years. Real yields have soared by almost 400 bps in just over a year, which is not only unprecedented but also indicative of an extreme tightening of monetary policy. It's sort of like giving a horse tranquilizer to a mildly psychotic patient. Please, Chairman Powell, enough is enough!
Chart #7

Chart #7 compares an index of U.S. industrial production with a similar one in the Eurozone. Without a big decline in industrial production it is very unlikely that the U.S. economy is experiencing a recession. And so far, industrial production continues to grow. The Eurozone economy has been battered by the Ukraine conflict and soaring energy prices, yet industrial production has yet to decline. Both economies have an urge to recover what was lost to the Covid shutdowns.
Chart #8

Chart #8 shows the level of private sector non-farm employment, which continues to grow at a healthy pace. Recessions are famous for throwing people out of work, but we have yet to see any sign of that in the U.S. economy.
Chart #9

Chart #9 shows the level of 2-yr swap spreads, my favorite indicator and predictor of the health of the U.S. economy and financial markets. Swap spreads are still within a "normal" range, which implies that liquidity is still abundant and the corporate profits and the economy are likely to remain reasonably healthy. As the chart suggests, swap spreads would have to rise appreciably before one might expect to see a recession on the horizon. Note also that swap spreads have tended to decline in advance of recoveries.
Chart #10

Chart #10 is my favorite recession "dashboard," since it tracks two key indicators of monetary tightness and how they interact to produce recessions. Every recession here was preceded by an inversion of the yield curve (red line) and a significant rise in real short-term interest rates (blue line). As I noted in Chart #6, the market expects the Fed to raise short-term real interest rates (a key measure of Fed tightness) to at least 2% in coming years, but that has yet to happen, and so far the yield curve is only mildly inverted. To be fair, I'd score this chart as tentatively predicting a recession within the next year or so.
Summing things up, there is little doubt that the Fed has already tightened monetary conditions to a significant degree. Sensitive prices (e.g., the dollar, commodity prices, gold) have turned down meaningfully, which alone would be a decent indicator of lower inflation to come. It would be a real shame if the Fed were to continue on its present tightening course in the belief that only by crippling the economy (e.g., higher unemployment, falling industrial production, and a collapsing housing market) can they hope to get inflation back under control.
My recommendation would be for Dr. Powell to give the economy a "tincture of time," not higher interest rates.

14 comments:
Add on:
The yen is trading at 150 to the greenback, compared against 115 to the USD at the start of the year.
You are talking about 30% appreciation of the USD against the yen.
While I vicariously enjoyed Scott Grannis' bigdollar-days in Argentina, one might wonder if the USD is "too strong."
And now comes QT? Sopping up more greenbacks?
Plan your overseas vacations, but there could be ramifications of a too-tight Fed, as outlined by Grannis.
I think a jihad against QT is warranted.
Scott,
Thank you for the creation of chart #10. It is one that I have used in my own work for a number of years now.
Back in April of this year, the last time you posted this chart, you were of the opinion that it would take both an inverted yield curve and a significantly positive real fed funds rate to induce a recession. Given that most things in the economy and investment markets are relative, my concern at the time was that it would not take a positive real fed funds rate to tip us over, just a significant increase in that rate. It has now increased 4%, which is roughly what it did prior to the 2001 and 2008 recessions. Credit is not absolutely tight, but it is tighter, and I believe that will be enough to cause a recession, and a particularly nasty one if the Fed continues to raise rates at this pace.
I really appreciate your analysis. Frankly, it's one of the few honest ones out there that my limited education can consume. Other conservatives want to howl about recessions when a Democrat is in office, but you simply follow the data and that means a lot to me.
Just for grins, I read Zero Hedge as well to find out how I'm going to die this week. :-)
Thanks K T. I try to be as objective as possible, since one of the reasons I write this blog is to force myself to examine all the data and all the facts so as to come to a conclusion that will guide my own investing. It's just good discipline. I don't want politics to shade my conclusions, but I do have a strong bias to policies that align more with conservatives than with Democrats. Like free markets, limited government, less regulation, and less taxation. I have that bias because my 40+ years of experience have convinced me that those policies deliver stronger, more productive economies.
Thank you Scott for another great article.
I guess the US Treasury bonds can comprise a good investment opportunity now, especially those bonds with higher duration. As inflation is set to wane in the forthcoming months, there may be no need for further tightening - this is your conclusion from your article "Everything's down except inflation" in which you describe a vast array of disinflationary factors, most notably flat money supply and strong US dollar. I am sure FED is well aware of that, but the broad market may not, which may drive yields even higher. I hope that sooner, or later the market will figure out that too.
re: "it would take both an inverted yield curve and a significantly positive real fed funds rate to induce a recession"
That's because the FED's Ph.Ds. don't know a credit from a debit. Banks are not intermediary financial institutions. An inverted yield curve induces nonbank disintermediation, a decrease in the volume of loanable funds which will drive real rates higher.
Powell has destroyed deposit classifications, isolated money intended for spending, from the money held as savings.
The recipe was the fallacious Gurley-Shaw thesis.
“substitutability between money and wide range of financial assets, also called near- moneys”
“an appropriate definition of money must include the liabilities of non-bank financial institutions.”
R * revolves around the activation of monetary savings. The impoundment of monetary savings lowers R * and vice versa.
Make no mistake, the economic engine is being run in reverse. The Keynesian economists have achieved their objective, that there is no difference between money and liquid assets.
re: "plenty of evidence to suggest the Fed has already tightened by enough to bring inflation down"
Bernanke contends: “a flawed and over-simplified monetarist doctrine that posits a direct relationship between the money supply and prices" in his book: 21st Century Monetary Policy.
See also: https://www.federalreserve.gov/newsevents/speech/bernanke20061110a.htm
Contrary to Nobel Laureates Dr. Milton Friedman and Dr. Anna Schwartz’s “A Program for Monetary Stability”: the distributed lag effects of monetary flows (using the truistic monetary base, required reserves), have been mathematical constants for > 100 years.
Dr. Richard Anderson says: "reserves were driven by payments". So, like Shadow Stats claims, we had to fall back on currency and demand deposits.
The rate-of-change in long-term monetary flows, the proxy for inflation, falls by almost 40% between Oct. and Dec. this year. And that uses DDs exclusively. So, I expect a significant decline in inflation by year's end. But it will stay historically high. And N-gDp falls.
The fact that the FED's Ph.Ds. think banks are intermediaries is the biggest mistake in monetary history.
Look at Marcus Nunes:
https://marcusnunes.substack.com/p/pain-the-name-of-the-game
He uses Divisia M4, the broadest monetary aggregate.
Today's market action (10/21) looks like it only took a day and a half for the Fed to get the message of this post (lol). To wit, after hiking 75 bps at the Nov. 2 FOMC meeting they will be thinking hard about whether they need to stay on the hiking warpath. Let's hope they do indeed give the economy some time to sort things out.
Hiking interest rates decreases the volume of loan funds thereby decreasing liquidity. Interest is the price of loan funds; the price of money is the reciprocal of the price level.
Thus, the FED is increasing financial instability. This is backwards. It is the interest rate fallacy.
As Dr. Philip George says: “When interest rates go up, flows into savings and time deposits increase.” I.e., it increases the demand for money, the desire to hold money. The paradox of thrift. An unrecognized leakage in Keynesian National Income Accounting. An increase in the demand for money decreases the velocity of money.
Based on history (most of which is a list of mistakes), the Fed will stop hiking in the next 3-6 months. (Looking at relationships between Fed funds and PCE, rates change etc.).
Also, based on the same (unfortunate) history, there's a 70% chance that the US will be in recession starting between May 2022 and May 2023.
Let's hope things go better than that.
Also, stock market internals are improving ( a little anyway). I am guessing there will be a grinding market for ~ 9 months going nowhere and thrashing the shorts and longs as it goes.
I will be doing some limited buying of stocks in the coming days.
The bond market (which I know a lot less about) looks like a disaster from the point of view of pension funds. British pensions have a 70% loss on most of their government (GOVERNMENT) bonds. Ouch. I imagine the Fed is experiencing some pain in their portfolio too.
Luck to all.
We really don't know how much the FED is communicating rate policy considering they need to be aware of expectations vs. what they say and intend to do as markets react to what they say.
"What's striking about today is that gold and commodity prices have not fallen further given the strength of the dollar. Long-time readers will note that this chart, which has appeared many times in recent years, has correctly predicted falling gold prices..."
Oh... look a this lil' nugget... just sitting here!
The 2027 Fiat Egea is expected to continue Fiat’s reputation for producing affordable, practical, and stylish compact cars for global markets.
Post a Comment