


If, over the past 13 years that I have been publishing it, this blog has contributed anything to our collective understanding of monetary policy, it is a focus on the balance between money supply and money demand. I've simply been following in the footsteps of the great Milton Friedman, who famously said that "Inflation is always and everywhere a monetary phenomenon, in the sense that it cannot occur without a more rapid increase in the quantity of money than in output."
Curiously, this commonsense approach seems to have fallen by the wayside over the course of the past decade or so, probably because during that time the Fed engaged in unprecedented easing of monetary policy (aka "Quantitative Easing") without there being a subsequent increase in inflation. Until this year, that is, when both the money supply and inflation surged. How to explain this? In my view, it's all about supply and demand: the amount of money and the public's willingness to hold it.
Friedman described how inflation works with a simple formula: M*V = P*Y, where M is money supply, V is the velocity of money, P is the price level, Y is real gross domestic product, and P*Y is nominal gross domestic product. That's simple enough, but he also assumed (mistakenly) that the velocity of money was relatively constant, which led to his prediction that the inflation component of GDP would rise if M2 growth exceeded real output growth by some meaningful amount.
Rearranging and simplifying the first equation using the M2 version of the money supply (widely considered the best), we see that V = GDP/M2. In the past 3 decades, by this measure, the velocity of money has been anything but constant, and that apparently convinced many analysts that Friedman's theory was seriously flawed. But was it?

To be fair to Friedman, M2 velocity was fairly constant for a long time, as Chart #1 shows. From 1959 through the early 1990s, the velocity of M2 averaged about 1.75, which means that every dollar of M2 was spent on average about 1.75 times a year to support all the transactions that took place in the economy. That changed in the mid-1990s, however, as velocity soared and then proceeded to decline from 2001 through 2020. For most of the past 30 years, therefore, changes in the rate of growth of the money supply had little or no connection to the rate of inflation, which remained relatively low, around 2% or so. This led many observers to theorize that inflation was driven not by changes in the growth rate of money, but by other factors such as the rise of China, demographics, productivity, and/or government spending. Followers of Modern Monetary Theory went so far as to argue that the US government could borrow, print, and spend almost any amount of money without there being inflationary consequences.
My approach to making sense of all this began with realizing that the velocity of money (V) is simply the inverse of the demand for money: if you don't want all the money you have, you have to speed up your spending; conversely, if you want to accumulate money, you have to slow down your spending. Going back to Friedman's equation, I substitute D (money demand) for 1/V. This gives us D = M2/GDP. Since GDP is equivalent to national income, we can think of M2/GDP as a proxy for the amount of money (held in cash, money market funds, and various types of bank accounts) that the average person or entity wants to hold over time, expressed as a percentage of one's annual income. So instead of thinking about how fast or how slow money turns over, I prefer to think in terms of how much money people are comfortable holding in relation to their income. That can and does change, especially during times of great uncertainty when people's natural inclination is to accumulate money.
The Fed publishes the level of the M2 money supply once a month with about a 3-week lag. As of the end of November '21, M2 was $21.4 trillion, having risen by about $5.9 trillion since the end of February 2020, just before the Covid crisis blossomed. So in the space of 21 months the money supply increased by almost 38%. That's by far the most rapid growth in M2 in history, and by an order of magnitude. (Milton Friedman must be turning over in his grave!) Yet many observers, the market, and the Fed itself are declaring that the burst of inflation we've seen this year is being driven not by all the money that has been created by the banking system (remember, only banks can create money, and they do that by increasing their lending), but by supply chain disruptions in the wake of the Covid crisis. So it's just "transitory" inflation. (To be fair, the Fed of late has attempted to walk back its assertion that recent inflation is transitory, but they have yet to acknowledge that they have basically screwed up massively.)
Unfortunately, it's not easy to prove that money, not supply chain disruptions, is the inflation culprit. But common sense says that a big increase in money that is not followed by a burst of inflation implies a big increase in the public's demand for money. In the same vein, a big increase in money that is followed by a burst of inflation implies a weakening in the demand for money. Consider the price of apples. If there is an unexpectedly large harvest of apples, we would expect to see the price of apples decline. And if apples happened to be in short supply, their price would probably rise. Inflation is simply a decline in the value of the dollar, and it happens when the supply of dollars exceeds the public's demand for dollars.
So what does the market think about all this? It seems to me that the market is way too optimistic about the Fed's ability to keep things under control.
Chart #1

My approach to making sense of all this began with realizing that the velocity of money (V) is simply the inverse of the demand for money: if you don't want all the money you have, you have to speed up your spending; conversely, if you want to accumulate money, you have to slow down your spending. Going back to Friedman's equation, I substitute D (money demand) for 1/V. This gives us D = M2/GDP. Since GDP is equivalent to national income, we can think of M2/GDP as a proxy for the amount of money (held in cash, money market funds, and various types of bank accounts) that the average person or entity wants to hold over time, expressed as a percentage of one's annual income. So instead of thinking about how fast or how slow money turns over, I prefer to think in terms of how much money people are comfortable holding in relation to their income. That can and does change, especially during times of great uncertainty when people's natural inclination is to accumulate money.
The Fed publishes the level of the M2 money supply once a month with about a 3-week lag. As of the end of November '21, M2 was $21.4 trillion, having risen by about $5.9 trillion since the end of February 2020, just before the Covid crisis blossomed. So in the space of 21 months the money supply increased by almost 38%. That's by far the most rapid growth in M2 in history, and by an order of magnitude. (Milton Friedman must be turning over in his grave!) Yet many observers, the market, and the Fed itself are declaring that the burst of inflation we've seen this year is being driven not by all the money that has been created by the banking system (remember, only banks can create money, and they do that by increasing their lending), but by supply chain disruptions in the wake of the Covid crisis. So it's just "transitory" inflation. (To be fair, the Fed of late has attempted to walk back its assertion that recent inflation is transitory, but they have yet to acknowledge that they have basically screwed up massively.)
Unfortunately, it's not easy to prove that money, not supply chain disruptions, is the inflation culprit. But common sense says that a big increase in money that is not followed by a burst of inflation implies a big increase in the public's demand for money. In the same vein, a big increase in money that is followed by a burst of inflation implies a weakening in the demand for money. Consider the price of apples. If there is an unexpectedly large harvest of apples, we would expect to see the price of apples decline. And if apples happened to be in short supply, their price would probably rise. Inflation is simply a decline in the value of the dollar, and it happens when the supply of dollars exceeds the public's demand for dollars.
Since inflation failed to increase in the 2009-2020 period, we can infer with some confidence that the demand for money increased in line with the increase in the supply of money, and that velocity fell in inverse fashion to the increase in money supply. The same goes for the 4-5 months following the Covid crisis: money surged but inflation did not, so obviously money demand also surged. But since inflation this year has increased dramatically in the wake of the jump in money supply last year, then the demand for money over the past year must have either decreased or increased at a slower rate than the increase in money supply.
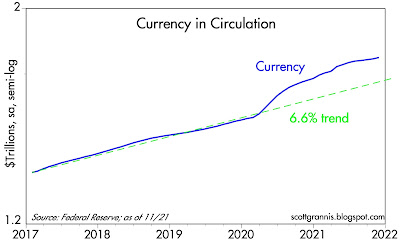
The easiest way to measure money demand is by looking at currency in circulation (which makes up about 10% of M2). Why? Because no one holds currency unless they want to hold it. If someone gave you a suitcase full of $100 dollar bills, would you simply stash it under your bed or in your closet? Of course not. Well, unless you were a drug dealer or a mafia courier. Most people would trot off to the bank and deposit the cash in their account. The bank, in turn, would most likely decide it didn't need to hold on to so much extra cash, so it would ship most or all of the money back to the Fed in exchange for bank reserves, which pay interest. Once in the custody of the Fed, those bills effectively cease to exist; they are no longer "in circulation." So whatever the amount of dollar currency in circulation there happens to be, we can safely assume that it is money that people want—for transactions, for an emergency, or, as is the case with the trillions of US cash that are held overseas, as a store of value.
Now, let's say that you wake up one day and discover that the world as you know it has suddenly changed: you no longer have a job, you can't travel, you can't go to restaurants, you can't even see your family for Thanksgiving. But politicians have been compassionate enough to realize that you still need money to live, and so they start sending you unemployment insurance checks and monthly allowances for your kids. Business owners learn that they can borrow money that won't need to be repaid as long as they don't close up shop. Would it be surprising to learn that a lot of people would end up wanting to hold extra cash in their pockets and in their bank accounts?
Now, let's say that you wake up one day and discover that the world as you know it has suddenly changed: you no longer have a job, you can't travel, you can't go to restaurants, you can't even see your family for Thanksgiving. But politicians have been compassionate enough to realize that you still need money to live, and so they start sending you unemployment insurance checks and monthly allowances for your kids. Business owners learn that they can borrow money that won't need to be repaid as long as they don't close up shop. Would it be surprising to learn that a lot of people would end up wanting to hold extra cash in their pockets and in their bank accounts?
Chart #2
As Chart #2 shows, this is exactly what happened last year. After growing fairly steadily at 6-7% for decades, the amount of currency in circulation grew at an annualized rate of almost 23% from the end of February through the end of August '20. But after that, the growth of currency decelerated. Over the next six months, currency rose at a 10% annualized rate. And in the past three months, currency has grown at a mere 4% annualized rate. Conclusion: by this measure, the demand for money surged last year but has since declined significantly—which means the velocity of currency has picked up. And not surprisingly, inflation has also picked up. This lends support to my thesis that the demand for M2 has also failed to match the increase in M2, and that is why inflation has surged.
Chart #3
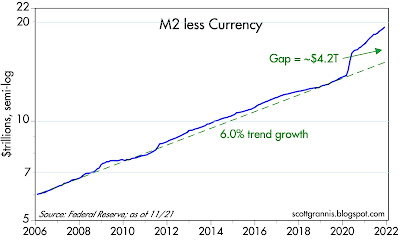
Chart #3 shows the level of M2 less currency in circulation. Here too we see a surge in growth initially (relative to its long-term trend growth rate of about 6% per year), followed by a moderation in the pace of growth. Since August '20, however, the non-currency portion of M2 has been growing at about a 12-13% annualized rate; that's down sharply from a 43% annualized rate in the six months ended August '20 (the same period during which currency grew at a 23% annualized pace, as noted above). But it's substantially higher than its long-term trend growth rate. At the very least, this looks like the source of our latest inflation surge. And it's ongoing, which means there is very likely more inflation in out pipeline.
Let's recap what we know about M2. The currency portion of M2 has exhibited a significant decline in its growth rate over the previous year or so. This strongly suggests that money demand has weakened. The non-currency portion of M2 has also exhibited a decline in its growth rate over this same period, but its growth rate remains historically elevated. If money demand has weakened but inflation has picked up, we must conclude that the increase in M2 has exceeded the public's desire to hold M2, and inflation has been the inevitable result.
So what is driving the growth of non-currency M2? The banking system is uniquely able to create this component of M2: not the Fed, and not Treasury. When banks lend money they do so by crediting a borrower's account with newly-minted "money." The amount they lend is a function of 1) the demand for loans and 2) banks' willingness and/or ability to lend. Given the ongoing rapid growth rate of M2, we know that the demand for loans is strong and banks these days are more willing to lend. Banks also face no constraints on their ability to lend, since the banking system has over $4 trillion in excess reserves (i.e., $4 trillion more in reserves than they need to support their current level of deposits).
This leads to a very important point. Increased borrowing on the part of the public—and the additional money this creates—is best thought of as declining money demand, because when you borrow money you are "short" money, since you benefit if the value of the money you are borrowing declines (same goes for "short sales" of stock). Simply put: borrowing money is the opposite of holding money. If your demand for money goes down you want to reduce your holdings of money by spending more, and you can accelerate that process by borrowing. So the ongoing relatively rapid increase in non-currency M2 is actually a reflection of the public's declining demand for money.
What's happening these days is a vicious circle of sorts: money demand has failed to keep with the growth in the money supply, and this has led to rising prices; rising prices, in turn, erode the demand for money, since the value of money is declining as prices rise, and all of this reinforces the public's desire to reduce money balances, borrow more, and increase spending.
This inflationary dynamic won't end until a) the Fed substantially reduces the supply of reserves to the banking system, b) the Fed substantially increases short-term interest rates (by enough to offset the erosion of money's value via inflation, c) the banking system becomes less willing to lend, and/or d) the public becomes less willing to borrow.
Having said all this, let's see how money demand is behaving:
and Chart #4
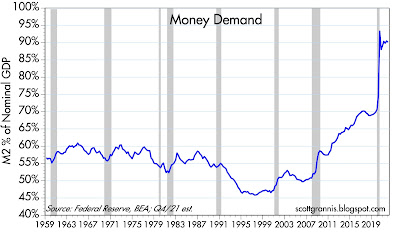
As Chart #4 shows, money demand (M2/GDP) surged by almost 30% during the peak of the Covid crisis (first half of '20). It fell somewhat in the third quarter, and has changed little in the past year. By this measure, money demand appears to have stabilized. The world was anxious to build up its store of liquid cash in the wake of the Covid crisis, but now confidence has returned and stockpiling additional cash is not occurring.
However, this has important implications for inflation going forward, especially since M2 continues to grow at a decidedly above-average pace (about 12% annualized) and the economy's growth potential is declining now that a lot of the slack created by the Covid lockdowns has been taken up. If real growth stabilizes around 2% per year, then nominal GDP growth will have to be 12-13%% per year if the demand for money remains constant, and that further implies that inflation could be approaching 10% before too long, and thus uncomfortably high inflation could be with us for awhile.
For example: If the demand for non-currency M2 were to return tomorrow to where it was pre-Covid, that would imply increase in the general price level of about 30%. This year's inflation could be simply a down payment on a lot more to come.
Chart #5
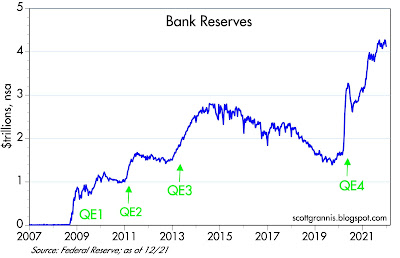
Chart #5 is a reminder of just how much bank reserves have grown since 2008. Prior to that, banks always held the bare minimum amount of reserves (as determined by their deposits) because reserves paid no interest. Now that reserves pay an interest rate that is determined by the Fed (currently about 0.15%), bank reserves have become T-bill substitutes—high quality, interest-bearing assets. If the Fed doesn't increase the rate it pays on reserves by enough to make holding reserves competitive, on a risk-adjusted basis, with lending to the public, banks are likely to expand their lending virtually without limits. And if short-term interest rates don't rise by enough to substantially offset the loss of the dollar's purchasing power (currently equal to inflation which is running almost 8%), then the public's desire to hold money balances will continue to decline.
Chart #6
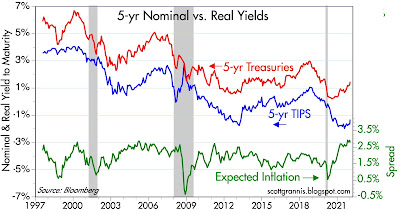
The green line in Chart #6 is what the bond market thinks the rate of consumer price inflation will average over the next 5 years: about 2.8%. This implies a rather high degree of confidence that the current inflation surge is transitory, and by inference, that the Fed will take the necessary steps to keep the supply and demand for money in balance. The blue line is the real yield on 5-yr TIPS, which is equivalent to what the bond market expects the real Fed funds rate will average over the next 5 years: -1.3%. Currently the real funds rate is roughly -4.5%, using the core PCE deflator (though it would be about -7% using the CPI). This implies a decidedly bleak view of the economy's growth potential, since real yields tend to track real growth. So the market thinks the Fed will pull the right levers, supply-chain bottlenecks will shortly disappear, and the economy will limp along for the next five years at a meager rate of growth. Not very exciting, but not very threatening either.
Chart #7
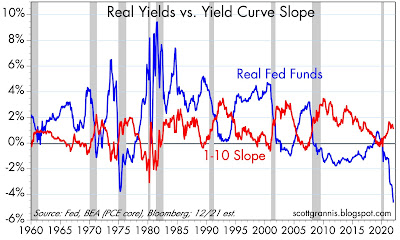
Chart #7 illustrates how monetary policy tightenings have preceded every recession in the past half century, with the exception of the Covid collapse of last year. The Fed tightens money policy by 1) raising the real Fed funds rate substantially (blue line) and 2) forcing short-term rates to rise relative to long-term rates (i.e., flattening or inverting the yield curve as shown by the red line). Higher interest rates on short-term cash balances make holding cash more attractive, thus bolstering the demand for money.
The problem today is that short-term interest rates are essentially zero and inflation is relatively high. This means that holding cash and short-term assets is a very expensive proposition. I refer readers back to my description of how I first learned about inflation in Argentina. When you hold cash while prices rise, you are losing purchasing power, and the natural reaction of consumers in this situation is to try to minimize cash holdings by buying things now before their price rises. Money becomes like a hot potato.
In contrast, the current stance of monetary policy is extremely accommodative, since real yields are very negative and the yield curve is not even close to flattening. In fact, monetary policy has never been so accommodative, even during the inflationary 1970s. Conclusion: if things follow this script, there is very little risk of a recession for the foreseeable future, and that helps explain why the stock market continues to rise. But there is a significant risk that inflation remains uncomfortably elevated.
Of course, both the Fed and the bond market are quite aware that tighter monetary policy could hurt the economy as it has throughout history. That explains why the Fed is only projecting that it will raise the funds rate 75 bps by the end of this year. Any more and markets might panic, they think, much as the market panicked when the Fed began tightening in late 2018. That cautious approach brightens the near-term growth outlook, but it does little or nothing to assuage inflation fears.
In the meantime, supply-chain bottlenecks do seem to be easing, so it would not be surprising to see inflationary pressures easing up a bit in the first half of this year. Any easing of inflation pressures would be taken as a thumbs-up for the Fed's currently projected policy trajectory, and thus good news for the market. But unless and until the Fed addresses the underlying causes of higher inflation—rapid money growth and declining money demand—uncomfortably high inflation will soon be back on center stage.
To be convincing to an inflation skeptic like me, the Fed needs to begin to raise real short-term interest rates by enough to make holding outsized cash balances more attractive; in short, the Fed needs to focus on doing things which increase the public's willingness to hold money. If it waits too long to do this, then they risk allowing a vicious inflationary psychology to set in. In recent weeks, especially this week, the market has begun to worry that inflation may not be transitory, and that means the Fed will have to raise rates by more than previously expected. The Fed is now expected to be a bit more aggressive than previously thought. But these are baby steps. Interest rates are still unsustainably far below the current rate of inflation. The Fed will inevitably have to do more, much more.
Eventually, higher rates will hurt the economy, but that won't happen anytime soon. The Fed is committed to a go-slow approach, and that will only prolong the problem, not solve it. The Fed needs to take money demand seriously, or else we will all pay a steep price in the form of higher inflation.
Investors need to understand this dynamic, and plan accordingly: plan for higher inflation, higher interest rates, and higher prices for things (e.g., real estate, commodities, services). Owning productive assets with ties to the real economy is not a bad place to start, and that could explain the continuing rise in equity prices.

26 comments:
And by the way, I'm fully recovered from that week-long bout with Omicron. It wasn't very bad at all, more like a bad cold or a mild flu. That's one reason why it's so contagious: you can be sick but not realize it, and in the meantime pass it along to someone else. But there is no reason to panic over Omicron. Take it in stride; sooner or later most of us will have survived it.
First, happy we all are at Scott Grannis' recovery, and that of everybody else.
Secondly, this is great blogging today (per usual).
Scott Grannis joins John Cochrane, Paul Krugman, Scott Sumner, and certain smarter MMT'ers in leaving me totally confused as to what actually to believe.
In reading all these fine thinkers, I feel like a blind dog in a meathouse---everything is interesting, and I chase to and fro, but I still can't see the picture.
That said, what SG posted today makes a lot of sense. The Fed has overdone it? Seems likely.
Can the US muddle through with, say, moderate inflation for a few years? That outcome would not be so bad.
For me, the big lesson is a nation can not let experts dictate national policy.
The public health officials are not macroeconomists, and so will issue edicts from their point of view, not considering economic consequences.
The defense guys will get the US into Iraqistan, $6 trillion down a toilet, as it makes sense from their point of view.
I happen to be pretty green, but shutting down too much of an economy to meet green goals goes too far.
The experts are expertly biased.
Good luck to everyone in 2022.
I look forward to more blogging by SG.
" But common sense says that a big increase in money that is not followed by a burst of inflation implies a big increase in the public's demand for money."
It's important to note here that "public" is not limited to the American public, it can be external demand for USD.
This is of course not hypothetical, there's been a very significant deflationary external demand for many years now.
Scott, doesn't this suggest that gold is temporarily undervalued?
Re gold: It's natural to think that in the presence of rising inflation, gold should be rising, not falling. AFter all, isn't gold supposed to be an inflation hedge par excellence? The explanation that makes the most sense to me is that markets anticipate policy mistakes (like the Fed being too easy); they don't react to them. Thus, gold is not rising today because it rose long ago in anticipation of what is happening today. Remember when it was below $300/OZ. about 20 years ago? Gold today is falling because the market is anticipating that the Fed will eventually tighten (e.g., raise real interest rates) in response.
-On the virus
"But there is no reason to panic over Omicron. Take it in stride; sooner or later most of us will have survived it."
i agree in a way but it's amazing to see the two groups so far apart (downplay vs amplify). The data is there in order to formulate balanced opinions. Why is it not happening?
This is a similar line of thinking expressed by expert Wisconsin Senator Ron Johnson when (in early 2020) he opined that the flu-like covid virus was no big deal as he expected that the majority would survive and he had mentioned that he expected that only 1 to 3.4% of the population would die as a result..
-On the inflation
There is a lot to unpack and the equation has many variables. There is a potential fundamental problem with a specific premise.
"So what is driving the growth of non-currency M2?" and the supposedly high demand for loans by private market participants
How come this is not showing up in data such as all loans and leases held by commercial banks?
https://fred.stlouisfed.org/series/LLBACBQ158SBOG
Money supply has outstripped underlying real economic activity but where will the supply come from if/when the Fed and the Treasury stop supplying the drug (free money)?
Also, money velocity has been on a down trend for such a long time. Why?
And what ingredients are present now that would change that secular trend?
Brilliant post, Scott. Thanks for sharing this with us. It clarified my own thinking as I near full retirement.
I wonder if the FED is actually ignoring how this above target inflation is happening, Money Demand or otherwise.
They are doing exactly what they said they'd do quite some time ago in allowing this "asymmetric inflation" philosophy where they allow periods of above 2% target inflation to "compensate" for historical periods of below target inflation.
Scott, thanks for the reply re: gold. I should add that I'm looking at real interest rates, which I understood historically to be predictive of gold's price movement (and a much better signal than inflation, which as you correctly point out, and contrary to popular wisdom, is not highly predictive of gold's price action). The old rule of thumb is that a 1% real interest rate = equilibrium for gold, and that every 1% move in real interest rates is inversely correlated to an 8% move in the price of gold (albeit with a slight lag sometimes). But it sounds like this rule of thumb no longer applies?
Unknown: I've got two charts I'll post later today that show some interesting relationships between the price of gold vs real yields and gold vs 3-yr forward Eurodollar yields. Both of them tell a story similar to what I describe in my earlier comment.
best post ever you have written, tho it contains the malign infection of cheerleading not yet fully purged.
I confess to holding a 15% position in short term US Treasuries and the VG Total Bond Market Index. Although I agree that holding such “investments” is a near certain inflation loser, I do not see it quite like that.
Instead, I think of having cash/high quality bonds in one’s portfolio as a necessary insurance policy premium that must be paid for most people to sleep at night. I use it to anchor my fears of an unlikely (but still possible) deflationary cycle. Needless to say, it also compliments the 15% inflation position I have taken in commodities & a very small, but happily non taxable forest preserve. The bulk of the remaining portfolio (i.e. 70%), however, is more or less evenly split between a Wilshire 5000 index fund and a rent producing Midwest farm.
The above is not perfect, but given my age, my temperament for risk, and my limited cognitive skill sets, the portfolio is designed to not blow up in a 2.5 sigma event...if that makes sense?
Very interesting article, thanks for posting.
One point, you state that "Followers of Modern Monetary Theory went so far as to argue that the US government could borrow, print, and spend almost any amount of money without there being inflationary consequences."
When I read Stephanie Kelton's book one of her first points was that inflation is because of government overspending and inflation is the real constraint because of it's consequences. I have read other authors misstate this point as well.
^about MMT's premises.
From the theory, inflation should occur only when full employment and full economic potential are reached. Unintended consequences are already showing up at this stage when only part of the experiment is tried.
With a focus on nominal GDP, MMT cannot explain what is happening now with the goal of redistribution resulting in the opposite intent ie an inflation which results in lower real wages for the immense majority. In other words, the MMT policy is hurting those people that were supposed to be 'helped".
At some point, 'we' the people will realize it. Maybe we've been reaching that stage since GFC?
You might want to have Milton Friedman as a friend, but not as an investment advisor. Friedman was "one-dimensionally" confused.
All these ideas are mutually reinforcing. Take Dr. Philip George's "The Riddle of Money Finally Solved"
http://www.philipji.com/riddle-of-money/
Money is a paradox, by wanting more it ends up with less.
First, there is no ambiguity in forecasts: In contradistinction to Bernanke (and using his terminology), forecasts are mathematically "precise”.
I predicted the 4th qtr. 2008 crash. I predicted the bottom in March 2009. I denigrated Nassim Nicholas Taleb’s “Black Swan” theory (unforeseeaable event), 6 months in advance and within one day. I predicted both the flash crash in stocks on May 6, 2010 and the flash crash in bonds on October 15, 2015.
The Stock Market Was Rocked by a Mysterious ‘Flash Crash’ Five Years Ago. What You Need to Know. | Barron’s
“Diminishing market depth and a surge in volatility were both on display Oct. 15, when Treasuries experienced the biggest yield fluctuations in a quarter century in the absence of any concrete news. The swings were so unusual that officials from the New York Fed met the next day to try and figure out what actually happened”
Link: “Diminished Liquidity in Treasury Market” or:
“(Bloomberg) — Trading Treasuries keeps getting tougher and tougher.
For decades, the $12.5 trillion market for U.S. government debt was renowned for its “depth,” Wall Street’s way of talking about a market’s ability to handle large trades without big moves in prices. But lately, that resiliency has practically vanished — and that’s a big worry.”
The problem is that bankers, the ABA, is ignorant and arrogant.
Inflation peaks in Jan, as monetary flows, volume times transaction's velocity, project.
Scott, enjoyed your article as I also matched your experience with Omicron. Your deep analysis supports my basic views on things I observe. For example earlier this year I refinanced my only debt, a $120,000 mortgage at a fixed rate of 2.375% for 15 years. With a current inflation rate around 7%, the disparity between those two numbers is so far off the charts in my 48 years of having mortgages, that it is mind boggling. Almost like watching exchange rates in Argentina some 40 years ago. Unsurprisingly in less than a year the value of that real estate has gone up 10% and the real value of that mortgage dropped 5%.
The Fed has stated that they will start to raise interest rates fairly soon. Do you have any thoughts on how high they have to raise them to have an effect on 7% inflation?
The US government, foreign governments, companies and individuals now have so much debt, At what level of interest rates do you think that debt load would be unsustainable?
My view in general is that the only way out of excessive debt world wide is have inflation reduce it. Do you think my view is credible?
Once again, thanks for an interesting analysis. Thanks
george: as a first-pass estimate for how high rates need to rise, the Fed would need to raise short-term rates to a level that convincingly exceeds inflation. Inflation is already eroding the value of debt, already working to mitigate the problem of indebtedness, and this process is unlikely to stop any time soon. Many people are already seeing and understanding the logic behind borrowing at today's super-low interest rates. This will only exacerbate the problem of inflation going forward; the Fed is underestimating, if not ignoring, this feedback effect.
I suspect that the Fed will continue to expand the money supply until annual inflation is in double-digits.
What is this FED comment about bank "climate change stress tests." Ideas?
https://youtu.be/0a8j1Tgdg2k?t=1106
Ataraxia: The Fed's new focus on "Climate stress tests" is another clear sign that politics has infected the Fed's deliberations. (The other being that the Fed tries to make it clear that they won't tighten too much for fear of hurting the economy or tanking the markets.) This is without doubt ominous. There is no rational justification for using climate stress tests as part of monetary policy considerations in the first place. The results of doing this, however, will undoubtedly make Fed policy mistakes more, not less likely.
Thanks Scott I feel the same. Also thanks for this excellent inflation explanation and thesis.
Negative real rates of interest are here to stay. Too much money chasing too few investments.
Real interest rates (nominal minus inflation) are determined by the savings-investment imbalance. It's the division between money products and savings' products. An increase in savings products will increase the real rate of interest, e.g., the reduction in FDIC insurance from unlimited to $250,000 in Dec. 2012 (which produced the "Taper Tantrum").
It seems like one big experiment. Money has a “sweet spot”, but velocity has an interminable one (i.e., non-neutrality).
The error in macro-economics is that banks don't loan out deposits. So, all bank-held savings are frozen, lost to both consumption and investment. So, AD falls as the velocity of circulation falls, and government intervention is required to offset secular stagnation.
Adding infinite, artificial, and misdirected money products (the Cantillon effect of LSAPs on sovereigns) while remunerating IBDDs (thereby destroy the velocity of circulation), results in an excess of savings over real investment outlets, generating negative real rates of interest; eventually has a negative economic multiplier; stokes asset bubbles, exacerbates mal-investment; aggravates income inequality, produces social unrest, and in the longer-term, depreciates the exchange value of the U.S. $.
Whereas the activation and discharge of monetary savings, $15 trillion in commercial bank-held savings (income not spent), of finite savings products (near money substitutes), increases the real-rate of interest (+ R *), produces higher and firmer nominal rates, is more potent (affects real variables), increases the velocity of circulation, has a positive economic multiplier and supports the exchange value of the U.S. $. The 2013 Taper Tantrum is prima facie evidence (my "market zinger forecast").
Interest rates to equities are like gravity to matter, Buffett says... Seems poignant recently as ten year bumps up and equities adjust in reference, so far somewhat orderly. So far...
Hello, forgive the perhaps dumb question but can you walk through how you got to 30% in the paragraph:
"For example: If the demand for non-currency M2 were to return tomorrow to where it was pre-Covid, that would imply increase in the general price level of about 30%. This year's inflation could be simply a down payment on a lot more to come."
Post a Comment