


I am fascinated by the fact that these days hardly anyone is talking about the very rapid growth in both M2 and nominal GDP. Both suggest that inflation is alive and well, and very likely to continue.
The big news this week was that the Fed is doing its best to avoid an aggressive tightening of monetary policy. Which makes it strange that the market sold off on the news that the Fed plans to accelerate (ever so slightly) its tapering of asset purchases while also planning to begin to lift short-term interest rates (in gingerly fashion) in about two months. As I've been arguing for awhile, the threat of tight money is a problem that still lies well into the future; it's certainly something to worry about, but not for now. Monetary policy today is still extremely accommodative, and almost certainly the culprit behind our inflation problem.
Today the Fed said that they plan to start raising short-term rates in early March. The bond market expects the Fed will ratchet up rates by 25 bps at a time until reaching a "terminal rate" for their Fed funds target of about 2.5% in about 3-4 years' time. In my book, that hardly rates as tight money. Actual tightening involves a significant rise in the real Fed funds rate (e.g., to at least 3%). It also involves a flattening or inversion of the Treasury yield curve, which is still moderately steep. We're not even close to those conditions, and the Fed has virtually assured us they are unlikely to slam on the monetary brakes anytime soon.
Most observers these days argue that inflation is the result of too much demand (fueled by government stimulus payments) and not enough supply (e.g., Covid-related supply bottlenecks). Hardly anyone talks about the unprecedentedly rapid growth of money, aside from me and a handful of other economists (e.g., Steve Hanke, John Cochrane, Ed Yardeni, and Brian Wesbury). Moreover, I'd wager that the great majority of the population doesn't understand that supply and demand shocks can only affect the prices of some goods and services, but not the overall price level. If all, or nearly all prices rise, that is a clear-cut sign of an excess of money relative to the demand for it. That is how inflation works.


There are other reasons to think the recent stock market selloff is overdone, if not premature. Credit spreads—which measure actual stresses in the economy—are still relatively low. Swap spreads—which are a good indicator of liquidity—are very low. Together, these spreads tell us that liquidity is abundant, economic stresses are low, and the outlook for corporate profits—and by inference the economy—is healthy. Ironically, the main problem for now is that the Fed is not prepared—yet—to do anything that might slow the rate of inflation or threaten the economy for the foreseeable future. They'd rather lay the blame for inflation on Congress than take the heat themselves. And don't forget that Powell is up for renomination soon.
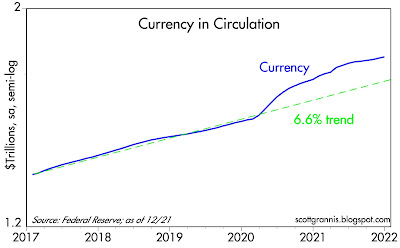
Chart #1
Chart #1 shows the growth of currency in circulation, which represents about 10% of the M2 measure of money. After surging at 20% annualized rates in Q2/20, the growth of currency has slowed to about a 5% annualized rate, which is somewhat slower than its long-term trend growth of about 6.6% per year. As I've explained before, the supply of currency is always equal to the demand for currency, which means that currency growth is not contributing to our recent inflation problem. Currency growth was quite rapid last year because the demand for currency was very strong, fueled by all the uncertainties of the Covid threat. But the fact that currency growth has since slowed significantly since then suggests that precautionary demand has faded: this is arguably a good leading indicator that the demand for money balances in checking accounts and bank savings account is also softening or beginning to soften. In the absence of any slowing in the growth of M2, any reduction in the demand for money in the system is precisely what fuels a rise in the general price level. If the Fed does nothing in response, such as raising short-term interest rates and draining reserves from the banking system, inflation is very likely to continue
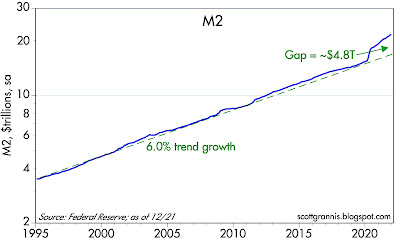
Chart #2
Chart #2 shows the growth of the M2 monetary aggregate. Here again we see explosive growth in Q2/20 and a subsequently slower—but still quite rapid—rate of growth which continues to this day. For the past year or so, M2 growth has been averaging about 12-13%. That is twice as fast as its long-term trend rate of growth, and it shows no sign of slowing, even though the Fed has been tapering its purchases of securities (to be fair, tapering does nothing to reduce inflation). This is good evidence that M2 is growing because banks are lending money by the bushel, which is the only way the money supply can expand. The public's apparent demand for loans is thus strong, and that is symptomatic of a decline in the demand for money.
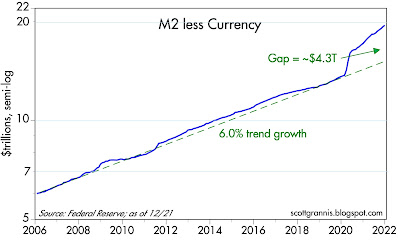
Chart #3
Chart #3 shows the growth of M2 less currency, which is equivalent to all the money that has been supplied by the banking system via lending operations. It's important to remember that the Fed cannot create money directly; the Fed only has the power to limit bank lending by limiting bank reserves, and to influence the public's demand for money via increasing or decreasing the overnight lending rate. Again we see the same pattern: explosive growth of M2 in Q2/20 followed by a slower (but still rapid) 13-14% pace since then that shows no signs of slowing (as of the recently-released data for December '21). The growth of money on deposit in our banks is growing at more than twice its historical rate, and that has been the case for the past 18 months. Needless to say, this is nothing short of extraordinary. And it is the stuff of which inflation is made.
Chart #4
Chart #4 shows that the M2 money supply is now equal to about 90% of the economy's nominal GDP. Since the latter is roughly equivalent to national income, this means that the average person or entity today is holding almost one year's worth of his annual income in a bank deposit of some sort. This is a level that was only exceeded in Q2/20, at the height of the Covid panic, and it is far above any level we have seen for many decades. People have effectively stockpiled an unprecedented amount of money in bank accounts and savings accounts that pay almost no interest! On its face, this would suggest that the demand for money (non-interest bearing money) has been intense. But will that demand remain strong? The fact that inflation has surged in the past year is good evidence that money demand is already declining: people are trying to get rid of unwanted money by spending it, and that is what is driving higher inflation.
Chart #5
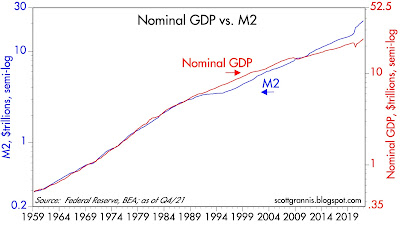
Real GDP grew by a very healthy 5.5% in 2021, but about 70% of that growth came from inventory rebuilding—so we are very unlikely to see another such number. The general price level rose by 5.9%, which means that nominal GDP grew by a whopping 11.7%, which is not surprising since the M2 money supply rose by 13.1%. As Chart #5 shows, both M2 and nominal GDP have a strong tendency to grow by about the same rate over longer periods. When they diverge from this trend it's due to a change in the public's desire for money balances. Referring back to Chart #4, we see that money demand grew by about 1.6% last year, but most of that increase happened in Q1/21 when Covid uncertainty was still raging. Money demand has been steady for the past 9 months. If M2 continues to grow at a 13% annual rate, as it has for the past year, then nominal GDP growth is very likely to continue grow at double-digit rates. And since the economy is very unlikely to sustain a 5% growth rate for much longer, inflation is going to be at least 7-10% for as long as M2 growth remains at current levels.
An important note: it is going to be many months before the Fed adopts policies (e.g., draining reserves and lifting the Fed funds rate to a level at least equal to inflation) that will slow the growth of money by increasing the public's desire to hold money. Banks have been the source of the explosion in M2 growth, and the only thing that will change this for the better are policies designed to make holding money more attractive; banks need to be less willing to lend to the public and the public needs to be less willing to borrow. Much higher short-term interest rates are thus the cure for our inflation blues. But we won't be seeing them for a long time.
Chart #6
Chart #6 shows how increases in housing prices tend to lead inflation by about 18 months. Housing prices have been rising at a 15-20% annual rate for the past year or so, and that is very likely to add substantially to consumer price inflation for at least the next year. Owner's equivalent rent comprises about 25% of the CPI.
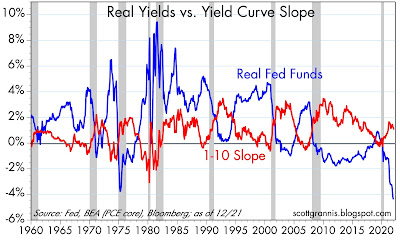
Chart #7
Chart #7 compares the real yield on the Fed funds rate (blue line) to the slope of the Treasury yield curve (red line). Note that every recession (gray bars), with the exception of the last one, has been preceded by a significant increase in real yields and a flattening or inversion of the yield curve. Both of those conditions are highly indicative of "tight money." We won't see anything like that until at least next year, given the Fed's obvious desire to avoid shocking the bond market and/or risking another recession.
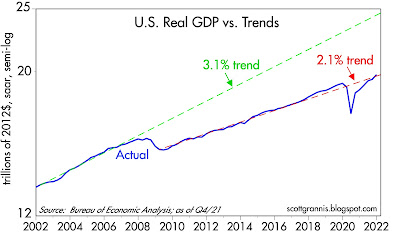
Chart #8
Chart #8 compares the growth of nominal GDP (blue line) with two different long-term trend lines. (Note that the chart uses a semi-log y-axis, which shows constant rates of growth as straight lines.) The economy grew by 3.1% per year[ on average from 1966 through 2007. Since 2009, it has grown by about 2.1% on average. Unless policies become more growth friendly, we are thus unlikely to see GDP exceed 2% on a sustained basis. That again highlights the fact that 13% M2 growth, if it continues, will likely result in sustained inflation of 10% or more this year.
All eyes should be glued to the growth of M2, which is released around the end of the third week of every month.
Chart #9
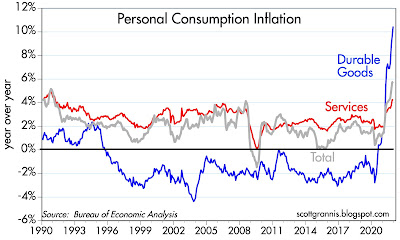
Chart #10

Chart #10 shows the behavior of the three main components of the PCE deflator since 1995. I chose that date because it marks the debut of China as a major source of cheap durable goods for the world. As the chart shows, all prices are now on the rise, with durables leading the way after decades of falling, and services prices (which are strongly correlated to wage and salary growth) now beginning to accelerate.
This is the very definition of true inflation: when nearly all prices rise, not just a few.
Chart #11
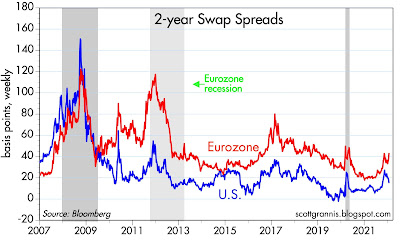
Chart #12
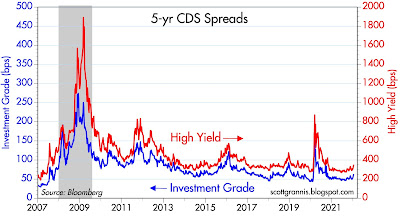
Finally, Charts #11 and #12 recap the status of swap and credit spreads. They tell us that liquidity is abundant nearly everywhere, and that the outlook for corporate profits is healthy. We are very unlikely to be on the cusp of another recession. That's the good news.
The bad news is that sustained inflation of 7-10% will cause significant problems in the months and years to come. Inflation will be a boon to federal government finances, but it will be the bane of the rest of the economy, because inflation is essentially a hidden tax that all holders of money end up paying the government. Over time that will work to sap the economy of its energy, resulting in slower economic growth.

42 comments:
First, as a result of Benjamin Cole’s previous post, i reviewed a note you had released in 2015 about Apple. i don’t really understand Apple (business fundamentals) as an investment and there have been ‘sentimental’ factors but it seems that you got the fundamental part right. This appears impressive and kudos to you.
Now the less reverent part. :)
Money supply growth is coming down in large economies (now to within weeks) and is reaching pre-pandemic levels and these numbers even include the ‘inside’ money printed by the Fed which does count as this part refers to the purchase of government debt securities which had been sold to the ‘public’ and which already had absorbed ‘public’ purchasing power.
We’ve reached a point which is past the peak in policy involvement (monetary and fiscal) and only the ‘communications’ part announced appears to already shake the foundations of the temple.
There are monetary reasons for this inflation but the fiscal driver predominates if you dissect the money flow numbers. Since around 1996, M2 growth has outpaced (more and more so) the growth in nominal GDP.
Why?
Because money velocity (inverse of demand if you like) has been coming down.
Why?
There are various factors including demographics but the main driver appears to be growing debt. Since around 1995, in the US, (household+corporate+government debt)/GDP went from 170% to 270%.
Without ongoing and unprecedented fiscal support, how will inflation and growth persist (the P and the Y in the MV=PY equation)?
The following is an adjusted FRED graph showing money velocity adjusted for Fed money creation which isn’t. With the covid pandemic, there was unprecedented fiscal support which barely moved up the velocity needle. What happens next during the withdrawal phase?
https://fred.stlouisfed.org/graph/fredgraph.pdf?hires=1&type=application/pdf&bgcolor=%23e1e9f0&chart_type=line&drp=0&fo=open%20sans&graph_bgcolor=%23ffffff&height=450&mode=fred&recession_bars=on&txtcolor=%23444444&ts=12&tts=12&width=1168&nt=0&thu=0&trc=0&show_legend=yes&show_axis_titles=yes&show_tooltip=yes&id=M2V_TOTRESNS,GDP_M2SL_TOTRESNS&scale=left,left&cosd=1959-01-01,1947-01-01&coed=2021-10-01,2021-10-01&line_color=%234572a7,%23aa4643&link_values=false,false&line_style=solid,solid&mark_type=none,none&mw=3,3&lw=2,2&ost=-99999,-99999&oet=99999,99999&mma=0,0&fml=a,a%2F%28b-c%29&fq=Quarterly,Quarterly&fam=avg,avg&fgst=lin,lin&fgsnd=2020-02-01,2020-02-01&line_index=1,2&transformation=lin_lin,lin_lin_lin&vintage_date=2022-01-29_2022-01-29,2022-01-29_2022-01-29_2022-01-29&revision_date=2022-01-29_2022-01-29,2022-01-29_2022-01-29_2022-01-29&nd=1959-01-01_1959-01-01,1947-01-01_1959-01-01_1959-01-01
For the expenditures on durable orders, the wealth effect played out quite strongly (just tag the household net worth trend with the durable orders). But this was not the intended ‘wealth effect’ from the open market operations of the Fed (hot potato effect), this was the result of the government going deeply into debt in order to allow private participants to buy durable orders (way ahead of previous trend and a lot coming from overseas with an amazing effect on a growing negative trade balance). This fiscal ‘stimulus’ was the equivalent of the government directly buying durable orders and storing them in warehouses.
Obviously, this created inflation pressures but how is that going to translate (inflation and growth) going forward?
Yeah inflation isn’t the talk of the day really if one holds invested assets (asset inflation is great again) but main street inflation appears to already and badly hurt the typical American (bottom 50-70%) who appears to be struggling and this is already showing up in consumer sentiment readings (look at the last Michigan confidence reports; despite an overall negative (and quite dismal) number because of the bottom struggling, the top still report a ‘healthy’ sentiment trend).
Opinion: there are huge developing growth and inflation risks and the bond market/yield curve appear to be on the right track. The timing issue remains elusive and, normally, these macro themes develop over long periods. However, Japan (seen as a leading indicator) is showing basically zero inflation despite money supply growth in the 10% area and the US, since the GFC, has compressed the monetary/fiscal distance with Japan and one has to wonder if what we ‘see’ in the stock markets is an indicator of what’s coming within the next few weeks.
I don't know, Scott. You make a highly compelling case for problematic inflation with your focus on M2.
But commodities, with the notable exception of oil, aren't hinting at high levels of inflation. Dr. Copper in down over one and three months and flat over 11 months. Gold is down over 1,3,6, and 12 months. Wouldn't commodity prices be behaving materially differently if the market sensed the type of inflation you're warning about?
10-year yields are near 52-week highs but still just 1.78% and barely up over nine months. The 2-10 is the flattest in 15 months. The 10-year breakeven is under 2.5%, not exactly the stuff of problematic inflation. And breakevens are still in backwardation. Wouldn't yields and breakevens look materially different if inflation was as bad as you say?
Something doesn't add up. You make such a compelling case and I too am very worried about long-lasting high inflation. But markets aren't exactly providing emphatic support.
I think Carl is on to something when he cites velocity.
The market seems to be hinting at a very blah economy after the re-opening. Also, it would appear that it too thinks that a big portion of the recent inflation will prove to be transitory (even if that word is now verboten).
Hello Scott.
After years of occasionally reading your posts I think I finally get it. But can I make sure please?:
- The Fed can only buy debt from banks (primary dealer banks).
- The money the banks receive from the Fed goes into the banks Reserve accounts.
- The Fed's purchases of these bonds push down interest rates.
- However this, in itself, is not inflationary unless the public starts borrowing from the banks (from these Reserves) and spending it, and the multiplier effect upon this (this borrowing did not happen much after 2008-9, so there was not a lot of inflation).
Ok, so far, so good?
But, what exactly are these Bank Reserves? They are not the same as the normal reserves a bank must keep as a percentage of their customers' deposits, right?
What makes Reserves different than other cash a bank owns? What constraints are there on them, if they can be lent out to anyone (hedge funds, etc. as well as normal loans)?
Thank you!
Richard
Scott,
I don't understand how your view on rising inflation and your belief that gold anticipates inflation - considering that gold's peak was August 2020 and inflation is raging with no end in site.
Thanks,
Richard
^Reserves exist because of the rules of the ruler and once reserves exist, they are the same whether ‘required’ or ‘excess’.
When a bank gets a deposit, as per the rules (reserve requirement), it has to set aside a small fraction of this deposit (technically in a vault as cash and essentially as money (now reserves) deposited at the Fed). To help prevent a run, the Fed defined required reserves. Note that people do not manifest any more the tendency to hoard money en masse. Deposits and required reserves at the systemic level will move around the banking system but that leaves individual banks at risk, still.
When the Fed performs an open market operation, a new deposit is created (money that had been used to buy a US Treasury becomes money again) and this deposit has to be matched by a 100% excess reserve requirement ie all this new money (deposit) has to be deposited at the Fed. These created reserves cannot leave the inside-money financial plumbing system (between commercial banks and the Fed) but the ‘new’ level of reserves gives room for the banks to loan more, something which has NOT happened to any significant degree since the initiation of the multiple QE rounds.
Households and Nonprofit Organizations; Debt Securities and Loans; Liability, Growth Rate (BOGZ1FG154104005Q) | FRED | St. Louis Fed (stlouisfed.org)
Note 1: The main driver behind loan growth has been the general growth of the economy and, as we know, trends in the general economy have been going down (reasons for which there is ample room for debate, especially going forward).
Note 2: The recent blip in the growth of loans is related to the temporary government help (including to small businesses, PPP loans etc) and many of those loans are being repaid or forgiven. We are overall going back to previous trend in loan growth despite the now massive levels of ‘excess’ reserves.
Note3: Yesterday i bought some booze and still spend time on stock picking but, so far, in 2022, M2 appears to be growing at around 0% if one adjusts for changing levels of excess reserves and M2 growth (the official reported number that includes effects of changing levels of excess reserves) has been negative.
Between P and Y, I think Y will go down first and the descent may be accentuated by excessive inventory build-ups (including the still unrecognized inventory waiting in boats at continental coasts) but P should follow suite shortly after. What will ‘they’ do then? Tighten?
Bank of Japan Governor Haruhiko Kuroda’s answer (liberal translation): “Don’t even think about it.”
NB Gold does well during inflationary conditions but gets confused in deflationary climates.
rsswg, re Gold: The short answer to your question can be found in this post:
https://scottgrannis.blogspot.com/2022/01/gold-and-fed.html
Gold's peak came before the rise in inflation; the market correctly anticipated what would happen.
Thank you Carl for your explanation of Reserves.
One question though please, when you say "These created reserves cannot leave the inside-money financial plumbing system (between commercial banks and the Fed) but the ‘new’ level of reserves gives room for the banks to loan more", where is this money coming from to loan more if the new Reserves have to stay within the "inside financial plumbing - within the banks and the Fed?
Also, what is Y vs Friedman's Q?
Thank you very much.
Richard
The stimulus and extra unemployment checks part of the inflation is about over. Unless something else happens, e.g. reversal of "fed policy" (using a nice phrase- more like "fed momentary political feelings about various indicators"), which could re-ignite inflation, inflation will be near what it was before covid. It should be about 2.5-3% around the end of 2022; just a tad higher than it was between 2010-2019.
The fed can keep up the accommodative "policy", but the income inequality is getting too big/bad to support.
Unknown (Richard): You're partly right, but let me restate your summary. The Fed buys securities (Treasuries and MBS) from primary dealers. The Fed pays for them by crediting the banks' reserve account at the Fed. Bank reserves are not money, they are an asset for the banks and a liability for the Fed. Before 2009 reserves paid no interest, now they do. Before 2009 banks had to have reserves equal to a fraction of their total deposits. Since they paid no interest, banks always held only what they were required to hold. Now that they do pay interest, reserves have become an asset for banks that is functionally equivalent to T-bills (highest quality, interest bearing, paying a floating rate of interest determined by the Fed). Banks now hold about $4 trillion worth of reserves, and that is a lot more than they are required to hold. Fed purchases of bonds do not necessarily impact the price of bonds, because the amount of money held in the form of reserves is <20% of total Treasury debt and a very small fraction of total debt securities. None of the above creates money or directly impacts the M2 money supply.
Money is created when banks lend money to their customers. A loan is funded by banks simply crediting the account of borrowers. Before 2009, banks were limited in their ability to lend because to increase their lending they had to increase their holdings of reserves, and the total supply of reserves was limited by the Fed; if the Fed wanted to reduce M2, the Fed simply sold bonds and retired reserves. Since 2009, the Fed stopped limiting the supply of reserves and banks found reserves to be a very safe and attractive asset. Banks now hold reserves that are well above the amount they are required to hold. Banks were effectively lending money to the Fed. Beginning in 2020, banks began to increase their lending, and that increase can be seen in a surge in deposits (i.e., rapid growth of M2, 90% of which is bank deposits of various sorts.
Grechster, re why markets are not expecting as much inflation as I am. The bond market is pretty smart, but it doesn't always get things right. I hate to be in opposition to the all-powerful bond market, but this time I think I'm right. The Fed and the bond market have a complex interaction where one leads the other and vice versa. Right now the bond market trusts that the Fed will keep inflation under control. But no one can be sure of the future. In the end, it boils down to whether the Fed can peg interest rates at just the right level to keep the system from spinning out of control. The Fed is human, though, and humans are fallible.
I keep returning to how amazing it is that hardly anyone is talking about the M2 money supply. We are witnessing an historical event in the making, totally unprecedented, but only a few are willing to say that the emperor has no clothes. It's also worth noting that the Fed has never really faced an inflation threat in an era of almost unlimited reserves. In the past, the Fed directly controlled the supply of reserves and this was a powerful tool, perhaps more powerful than their other tool, setting the funds rate. Today they can't control reserves at all; they must rely solely on using the Fed funds rate to control the economy. Limiting reserves created a physical shortage of liquidity that the economy was forced to adjust to; now that can't happen. Will they get the funds rate right, at the right time? We will see.
Ok, thank you Scott.
I am still having a problem fully understanding Reserves. Sorry.
You say that "Before 2009, banks were limited in their ability to lend because to increase their lending they had to increase their holdings of reserves, and the total supply of reserves was limited by the Fed".
Aside from the reserves created by the Fed buying bonds from banks, I thought that if banks took in more deposits (from the public) then their reserves would increase as well (nothing to do with the Fed), and this would allow them to loan out more money. Isn't this the most original, conventional form of bank lending?: banks take in a certain amount of money from the public, they hold a certain amount in reserves, as required by the Fed, and the rest is loaned out. This lending does not seem to be controlled by the Fed.
Unless you are saying that the Fed decides - as well - whether banks can even deposit the required reserves with the Fed - and, thus, be able to loan out the balance of their depositors' money? In other words, banks can't just "deposit" reserves with the Fed, it is up to the Fed to take those deposits. And, only if the Fed takes these deposits (reserves) then, and only then, can banks make loans?
Again, thank you.
Richard H.
@Unknown Richard
Mr. Grannis describes above how commercial banks create money (outside money) by balance sheet expansion: banks create a money deposit (their liability) and a matched loan (their asset). As long as there's room to grow the deposit base (and other regulatory ratios), banks can create money and expand their balance sheets.
-----
Mr. Grannis,
Please help reconcile:
-"if the Fed wanted to reduce M2, the Fed simply sold bonds and retired reserves."
which is simply quantitative tightening (reverse operation of easing).
-"None of the above {Fed purchases of bonds} creates money or directly impacts the M2 money supply."
which is quantitative easing.
???
-----
The surge in new deposits since early 2020 is in large part due to Fed open market operations. You need to take into account what simultaneously happens on the private participants'(institution, pension fund etc) balance sheets. When the Fed eases, a cash deposit is created (through the bank as an intermediate) for the institution and this new deposit now counts in M2. For the institution, it's simply an asset swap: holding a bond to holding cash.
If you don't believe a know-nothing who trained in an unrelated field just take a look at this Bank of England publication. pages 8-12 fig.3
https://www.bankofengland.co.uk/-/media/boe/files/quarterly-bulletin/2014/money-creation-in-the-modern-economy.pdf
At the wholly consolidated systemic level, QE does not create money because the government debt still exists and is (still) not expected to be forgiven but the way M2 is measured, bank reserves (both required and excess) are included and Fed easing open market operations do directly and dollar-for-dollar result in increased M2. This is why M2 continued to rise right after the Great Financial Crisis even if loan origination shrank significantly.
-----
Of course, increasing money supply, keeping everything else constant, will have a tendency to cause inflation but some kinds of money creation are more equal than others.
Who carry's the components of M2 as distinct from currency in circulation?
Maybe much of that M2 is on high income/net worth individuals balance sheets with low MPC and some could also be in reserve as business cost subsidies. In other words, earmarked for funding business operations instead of consumer consumption.
Regarding durable goods inflation it's like we broke global economies of scale and scope with government shutdown policy. There was long term global minimum efficient scale discovery at work. This should bend back down hopefully sooner rather than later.
Ataraxia, re the components of M2: There is very little if any institutional, corporate, or high net worth money in M2. Components are all retail-oriented: currency in circulation, retail money market funds, small time deposits, checking accounts and savings accounts. Savings accounts are the largest component of M2: almost 60%.
^Interesting article related to the effect of QE in early 2020, specifically about the link to checkable (or demand) deposits which are part of M1 (so also part of M2 which is an expanded form of M1):
https://fedguy.com/the-mechanics-of-quantitative-easing-and-m2/
-----
The uneven distribution of deposits is also interesting. An uneven distribution of deposits is part of the natural course of human events if productive growth is the idea. However, one has to wonder if there is Laffer-curve-tax effect if the uneven distribution gets to certain levels.
In the last twenty years, deposit concentration at the top has significantly increased. Since early 2020, using checkable deposits as a proxy, the deposit distribution has become even more uneven. Out of the 2.5-6T increase in checkable deposits, 54% of the increase is found in the accounts of the wealthiest 10% of households, 42% went to the next 40% group, averaging $25k per household. The bottom 50% got only 4% of the increased deposits, an average of $2,000 per household, and that's not accounting for inflation rates which also has an uneven distribution (in the opposite direction though...).
Take a look:
https://fred.stlouisfed.org/graph/fredgraph.pdf?hires=1&type=application/pdf&bgcolor=%23e1e9f0&chart_type=line&drp=0&fo=open%20sans&graph_bgcolor=%23ffffff&height=450&mode=fred&recession_bars=on&txtcolor=%23444444&ts=12&tts=12&width=1168&nt=0&thu=0&trc=0&show_legend=yes&show_axis_titles=yes&show_tooltip=yes&id=WFRBLT01005,WFRBLB50086,WFRBLN09032&scale=left,left,left&cosd=1989-07-01,1989-07-01,1989-07-01&coed=2021-07-01,2021-07-01,2021-07-01&line_color=%234572a7,%23aa4643,%2389a54e&link_values=false,false,false&line_style=solid,solid,solid&mark_type=none,none,none&mw=3,3,3&lw=2,2,2&ost=-99999,-99999,-99999&oet=99999,99999,99999&mma=0,0,0&fml=a,a,a&fq=Quarterly,Quarterly,Quarterly&fam=avg,avg,avg&fgst=lin,lin,lin&fgsnd=2020-02-01,2020-02-01,2020-02-01&line_index=1,2,3&transformation=lin,lin,lin&vintage_date=2022-01-31,2022-01-31,2022-01-31&revision_date=2022-01-31,2022-01-31,2022-0
It was Keynes, in the 30s, who lamented at the rentier's relatively low propensity to consume and who pushed for redistribution to those who needed cash for survival. QE's unintended consequences are being discovered and a cynic may suggest that the set-up may be intended to become a self-fulfilling prophecy.
The last time inequality reached such levels, inflation did not become what people worried about, and for quite some time.
I have a difficult time believing that the average American household suddenly found the discipline not to spend their newfound disposable income.
Even with the increased fear and uncertainty that must have largely faded for the vast majority of households having made it through by sheer luck of vocation and life position.
I admittedly arbitrarily believe that the extra transfers and stimulus went straight to food, fuel, and a windfall surprise of subsidized durable and entertainment goods for use in lockdowns. Of course this would be for the households that lived the proverbial "paycheck to paycheck."
1/30/2022 9:52 AM posting in comments seems as much a plug to SELL stocks as buy them please? If you have a lack of confidence in the Fed, and the bond market both, why not bet that they tighten too much given that you are certainly not the only one aware of the excess reserves please?
Thank you as always for your amazing posts.
Love the charts and analysis. The Fed might be overdoing it.
That makes up for the monetary suffocation of 2007-14.
You know, the way floods make up for droughts.
@Carl
What you post and that link I just opened of yours seems to corroborate the relationship between M2 and MPC of those already well off.
Since wealth seems distributed in more exponential fashion than linear we need not go too far right along that line before we find those people with low MPC.
The "normal" wealthy (as district to "won the game" wealthy) households and lucrative small businesses that survived need not spend M2 on more goods and services. They could invest it but that's another conversation.
There's probably a discontinuity where ultra high net worth as Scott mentions don't even bother with normal assets pertaining to M2.
At any rate thank you and Scott for the responses.
"It was Keynes, in the 30s, who lamented at the rentier's relatively low propensity to consume and who pushed for redistribution to those who needed cash for survival." We can all agree redistribution has changed somewhat since Keynes times - and he might have a different opinion with todays metrics.
Measures of inequality also seriously fail to capture net improvement in the entire spectrum with a larger economy. https://www.wsj.com/articles/about-all-those-pandemic-billionaires-world-inequality-report-thomas-piketty-11638991033?st=n7ttt23mx08imj3&reflink=desktopwebshare_permalink
That said, todays inequalities, in my view, are critically out of line. The question is what to do about it. Just about everything, again in my view, that progressives world wide attempt generally makes things worse. Subsidies and disability policies that destroy work incentives; banking "reform" that runs community banks out of business; over regulation even at the small business level that makes it too difficult for unsophisticated to start a business; utter destruction of public education; renewable energy policies that are highly regressive; property zoning that prevents lower earners out of good school districts and safe zones; etc.
Not that the other side has posited much other than tax cuts and deregulation. Which is nice and all... but lacks something a little more tangible to the day to day of those wondering what that means to them. Acknowledging no easy answers, but battling soft corruption would seem a good start.
Re "inequality." The marginal propensity to consume (MPC) that Keynes talked about is a meaningless concept in supply-side theory. The economy does not grow because people consume, it grows because people produce. You only acquire purchasing power to the degree you produce. If the government intervenes and redistributes money from those with low MPC to those with high MPC then the results will be the opposite of what is desired. Those with high MPC are typically those who don't work or produce much, whereas those with low MPC and those who are the most productive. Taking from the productive to give to the non-productive is a sure-fire way to weaken an economy.
Tax cuts and deregulation have the virtue of shrinking the government and making the economy more efficient. Efficiency is one source of productivity, and productivity (making more with the same amount of inputs) is what lifts living standards. "Inequality" exists only in the eye of the beholder. "Fair" is a similar concept. Very subjective.
EHR, re whether believing (as I do) that the Fed and the bond market are wrong about inflation, and whether that is a valid reason for selling stocks. That's a very difficult circle to square, I'll be happy to admit.
I think the Fed is making a mistake, and that mistake will result in higher-than-expected inflation, and ultimately, in the Fed being tighter than expected. And of course that is the pattern that has played out in nearly every recession with the exception of 2020.
For one, I may believe they are making a mistake, but I could be wrong. And selling stocks is a serious matter, since it is relatively easy to sell when one is worried, but it is more difficult to know when to buy them back. (That's a stand-alone argument for buy and hold.)
Two, nearly everyone is aware that the Fed might be mistaken, that Biden may be incompetent, that geopolitical tensions are troublesome (to say the least), and that interest rates are extremely low (thus creating a skewed distribution for the returns on bonds—that is, more risk to the downside than to the upside. Everyone knows that very tight monetary policy is very likely to lead to a recession and a bear market in stocks.
Three, timing is (nearly) everything. Selling now means earning nearly zero on your cash, and that means losing upwards of 7-10% per year in purchasing power. Selling therefore comes with a huge cost. If you sell and the stock market is flat, you have lost a lot. The stock market has to fall by almost as much as inflation is rising before you begin to lose purchasing power.
Four, the Fed seems highly unlikely to tighten aggressively in the near term. Fed errors can go on for many months, even years, before the market really begins to panic.
All things considered, it's certainly possible that selling now is premature. It's even possible that the Fed could get lucky: they may be underestimating inflation today, but they could realize their mistake and make the necessary corrections before too much time passes.
Five, it's very true that the market is displaying very little if any evidence of monetary policy being too tight. Credit spreads are very low, inflation expectations are only 2.5% per year over the next 10 years, the dollar is relatively strong, and gold is relatively flat. If these conditions hold, I will have been wrong to worry, but right to not sell.
But if there is anything actionable about what I'm saying, it is that bonds and cash are not a very attractive investment. Even if inflation falls to 2% like many on the FOMC expect, the current yield on bonds is still quite unattractive (i.e., real returns are negative). And of course the yield on cash is even more negative. All in the context of an equity market where expected returns over the long haul are still reasonably positive.
Plus, the near-zero yield on cash is strong evidence that the market is very pessimistic, because to hold significant amounts of cash these days is extremely expensive. People only buy zero- or low-yielding cash when they fear even greater losses on other assets. So the market is not overly optimistic; it is arguably at least somewhat pessimistic. And big downside events rarely happen when everyone is worried about them.
Redistribution is not the answer and i don't know what's to be done. But.
Government's share of GDP has been growing (bipartisan push) and the trickle-down works less and less and both opposing tribes are getting larger and both point the finger to the other, with growing debt helping to extend and pretend.
The concern is that redistribution may be imposed on us, whether we like it or not. A respected mentor once said organize yourself or we'll organize you.
i've been reading on the Romanovs (dynasty who tried to manage supply side and trickle down in the 19th century, leading to 1917. One of the remarkable features was flat real wages for the common man, something which has been happening to America for the last 40 years.
-----
In my book, stocks still yield higher than other asset classes but the compression in yields for all major asset classes have never been this tight. Everything is relative i guess but one has to remember that the buy-and-hold strategy sometimes requires a very long time to play out (in both directions).
-----
A key aspect about this inflation 'debate' is to 'see' if the economy will be self-sustaining coming out of the pandemic episode. My take on the numbers suggests that it's already showing signs of fatigue. The yield curve is incredibly flat and the Fed is still widely accommodative.
Well, take good news where you can find it...
Unit labor costs in the nonfarm business sector increased 3.3 percent in 2021---BLS
OK, that's an annual average, and maybe it will go higher in 2022.
Still, a 3.3% rise in unit labor costs, in such a difficult year, does not strike me as "sound the klaxons" time.
The Fed, and the ever-clunky federal government, have been operating in a pandemic environment. The federal government has magnified every problem 10-fold, but we still see only 3.3% rise in unit labor costs.
I will call that good news.
Great jobs report today and revised last month was even better. Wages growing 5.7%. Fed is behind the curve big time!
Don't get too excited about today's jobs numbers. As Brian Wesbury points out "Every January, the Labor Department inserts new Census data on the size of the US population, which affects the numbers on the labor force and employment. That population adjustment was responsible for all the increase in civilian employment in January; without that quirk, the BLS would have reported a 272,000 drop in civilian employment and a 137,000 decline in the labor force. We're not suggesting the January employment report was "bad" news; we're just demonstrating that it doesn't deserve the exuberance that the headline payroll number suggests." https://www.ftportfolios.com/retail/blogs/Economics/index.aspx
credit swap spreads are rising a bit...
"I am fascinated by the fact that these days hardly anyone is talking about the very rapid growth in both M2 and nominal GDP."
Most people don't know what M2 or nominal GDP is
We complain enough about inflation.
Every time we pay a bill or go to a store.
My analysis of the January employment data from one of my blogs
Summary:
The numbers are a steaming pile of you know what.
Ignore the numbers.
I've been watching employment data since the 1970s.
This week's data are so unusual I do not believe them
for one minute.
New Payroll Jobs raw data in the past THREE months
(excluding seasonal adjustments), and then I remove
the Net Birth and Death of Businesses Model adjustment:
Data source: https://www.bls.gov/web/empsit/cesbd.htm
November +900,000 jobs, less 17,000 Birth Death = +883,000
December +139,000 jobs, plus 42,000 Birth Death = +181,000
January -2,824,000 jobs, plus 114,000 Birth Death = -2,710,000
Total raw data: -1,646,000 lost jobs
Payroll Raw Data vs. Payroll Adjusted Data
for the past THREE months:
Raw data: -1,646,000 lost jobs in 3 months
After adjustments: +1,629,000 new jobs in 3 months
( +647,000 Nov. + 510,000 Dec. + 467,000 Jan. = +1,629,000 )
My comparison of several data sources
for the past TWO months,
from November 2021 through January 2022
reflect unusually large differences:
ADP Private Sector Employed up +415,000 people
Establishment Survey Employed up +977,000 people
Household Survey Employed up +1,850,000 people
These are very unusual differences.
I spent a few minutes reading that Brian Wesbury blog
at the link. He is not much of an economist, in my opinion.
Concerning 4Q Real GDP growth, he failed to mention
that 4.9 percentage points of the 6.9% annual growth rate was
from increased inventories. An important point he missed.
Concerning Covid vaccines,
he claims they saved a lot of lives.
Just wild speculation. No data.
Statistics do not support his claim.
Total US deaths with Covid in 2021
were considerably higher than in 2020.
Total US deaths from all causes in 2021
were higher than in 2020 (both are CDC data)
Both statistics are evidence the vaccines were failures.
They were supposed to save lots of lives,
yet more lives were lost in 2021.
In addition, Wesbury shows a chart claiming almost all
US deaths with Covid are the unvaccinated, not sophisticated
enough to check other nations -- no other nation is reporting
that trend, making the claim for the US very suspicious.
Heavily vaccinated Israel, for one example, is leading
the world in Covid deaths per one million people.
Deaths per million are very low in India and African nations,
all with very low vaccination rates.
Concerning the January jobs report Wesbury mentions
the population adjustment that ruins the January
Establishment data every year.
He misses the very unusual HUGE difference
between ATP data released on Wednesday (-301,000 jobs)
with Labor Department data released on Friday.
Even if you look at TWO months, December 2021 and January 2022,
ATP shows +415,000 new jobs while the payroll number is +977,000
new jobs, an unusually large difference. Worth mentioning.
In addition, Wesbury does not seem interested in analyzing
the Establishment Survey payroll data, which reported +1,176,000
new payroll jobs, consisting of:
+467,000 new jobs in January 2022 (preliminary data)
+311,000 more jobs for first December 2021 revision
+398.000 more jobs for second November 2021 revision
Total +1,176,000 new jobs reported in January including Nov. and Dec. revisions
That's a HUGE increase versus the prior month.
Very suspicious.
Also not mentioned were large downward adjustments
in mid-2021 months, offsetting increases in November
and December 2021. Very suspicious adjustments,
A good economist would analyze data quality more than just
reporting the data. I wonder how many recessions Wesbury
has ever predicted before they began. Probably few, if any.
CORRECTION
Concerning the January jobs report Wesbury mentions
the population adjustment that ruins the January
Household data every year.
@Cliff Claven
A question:
For Covid-19, do you think George Soros is involved?
-----
2 more questions:
1-From WSJ: "Thirty years ago, America’s prime-age work rate was nearly 10 percentage points above Europe’s. Now Europe’s is a couple of points higher than America’s."
Why is that?
2-Like with jobs numbers, productivity numbers (as reported) have shown a lot of noise, especially lately, but long term trends continue to signal secular negative trends.
Why is that?
-----
Bonus question:
How can 'we' constructively argue when 'we' can't even get our basic facts straight?
Employment/Unemmployment BLS stats: the first estimate (the one the media provides breathless coverage of), are notoriously "poor quality". The revisions are huge. I tried to find a study of the revision history, but it was difficult. It might be some kind of google misinformation (really). Most of these numbers are better used as 3 month averages. That limits their use for short term trading, but does allow them to be used for longer term decision making.
Covid data, especially death rate related: these have to be adjusted if you want to know the "basics"/compare from nation to nation. The biggest single medical condition that correlates with fatalities is obesity. Therefore, places like the US, with its high obesity rate, will have higher fatality rates- no matter which political party you like. Similarly, another statistic that correlates with fatalities is age- which correlates with medical comorbidities/conditions. So, the numbers should be adjusted as such- for age, obesity, etc., if you want to compare effectiveness of response, e.g. vaccines, lock downs, social distancing, masks.
Of course, this is a lot of work and it's easier just to pick what study you like.
The one thing for sure is that the "elites" in the medical community (mostly progressive), got it very wrong about "stopping" the spread via masks, vaccines, etc. As usual, reality is more complicated than that. The vaccines and masks help somewhat, but are not able to stop the spread. They probably just delay it enough to get enough medical care to help more people.
That's it.
Tough questions !
Smart people ask a lot of tough questions.
Maybe you should find a smart person for answers?
Because as I grow older, I notice an alarming increas
in the number of subjects I know nothing about !
I knew everything when I was a teenager.
Maybe next time ask what flavor of ice cream I like?
>>> "For Covid-19, do you think George Soros is involved?"
Don't know. I don't follow George Soros, although I don't like him
>>>> From WSJ: "Thirty years ago, America’s prime-age work rate was nearly 10 percentage points above Europe’s. Now Europe’s is a couple of points higher than America’s."
I looked at labor force participation rate for US versus EU.
I wanted the employment rate but didn't find that for the EU
In the US the participation rate rose to about 67% in 2002 and is now about 62%
Source:https://tradingeconomics.com/united-states/labor-force-participation-rate
For the EU the participation rate was about 69% in 2004 (did not have earlier data) and rose to over 74% now
Source: https://tradingeconomics.com/euro-area/labor-force-participation-rate
I have no idea why the labor force participation trends are so different.
But I do admire the question !
Maybe someone else knows?
>>>>> "productivity numbers (as reported) have shown a lot of noise, especially lately, but long term trends continue to signal secular negative trends.
Why is that?
Productivity increased at a 1.9 percent rate in 2021, slowing the 2.4 percent growth logged in 2020. Slow but not negative.
Source: https://www.theepochtimes.com/us-worker-productivity-rebounds-in-fourth-quarter-labor-costs-tepid_4256861.html
Productivity growth is easiest in manufacturing and tougher with services.
We have had large productivity gains in manufacturing but have also outsourced a lot of manufacturing to Asia where labor costs are low. We also have a lot of government spending -- can't expect much productivity gains in government. I see $10 trillion of government spending at all levels and a GDP of $23 trillion. That's a lot of government. Way too much. Computers / internet boosted productivity growth for a few years in the 1990s. Not so much after that.
-----
>>>>> Bonus question:
How can 'we' constructively argue when 'we' can't even get our basic facts straight?
A lot of arguments are about the future. The future economy, future climate, future Covid, 2022 election etc. There are no facts and data for the future. Just speculation, extrapolating current trends (guessing) and beliefs not based on facts, data and logic. This blog presents facts, data and logic about the present and past. There are plenty of other sources for speculation about the future.
It's not always easy to explain the present. Covid case, hospitalization and death statistics, for example, are grossly overstated by new counting methods.
And this blog pointed out very early in the Covid pandemic that the lock downs were a horrible economic mistake. We are finally getting studies showing the lock downs saved almost no lives.They WERE a huge mistake. And the vaccines have not reduced deaths in 2021, whether considering deaths with Covid or total US deaths -- bother higher than in 2020. With all the BS coming from Washington DC, it's easy to get facts wrong.
-On the coronavirus
@Cliff Claven
You mix several issues and the comment "the vaccines have not reduced deaths in 2021" suggests a fundamental problem with integration of basic biologic and math concepts. Politics is about the compromise between conflicting values but it's kind of important to be able to get basic facts right before engaging in policy 'discussions'.
@wkevinw
You bring many interesting points but on top of age and obesity, i would add the 'difficulty' in the institutional implementation of cost-effective policies (the country getting its act together) and falling behind during the vaccination roll-out and targeted boosters after. The NYT had a fact-based article recently on this.
https://www.nytimes.com/interactive/2022/02/01/science/covid-deaths-united-states.html
"They probably just delay it enough to get enough medical care to help more people."
Isn't this the secular mantra of healthcare expenditures in general in developed countries now (with the US at a higher order of magnitude)?
-----
Back to labor participation and productivity.
The following was released was in 2015 (since then trends are the same, except accelerating):
https://research.stlouisfed.org/publications/economic-synopses/2015/07/31/a-cross-country-comparison-of-labor-force-participation/
Nobody knows The Answer but it looks like higher rates of young and able people watching TV and 'socializing' instead of meaningful workforce participation will tend to impact productivity numbers.
-----
Maybe a connecting factor between all these 'variables' is that people like Mr. Wesbury can 'paint' a fact-based picture about covid (just like it's possible to do such for debt, entitlements etc) and 'people' focus on tribal-schools-of-thought discussions instead of implementing meaningful reforms.
" 'difficulty' in the institutional implementation of cost-effective policies (the country getting its act together) and falling behind during the vaccination roll-out and targeted boosters after. The NYT had a fact-based article recently on this.
https://www.nytimes.com/interactive/2022/02/01/science/covid-deaths-united-states.html"
I went ahead and read the NYTimes article, which wasn't bad, but had the usual shallow treatment. The math modelers can model a lot of the correlations, and probably have, but NYTimes and other main stream reporters can't be bothered to check on that.
The other telling stat is that the US has a higher case load rate. This is another potential problem with the future. It seems (my assessment) that Covid19 is "always waiting" for the next wave- meaning the world may be dealing with these waves for several years. If the Omicron variant is an example of the textbook predictions, the waves should show more cases and a lower fatality rate.
I haven't read much in the NYT since the early 2000's retractions, law suits, etc. about Duke University, several "journalists" that were fired for fraudulent publishing, and being totally fooled by the Babylon Bee site. (the NYT failures go back for nearly a century for those interested in some amusement).
The tough thing about the NYT - they have world class reporters and production artists that produce fantastic content. But they have more reporters, contributors and editors that are just an embarrassment. It's too much cognitive dissonance to me for both to share the same space.
The global media is colored beyond credibility anymore. This is one reason I try to find smart people somewhat disconnected from political incentives for my information. This blog has been that. Even FED data is colored and re-defines over the years. I trust Scott see's through some of that.
Carl please convert your word salad about Covid vaccines into English
There were more US Covid deaths and more total US deaths in 2021 than 2020.
2020 total deaths were +20% higher than 2019 mainly due to Covid
2021 deaths were supposed to decline significantly because of vaccines.
They did not decline. They increased.
The vaccines failed to accomplish their primary goal.
Therefore, it is fair to declare the vaccines were failures.
I tried to explain this simply so a 12 year old could understand it.
Please go find a twelve year old to explain it to you.
"Please go find a twelve year old to explain it to you."
For the basic math and family discussions (risk management with covid), we've used this reference:
https://ourworldindata.org/covid-deaths-by-vaccination
BTW, during online engagement, i've noticed (my side too) that it's often not the capacity to comprehend that is lacking, and that's partly related to basic biology of human brain functioning.
Post a Comment