


(This is an updated and rewritten version of a post I wrote about seven months ago.)
I've mentioned the demand for money countless times in the 10-yr history of this blog because it's a very important and under-appreciated macro variable. The Fed controls the supply of money, but the demand for money is a function of a variety of factors, some of which are beyond the Fed's ability to control. The secret to any central bank's ability to deliver low and stable inflation is to keep the supply and demand for money in balance, even though it is difficult to track the demand for money without the benefit of hindsight. As Milton Friedman taught us, inflation is always and everywhere a monetary phenomenon; inflation results from an excess of money relative to the demand for it. It's that simple. Unfortunately, you don't see many people, including the Fed, talking about this, because it's not easy or straightforward. That's one of the things this blog tries to bring to the table.
From 2008 through the summer of 2017, the demand for money (which I define as the M2 money supply divided by nominal GDP) was in a pronounced uptrend, because M2 growth exceeded nominal GDP growth. This in turn was driven by a widespread desire on the part of individuals, investors, and corporations to increase their holdings of money relative to their incomes and as a share of their portfolio, which in turn was a natural reaction to the profound shock of the global financial crisis and the Great Recession of 2008-9. Everyone wanted the safety of money, and they wanted more of it.
From 2008 through the summer of 2017, the demand for money (which I define as the M2 money supply divided by nominal GDP) was in a pronounced uptrend, because M2 growth exceeded nominal GDP growth. This in turn was driven by a widespread desire on the part of individuals, investors, and corporations to increase their holdings of money relative to their incomes and as a share of their portfolio, which in turn was a natural reaction to the profound shock of the global financial crisis and the Great Recession of 2008-9. Everyone wanted the safety of money, and they wanted more of it.
During this same period of rising money demand, the Fed engineered an astounding and unprecedented increase in the monetary base, expanding its balance sheet by buying trillions of dollars of notes and bonds. The fact that inflation remained low (~1.5 - 2%) and relatively stable throughout this period can only mean that the Fed correctly responded to strong money demand by dramatically expanding the supply of money. Inflation was not a problem because the Fed kept the supply and demand for money in balance.
The Fed was unfortunately a bit slow to react to the surge in money demand, but by late 2008 they adopted a radically new monetary policy which they dubbed Quantitative Easing (QE). Most people erroneously believed, and still believe, that the objective of QE was to stimulate the economy by printing money and otherwise making money cheap (i.e., by keeping interest rates artificially low). I have argued in numerous posts over the years that this was most definitely NOT the case. The purpose of QE was to accommodate the market's almost-insatiable demand for risk-free, liquid assets.
In the wake of the near-collapse of the global financial system, the world was desperate to acquire more T-bills, the gold standard for safe money. The demand for T-bills was so extreme that there were not enough in supply—in fact, the Fed was essentially forced to sell virtually all of its T-bill holdings in the first half of 2008 in an attempt to satisfy demand. Without enough safe and liquid securities to satisfy the demand for such, the financial system was in serious danger of imploding. The Fed solved this problem by buying trillions of dollars of notes and bonds and paying for them with bank reserves, which they also announced would for the first time ever begin to pay a risk-free rate of interest. (Bank reserves, crucially, are not "money" that can be spent like dollars can.) The banking system was happy to use their strong inflows of savings deposits to invest in and hold all these new bank reserves, which had suddenly become a valuable asset, being risk-free and interest-bearing, just like T-bills. Banks were risk-averse too, just like the general population. Bank reserves today are best thought of as T-bill equivalents.
Now, however, it makes sense for the Fed to reverse the QE process at least in part, because the crisis of confidence has begun to reverse, risk aversion has begun to fade, and the demand for money appears to have stabilized, at least for now. The Fed already has reversed some of its QE, by reducing excess reserves from a high of $2.7 trillion in 2014 to now $1.5 trillion. In fact, if the Fed had NOT reversed at least some of its QE, they would have run the serious risk of allowing there to be too much money relative to the demand for it, and that would have led to a destabilization/devaluation of the dollar and an unwanted rise in inflation.
If the demand for money weakens from its current level, as it likely would if confidence rises and economic growth remains healthy, then the Fed will be justified in further reducing the size of its balance sheet and raising its short-term interest rate target. And while the market may fret again about rising rates, it needn't be problematic if rising rates are tied to rising confidence, and declining risk aversion.
As always, here are charts that provide the evidence for my story:

The M2 measure of money supply is considered by most economists to be the best measure of "money." As Chart #1 shows, M2 consists of currency, checking accounts, bank savings deposits, and retail money market funds, all of which are liquid, safe, and easy to spend. The largest component by far is bank savings deposits, which grew from $4 trillion at the end of 2008 to now $9.4 trillion. In fact, the growth of savings deposits far outstripped the demand for the other components of M2: savings deposits were about 50% of M2 at the end of 2008, and now they are almost 65%. This is significant, because until 2017 bank savings deposits paid almost nothing in the way of interest, yet people were happy to increase their savings deposits because they offered safety and liquidity. Bank savings deposits in an era of zero interest rates were thus an excellent measure of money demand.
Chart #1

The M2 measure of money supply is considered by most economists to be the best measure of "money." As Chart #1 shows, M2 consists of currency, checking accounts, bank savings deposits, and retail money market funds, all of which are liquid, safe, and easy to spend. The largest component by far is bank savings deposits, which grew from $4 trillion at the end of 2008 to now $9.4 trillion. In fact, the growth of savings deposits far outstripped the demand for the other components of M2: savings deposits were about 50% of M2 at the end of 2008, and now they are almost 65%. This is significant, because until 2017 bank savings deposits paid almost nothing in the way of interest, yet people were happy to increase their savings deposits because they offered safety and liquidity. Bank savings deposits in an era of zero interest rates were thus an excellent measure of money demand.
Chart #2

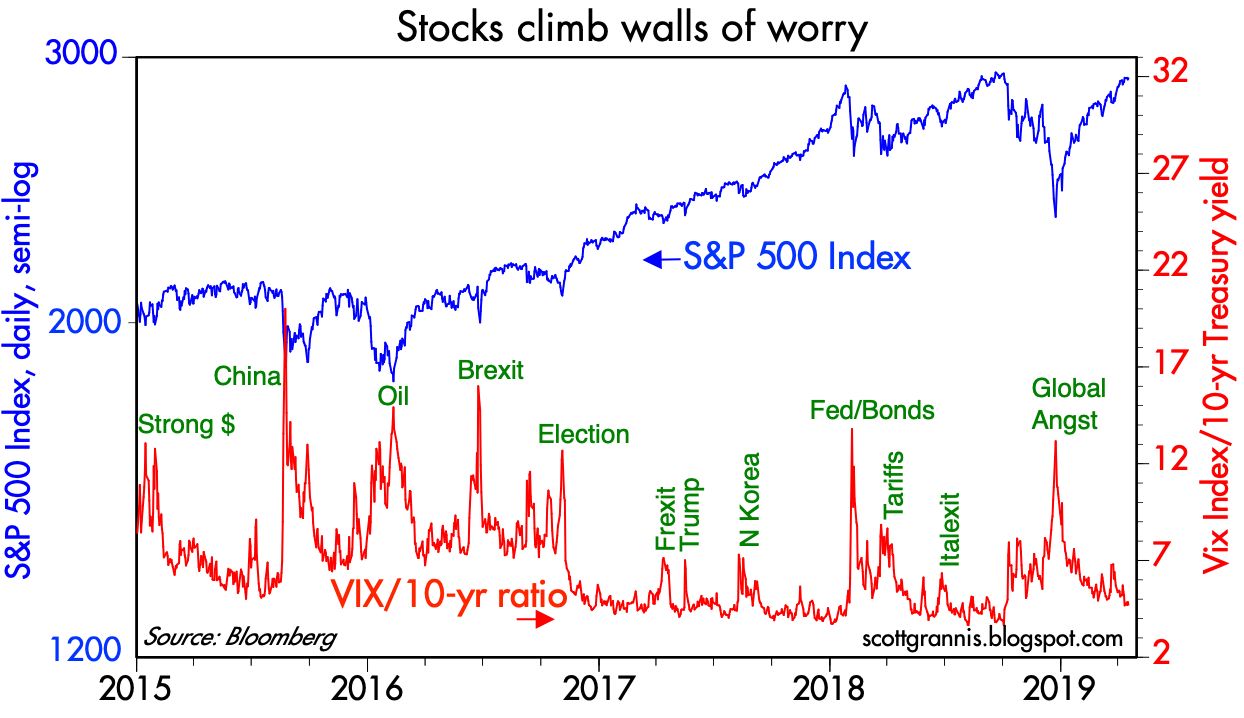
It's noteworthy that the big decline of money demand in 2017 coincided with a surge in equity prices. People wanted less money, and they evidently wanted to put some of their money to work in the stock market. Money demand has been flat for the past year or so, so it's not surprising that equity prices have yet to meaningfully exceed their 2017 highs. (See Chart #9 below for a detailed look at equity prices in recent years.)
Chart #3

Chart #4

Chart #5

The demand for money appears to have peaked in the summer of 2017, after rising strongly for the previous decade. Money demand has since fallen a bit, and that is good evidence that risk aversion and caution are slowly giving way to increased risk-seeking. The last two data points in this chart are Q4/18 and Q1/19, the latter of which I've estimated using known data for M2 growth (currently running at a 3-4% rate) and the market's current estimate for nominal GDP, which is roughly 4%. Money demand didn't change much last quarter, which I view as a function of the severe downdraft in equity prices that occurred late last year, which in turn was driven by concerns that the Fed might over-tighten monetary policy.
Going forward, however, I suspect that money demand will resume its decline, since the economic and financial fundamentals remain healthy. If this trend continues, it has profound implications for future economic growth and the conduct of monetary policy.
I believe that, beginning one year or so ago, the dominant narrative switched from one in which people were willing to pay up for safety and liquidity (by accumulating cash) to now one in which the average person (or company, or investment manager) on the margin wants to reduce their holdings of "money" in favor of increasing their holdings of risky assets or just spending it. I think that narrative remains the operative one that will continue, barring, of course, unforeseen disasters.
I believe that, beginning one year or so ago, the dominant narrative switched from one in which people were willing to pay up for safety and liquidity (by accumulating cash) to now one in which the average person (or company, or investment manager) on the margin wants to reduce their holdings of "money" in favor of increasing their holdings of risky assets or just spending it. I think that narrative remains the operative one that will continue, barring, of course, unforeseen disasters.
Chart #6

This all has important implications for the Fed, because the Fed will need to take actions to offset the decline in the demand for money, or else it will risk igniting an unwanted increase in inflation. The Fed will need to raise short-term interest rates, and probably by more than the market currently expects (higher short-term rates have the effect of making savings deposits more attractive, thus counteracting the declining demand for same). The Fed will also need to resume the reduction in its balance sheet in order to reduce the supply of bank reserves as banks' demand for those reserves declines. This may cause the market consternation, but it will be exactly what is needed to ensure continued low and stable inflation and in turn a strong economy.
Chart #7

Chart #8

Chart #9
For now, things look fairly stable. Money demand and money supply are likely in balance. The economy is growing at a modest/moderate pace, and few expect that to change. Real and nominal interest rates are priced to the expectation that economic growth will be 2.5% (see Chart #7) and inflation will be about 2% for the foreseeable future (see Chart #8). Fear, uncertainty and doubt have fallen almost to normal levels (see Chart #9), and the bear market of late last year has been reversed. But a resumption in the decline of the demand for money, which would likely accompany a pickup in confidence and stronger growth, would change that dynamic, and almost certainly result in higher-than-currently-expected interest rates and higher equity prices.

32 comments:
Great thoughts from the past somewhat related to money supply:
In one of his first major speeches at the helm of the Federal Reserve, Bernanke told the Economic Club of New York in March 2006 that he “would not interpret the currently very flat yield curve as indicating a significant economic slowdown to come.” Instead, he favored using multiple sources of information, along with “frequent reality checks,” so that “we are less likely to be misled when a favored variable behaves in an unusual manner.”
Now a distinguished fellow in residence at the Brookings Institution in Washington, Bernanke declined a request last week for further comment on his 2006 remarks.
Bill Gross, then-manager of the world’s biggest bond fund and co-founder of Pacific Investment Management Co., said in a January 2007 interview that the shape of the curve wasn’t as accurate a recession predictor as it once was because demand for Treasuries by foreign central banks had distorted the traditional relationship.
“I don’t think I’m concerned with it,” Gross said. “I don’t think Bernanke’s concerned with it.” Gross, who announced his retirement from Janus Henderson Group Plc in February, did not respond to a request for comment.
Worries about an inverted 2-year/10-year curve amounted to “silliness,” Lou Crandall, chief economist of Wrightson ICAP in New York, wrote in a January 2006 note. In fact, few economists were standing by the theory that yield-curve inversions signaled a recession.
https://www.bondbuyer.com/articles/this-time-is-different-for-yield-curve-they-said-that-last-time
BC, I don't think "this time is different" I think EVERY time is different. Looking back at historical comparisons is folly because there are too many variables to effectively prognosticate the markets-tempting as it may be.
That said, someone will undoubtedly call a top-and by LUCK, will be right and they'll be hailed as the new financial seer. We can of course gain clues but do they actually help in trading? Having been around the markets for 30+ years as a successful trader, I seriously doubt it.
IF you are inclined to read the tea leaves, I would suggest that now is NOT a good time to put capital to work in stocks. Inverted yield curve, retail investor piling into stocks and that scary #2 chart "Savings Deposit Growth" shows that investors are certainly far more insouciant than they have been since the top in '07.
Glad I'm a trader!
Scott, thank you very much. I learn a lot from your posts and economy understanding. From #5 chart it seems 55%-60% is a zone of comfort for money demand. An angle of declines in the chart gives a chance of relatively stable growth for next 4 years. Is it right speculation assuming rationally of Fed and Cabinet?
It helps people to use the term credit instead of money when discussing the Fed. The Fed never prints money; its dollar bills are produced by the U.S. Treasury's presses. The Fed itself deals in IOUs that cannot themselves be submitted as legal tender; as the CP notes, member banks' reserves at the Fed are not "money". Inflation, in the sense of a general rise in all nominal prices, only occurs when people decide to use more of their credit for purchases of goods and services and less for their own financial reserves. The difficult question that academic economics has never been able to answer is why securities prices themselves are not part of the "monetary phenomenon" that is always and everywhere "inflation". That may explain the persistence of the notion that a central bank's purchasing of Treasury debt using the central bank's own nearly limitless credit is a monetary transaction in which the rest of us somehow participate.
Here's my valuation chart for today:
https://fred.stlouisfed.org/graph/?g=nFSH
I'm taking:
Wilshire 5000 Total Market Index (WILL5000IND)
Dividing that by:
National income: Corporate profits before tax (without IVA and CCAdj) (A053RC1Q027SBEA)
Then looking at percent change over time.
Conclusion: Things are not awful but things have been far better, but as GDP slows and consumption stalls, and leveraged debt increases, equity risk will be more and more exposed. Amen
I had to smooth out prior chart by adding-in GDP as a percent change and then max out time frame. Looks like a fairly normal range of activity, with a current down cycle; doesn't seem as-if America has become Great Again (I guess time will tell, as the clock ticks).
https://fred.stlouisfed.org/graph/?g=nFSW
Long time reader - just wanted to thank you for the insightful posts over the years ...and always backed up with data. It has helped me better understand the macro picture.
Sorry to hyperventilate, but it's interesting to look at that last chart and compare the Reagan tax cuts of 1981 and 1986, which essentially didn't amount to anything except a transfer of wealth from corporations to their insiders. That process has only accelerated since then, which is why America's infrastructure is falling apart today. If a case can be made as to why option grants and share buybacks are helping make better, I'd love to see proof of that on a FRED chart! Supercharging economic inequality and giving more cash to wealthy people is like adding jet fuel to a forest fire. In terms of politics -- if 2016 seemed like a stupid election, where 90 million eligible voters decided to not vote (for either idiot) one can only imagine how the upcoming election will bring us all together as one unified country ... can't wait. I assume the markets will embrace the chaos and everyone will get rich in the implosion.
Well, great blogging, but every time I read about QE, I feel like Bud, in the classic Abbott-Costello comedy sketch, "Who's on First?"
The Fed printed (digitized) money and bought Treasuries (and some MBS) after 2008, because the public wanted the safe and liquid asset of cash. But before 2008 the Fed sold Treasuries, as the public wanted safe and liquid asset of Treasuries. Okay, so when the public wants safe and liquid assets, the Fed sells US Treasuries and also buys US Treasuries. Okay, "Who's on First?"
Onto, What's on Second. The Fed prints money and buy bonds. From who? "No, who's on first." The Fed buys bonds from 22 primary dealers. From What? "No, What's on second." The 22 primary dealers deposit money into commercial banks, and those deposits create reserves.
Wait a minute. Where did the 22 primary dealers get the bonds. I don't know. "No, I don't know is on third." The primary dealers buy the bonds from customers or on the open market. So, really, didn't the Fed print money and buy US Treasuries? And the people who sold Treasuries to the 22 primary dealers---didn't they get the freshly digitized cash? I don't know---no, he's on second.
Okay, so people with liquid, safe Treasuries wanted to be in liquid and safe cash, so they sold safe and liquid Treasuries to the primary dealers in exchange for safe and liquid cash, who sold the Treasuries to the Fed? What? "No, what's on second!"
But before 2008, people with safe and liquid cash wanted to buy safe and liquid Treasuries.
Why would a person owning safe and liquid Treasuries sell to get into safe and liquid cash? What? "No, What's on second!"
Now, in the old, old days, when one would conduct advanced research with Fortran cards, we were taught about fractional reserves and the endogenous money supply. You see, when banks get reserves, or a deposit, then they can lend out seven-fold that amount of money in loans. The commercial banks print money? Well, I don't know. It's called the endogenous money supply. I think it is non-PC to say, "Commercial banks print money." Anyway, that is all old hat now.
Okay, so the Fed, worried about inflation at the bottom of the 2008 recession, when the economy was shrinking at a 10% annual rate, began to pay interest on excess reserves, so the commercial banks would not lend out the reserves, multiplied at seven to one. So, why not just make QE smaller, but not pay interest on excess reserves? I don't know. "No, I don't know is on third!"
Scott Grannis says all the Fed did with QE was "swap reserves for Treasuries." But what about the ultimate bond sellers, the ones who sold safe and liquid Treasuries to the 22 primary dealers in exchange for safe and liquid cash? If the Fed buys $1 trillion of Treasuries, do not the commercial banks get $1 trillion in reserves and the bond-sellers get $1 trillion in safe and liquid cash?
What? "No, what's on second!"
brave chicken -
I'm on board with the notion that wealth inequality has swung too far and is creating dangerous political and social movements (i.e. Sanders, Warren and AOC). Even that recent personal tax cuts were, well, stupid, given deficits during a booming economy. (Corporate tax cuts.. good.) But for the life of me, have a hard time connecting tax cuts to "a transfer of wealth from corporations to their insiders". Failed corporate governance is no doubt a big contributor to "poster" cases of inequality, but it's not really the big thing in my view.
Scott, between Benjamin's rant and Randy's absolutely INANE comments re "inequality" and tax cut being "stupid", you got some responding to do...
BTW, John Tamny does an exceptional job addressing this BS surrounding inequality and the gist of it is that people who CREATE billions of $ of wealth also create incredible advances for all of to benefit from. Think Bezos, Jobs, Gates the list goes on. Nullifying the incentive to RISK capital for great gain is what's stupid NOT tax cuts.
That said, I am damn worried that some dumbass like Sanders will get the keys in 2020. It absolutely pisses me off that we have to choose between the idiot who occupies the White House now and a GD socialist.
Benjamin: Re where is the money, etc:I think you've made it too complicated and thus confusing. In a nutshell, here is the bottom line of what happened:
Savers deposited tons of cash in bank savings accounts, seeking safety. Banks used that cash to buy notes and bonds, which they then sold to the Fed in exchange for bank reserves, which they were happy to hold, because banks were also seeking safety for their investments and bank reserves were safe, interest-bearing assets, just like T-bills.
Here is what didn't happen: Banks didn't use their deposit inflows to make loans to people or businesses, as they ordinarily would have. Banks didn't use the bulk of their new reserve holdings to increase lending. Massive amounts of money thus were not created or printed, as could theoretically happen with such a huge expansion of bank reserves.
Re inequality: There is a strong case to be made that there has NOT been a significant increase in income and wealth equality in the US, provided one uses the appropriate data and analytical tools. Mark Perry has posted numerous times on this subject.
That said, "inequality" of results/income/wealth is virtually guaranteed to occur in a free market economy. Not everyone can create the same amount of value added, and some people create far more than the majority; in the end, one's income and wealth is a by-product of his or her value added. Trying to stop or mitigate this by government decree would be foolhardy to say the least, and would very likely only make inequality worse. Government intervention in the economy almost always results in unexpected and perverse results.
Worrying about tax cuts (provided they are pro-growth, as the business tax cuts were) and worrying about income/wealth inequality is foolish and ultimately anti-growth. Not all tax cuts are good, of course. The good ones are those which increase people's incentive to work, save, invest, and take on risk. Cutting sales taxes does not qualify, for example.
Scott: thanks for your reply.
But you know that commercial banks do not sell Treasuries to the Fed. The Fed only operates through transactions with the 22 primary dealers, who are explicitly not commercial banks.
Okay, let us say savers wanted to make more deposits after 2008. So commercial banks have a lot of deposits. So the banks invest in US Treasuries as a safe and liquid asset.
So then why would a commercial bank then sell a safe and liquid Treasury bond to a primary dealer, who in turn sells a Treasury bond to the Fed and then makes a deposit into the commercial bank?
The commercial bank, by selling a safe and liquid Treasury bond to the primary dealer, who then sells the Treasury bond to the Fed, ends up with a deposit from the primary dealer.
So, in this scenario, commercial banks accept deposits which they invest into safe and liquid Treasury bonds but then they sell the Treasury bonds to the primary dealers so they can get deposits. Who is on first?
Unless interest on reserves is higher than the yield on a safe and liquid Treasury bond, I don't see why a commercial bank would engage in this transaction.
Benjamin: Commercial banks don't deal directly with the Fed, but they can and do use primary dealers as a conduit for transactions with the Fed. Primary dealers act on behalf of commercial banks. And of course commercial banks must hold bank reserves. How else would they get reserves if not via the primary dealers acting as agents?
I don't know.
No, he is on second!
Yes, in the old, old days, commercial banks had to keep reserves at some fraction (required by law) of total assets and liabilities. A reserve is a money a commercial bank deposits at the Fed (or cash it keeps in its vault/ So a commercial bank always could take some portion of its ordinary deposits, and deposit that portion at the Fed, and get a reserve. A commercial bank does not necessarily deed to sell a Treasury bond to the a primary dealers to get a reserve.
But of course, even in the early days of QE the commercial banks exceeded this legal requirement for reserves, and have ever since, by a country mile. US commercial banks are way, way over-reserved.
I still don't know why, if the world's investors are hungering for safe and liquid assets, then why would central banks be buying safe and liquid assets and pulling them off the market?
Okay, so back in the Great Recession the Fed was worried the banks would lend out too much money (even though property values were plummeting) if the commercial banks had a lot of reserves. So why not make QE smaller?? Why make QE so big, and than also pay interest on excess reserves?
This reminds me of the guy who puts six teaspoons of sugar in his tea and then begins drinking it. His wife asks, "After all that, you are not going to stir your cup of tea?" And he replies, "Oh no, that would make it too sweet."
What?
No, "What is on third!"
Thanks Scott for another great post.
No one seems to have noticed that Trump has made Powell his “bitch” (pardon my French). I am not certain how much freedom of action Powell has left. Ultimately Powell did what Trump had asked earlier (“Stop raising rates or I might Fire you”). Powell might have been “Data Driven” or just folding to the pressure. Who knows? Does it even matter? Powell received some serious public bruising by Trump. Trump made it abundantly clear that he is the boss and can fire Powell at his discretion and all this was very public.
If someone is about to order a beer and a pepperoni pizza and you yell at that person “hey dude! order a pepperoni pizza and a beer or you might fire you”, to many onlookers that person will look like “your bitch”.
I believe this an additional parameter to track now: The Fed lack of independence or perceived lack of independence.
The recent names put forward for new Fed members (the pizza guy and the bad journalist) is another strong indicator that Trump would indeed like to have the Fed at his feet.
Thoughts?
Did DT tell Powell what to do or did the markets? Stocks fell 20% in 2 mos and were looking petty ominous there for awhile. In the meantime, inflation data was mild. I have a hard time believing the markets would rally IF they perceived a FED that was a sycophant to the POTUS.
GAIL slumps 3% after emerging as highest bidder for IL&FS wind assets.
equitytips
I'm familiar with the Laffer curve. I understand an efficient economy creates winners and losers; that even those on the losing end are still better off than ever in history; that government intervention has unintended consequences that can make things worse. Yada, yada. To speak of all tax cuts, at any level, as undeniably good is religion not good governance. And to dismiss the excesses of capitalism that is rent seeking is not good governance. Anyone think the derided government intervention isn't a wheel for rent seeking in finance, energy and healthcare? I don't see clamoring here to unwind those unexpected and perverse results. Finally is not good politics to dismiss the concern of voters. Not much different than MAGA bumper stickers.
Re Fed independence: Let's stipulate that Powell softened his stance because of what the market was telling him and because of criticism from Trump and other important voices. Did he lose the confidence of the market, or did he act correctly? To judge from the weakness in gold, the strength of the dollar, stable inflation expectations, and the rising stock market, he acted correctly. The dollar is an all-important measure of the market's confidence in the US economy and it has rallied in line with the stock market. Inflation expectations are still anchored at just under 2%. This all says that the Fed is doing a good job and has not lost the confidence of the market.
Conceptually I agree with demand for money concept you describe. But the economy today is so much more than what is captured in GDP (I am not thinking of the black ec). You cannot relate M2 with nominal GDP without taking these “cash magnets” into account. The main component missing is the financial market which has grown all over during the last decade and as such requires more cash. And today financial markets all together are a big holder of cash. So when you measure M2/GDP it does not capture the growth of the cash allocated to investments, financial accounts, hedged accounts and alike… So it gives the impression that M2/GDP is growing much faster than it actually is. It also leads to the false conclusion that M2 growth above nominal GDP is bad for financial assets… But as you state in the beginning ‘inflation is a monetary…,’ and man we have seen some cool asset inflation during the period you describe as a period with high demand for money …
If you are right that money demand will decline growing forward it will not be good for assets per se. Velocity will tick up, as will rates, but it will also on the margin drain money from the financial market. Markets can go up if real rates are kept low and as you say the dynamic of stronger confidence and growth spiral, but less money in relation to “things” real, financial or whatever is indeed deflationary…
Cheers!
Re: "Trump would indeed like to have the Fed at his feet."
Bawhahahahaw and that would result in what, greater chaos and a global money crisis? One has to keep all this political noise and stupidity in perspective and then question why the media isn't able to focus on factual information -- e.g., the trump stock market is filled with hype and wonderment, but in reality, his 3 year performance is astonishing:
Dow 3 yr performance: -0.22261%
S&P500 3 tyr performance -0.21918%
Not exactly rocket science here, i.e., idiotic policy and polarized madness is not exactly Making America Great, but I'm sure that kind of result in 3 years is more than enough to get flags waving and hats tossed. The stock market is exploding, never been better and earnings have never been better in the history of America, unemployment is a distant memory and everyone is doing so much better -- if trump gets total control of The Fed, just imagine how great this will be!!!!
Need a FRED chart:
https://fred.stlouisfed.org/graph/?g=nJ4k
Brave Chicken might need to double-check his stock market performance numbers. I show the SP500 up 14.15% PER YEAR over the last three years.
BC, seriously, are you the next marcus? Your comments are just plain ignorant. Do you think we're as stupid as you? Where the hell do you get your erroneous data?
Below is performance for VFINX, a surrogate for SP500 that anyone can buy.
http://performance.morningstar.com/fund/performance-return.action?t=VFINX®ion=usa&culture=en_US
Has it been 10 years already? Well congratulations then, and Thankyou Scott for you have been a precious guide for all that time. Hoping for 10 more :-)
Steve: As an investor the Fed being at the feet of Trump either true or simply perceived as true is a bullish signal to me. It might mean Trump will do all he can to have the Feds be dovish till end of 2020. As an investor short term (I.e. rolling 12 months) I don’t care if the Fed might be at the boot of the president, it is a bullish short term indicator, I suspect most investors would perceive this as well. This with many of the points Scott raises is further encouraging my stance of “buy the tips” (I.e. the “Fed put” seems well established ).
From what I heard the said “Independence of the Fed” which was put in place decades ago, to bring stability and confidence is a topic for another forum ( politics, philosophy, history ... etc...).
Scott: I agree the Fed made the right move. I remember being in disbelieve when the Fed telegraphed 4? Rate hikes for 2019 in 2018?. Regardless that stance which proved to be incorrect did serious damage to many REITs, munis and other dividend paying type investments for many many months, It was extremely painful for a prolonged amount of time.
BC: I do not mix my politics with my investment decisions. For the practical reason that my political opinion do not pay my bills, my investments decisions do. But I do value your posts as another interesting option/reality about the market on top of their entertainment value ;-)
Peace!
3.2% GDP growth in first quarter. WOW! This should put to bed all the naysayers. It's just damn HARD to call tops. That said, you have to give credit where credit is due and Scott has been a persistent bull on the economy. Optimism rules!
Looks like economy will be OK through 2020 election so the nation's choice will be more of the same or a hard turn towards the left and socialism. You would THINK this is a no brainer but I have learned that what appears obvious-isn't.
Scott
you said "Going forward, however, I suspect that money demand will resume its decline, since the economic and financial fundamentals remain healthy. If this trend continues, it has profound implications for future economic growth and the conduct of monetary policy."
do you know if anyone at the fed tracks the relationship between m2 and gdp in the way you do and discusses its implications as you suggest above?
"and almost certainly result in higher-than-currently-expected interest rates and higher equity prices."
I thought higher than expected interest rates leads to lower equity prices. Is it a mistype ?
Alex, re higher than expected interest rates: Rising interest rates do not always result in lower equity prices. Especially when interest rates rise in response to a strengthening economy.
Christian, re whether Fed watches M2/GDP: In the first paragraph of this post I noted that you almost never hear the Fed talking about this. But I'm confident this is one of the indicators that the Fed staff track. Regardless, I think this is a highly neglected but very important monetary variable.
Post a Comment