Showing posts sorted by relevance for query Phillips Curve. Sort by date Show all posts

Friday, January 14, 2011

Thoughts on the Phillips Curve


The Phillips Curve theory of inflation says that inflation is a by-product of strong growth. When an economy "overheats" and things are humming along at or close to "capacity," then supply can't keep up with additional demand and producers start raising their prices. Conversely, when the economy goes into a slump and a lot of economic "slack" develops, then everyone has spare capacity, there's lots of price competition, supply exceeds demand, and prices tend to fall. It's all very intuitive, but from a monetarist's perspective, its dead wrong.

It's true that if the supply of apples exceeds the demand for apples, then the price of apples is very likely to fall. But that's a statement about the relationship between the supply of and the demand for apples; it doesn't say anything about the relationship between the market for apples and the amount of money in the economy. Inflation is a condition wherein the supply of money exceeds the market's demand for money, so an excess of money tends to drive all prices higher. Imagine if the amount of dollars in circulation increased by 100% overnight: the price of just about everything in the economy would quickly start rising, and in the end, the price level would end up rising by 100% or so. Even if there were more apples on the market than people wanted, the price of apples would rise if the money supply doubled. I've lived in hyperinflationary times (the late 1970s in Argentina), and I know that prices can rise even if the economy is in a deep recession.

The Phillips Curve theory got a big boost in the 1970s, because the relationship between inflation and capacity utilization (see the chart above) was very tight. There was a reliable, 17-month lag between changes in capacity utilization and the inflation rate. That lag reflected the fact that it takes time for the economy to adjust to changes in underlying monetary conditions.

But then the relationship stopped working, starting in 1982. Capacity utilization rose through 2000, but inflation fell. Since then there has been a modest correlation between the two, but nothing like what we saw in the 1970s. My explanation for why the Phillips Curve worked in the 1970s is that the Fed was following a very reactive strategy: tightening after inflation rose, then easing after inflation fell. They were always adjusting to the realities of the economy after the fact; easing for too long, and then abruptly tightening after inflation was rising and entrenched.

But in the 1980s the Fed started pursuing a very tough line against inflation, proactively tightening even before inflation rose (e.g., the late 1990s). In 1998 and 1999 I started worrying that they had tightened way too much, and that deflation was a serious risk. By 2002 deflation was indeed a major concern for the Fed, and so from about 2003 on, the Fed became reactive again, easing in response to the fear of deflation, even as there were many signs that policy was too easy (e.g., rising commodity, gold, and housing prices), and so the correlation between capacity utilization and inflation has increased somewhat.

Still, the huge swings in capacity utilization and inflation in recent years has been nothing compared to the 1970s. But it remains the case that the Fed is once again behaving in a reactive, rather than proactive manner. The FOMC assigns much more importance to the relatively low rate of capacity utilization and the amount of economic "slack" there appears to be today, than to the impressive and ongoing rally in commodity prices and gold prices, or to the historically weak level of the dollar. (And recall that it was the collapse of the dollar in the 1970s that really got inflation going.) So it's reasonable to think that the recent surge in capacity utilization ought to be followed by at least a mild uptick in inflation.

Given the 17-month lag between capacity and inflation that played out so well in the 1970s, we may well have seen the low in the CPI for the next several years. And that is exactly what the Fed wants to see—higher inflation. Never doubt the Fed's ability to get what it wants.

Friday, September 18, 2009

Why the bond market is so complacent

This issue—why T-bond yields are so low with gold over $1000 and the dollar falling and commodities rising—seems to be a hot topic, so I thought it worthwhile to repeat and clarify my views. I had a post on the subject last week, but here is another shot at making things more concise:


From a supply-side perspective, gold at $1000/oz. is clearly indicating rising inflation pressures. So is the rise in most commodity prices, and the weakness of the dollar. All suggest the Fed is oversupplying dollars to the world and that will eventually show up as higher inflation.

Meanwhile, equities are rising, suggesting the economy is recovering.

Why is the bond market so complacent, with 10-year Treasury yields at 3.5%, in the face of these facts?

Answers:
1) The bond market has never been very smart about inflation, and neither has the Fed. Everyone underestimated inflation throughout most of the 1970s, and everyone overestimated inflation throughout the 1980s and 1990s. 

2) All the internals of the bond market are consistent with the view that inflation is not a problem. TIPS spreads today say inflation will be 2-2.5% for the foreseeable future. Short-term rates say the Fed will keep rates at close to zero for a long time. 10-yr yields are very low from an historical perspective, consistent with the economy remaining weak and inflation remaining low.

3) The widespread belief in the Phillips Curve theory of inflation (which says that economic weakness leads to falling prices) explains why the bond market and the Fed are complacent: the economy is perceived to be so weak that inflation is almost impossible. 

4) Although stocks are way up and credit spreads are way down, that is not necessarily an indication of a strong economy or a recovery. Credit spreads are still wider today than at the peak of the 2002 credit wipeout. Equity prices have only recovered to levels first seen over 10 years ago, despite the fact that corporate profits (according to the NIPA data) are much higher. So credit spreads and equity prices are consistent with a view that the economy is going to be very weak and a double-dip recession is a real threat. The improvement in spreads and equity prices is due mostly to the fact that the economy appears to have avoided a catastrophic depression/deflation.

5) The 2-10 spread is about as wide as it gets. That shows the bond market is not completely stupid, since lots of Fed tightening is priced in over the next 10 years. But with the Fed insisting that they will keep rates at zero for a very long time, the curve is about as steep as it can get for now.

6) You don't need to rely on Fed purchases of Treasuries and MBS to account for the apparent complacency in the bond market. (In other words, Fed purchases have not kept interest rates artificially low by any meaningful amount.) All of the observations above seem internally consistent. There is no sign of mispricing in the bond market. MBS spreads are perfectly average. Credit spreads are still very wide, suggesting a very weak economy. A very weak economy supports the Phillips Curve belief that inflation is almost impossible, supporting the low level of bond yields.

7) So the Fed is really the key. If the Fed is not concerned about inflation (and they aren't because of the Phillips Curve), then the bond market isn't.

But that doesn't make the bond market right.

Thursday, June 30, 2011

Inflation expectations are heating up (cont.)


This chart compares my calculation of the 5-yr, 5-yr forward inflation expectations embedded in the pricing of Treasuries and TIPS (i.e., the market's expectation of what the 5-yr forward average rate of CPI inflation will be five years in the future) with the actual, year-over-year rate of inflation according to the CPI. By this measure, inflation expectations were only briefly higher than they are today in August 1997. (Note that forward inflation expectations have naturally been much less volatile than actual inflation, since the forward measure is based on what the market expects inflation to average over a 5-yr period.)

While it's clear that inflation expectations have been heating up considerably in the past few years (from almost zero at the end of 2008 to now almost 3%), it's also true that inflation expectations might still be considered to be "anchored" in the sense that they are not outside the range of what actual inflation has been over the past few decades.

So far, the market data support both those who worry that inflation is heating up, and those who believe that inflation is still firmly under control. Thus, reasonable men can continue to disagree on this subject.

As one of those who worries that inflation is likely to continue to heat up, and potentially sustain a higher level than what we have seen in recent decades, I cite the evidence of a very weak dollar, very strong gold and commodity prices, a very steep yield curve, and a super-abundance of bank reserves which have the potential to create a significant expansion in the money supply. Those who are not worried about inflation cite the economy's weak growth and large output gap (which according to Phillips Curve theory creates significant deflationary pressures), the relatively subdued 6% growth in the M2 money supply, and the significant decline in real estate prices.

I would add that on the margin, the evidence lends more support to those who worry than to those who don't. Both actual and expected inflation have been rising this year, much as the market-based evidence (e.g., the dollar, gold, commodities, yield curve) has been predicting, and contrary to what the Phillips Curve theory of inflation has been predicting.

Thursday, October 15, 2009

The deflation dog that didn't bark (3)

After the collapse in commodity prices late last year led to a sharp decline in headline measures of inflation (e.g., the CPI index fell 3.2% in the fourth quarter of last year), one of the more significant things to happen on the inflation front this year is the failure of deflation to appear. I've commented on this several times in the past. This is quite important because the prevailing/most popular theory of inflation is an offshoot of the Phillips Curve theory of inflation. This theory says that inflation declines when the economy weakens—when the economy is operating at a level that is below its potential, which means there are a lot of idle resources in the economy. Since the economy has been operating at a level significantly below its full potential (perhaps 7% below) for the entire year, the Phillips Curve theory of inflation would have predicted the emergence of at least some degree of deflation by now. But that hasn't happened, and that is the dog that didn't bark.

The Fed has been mightily concerned about the deflation threat all year for just this very reason. That is why they have been so easy, and plan to remain very accommodative for quite some time, since it will likely take many months or even years before the economy fully recovers.

Monetarists and supply-siders, on the other hand, prefer to see inflation as a monetary phenomenon. Supply-siders in particular like to watch market-based indicators of how easy or how tight monetary policy is, and to use these as a guide to what inflation is likely to do. For most of this year, these indicators have been suggesting that inflation pressures are rising, not falling: the dollar has been very weak of late, commodity prices have been rising almost across the board, the yield curve is very steep, gold has risen to a new all-time high above $1000/oz., and interest rates are very low relative to measured inflation.


For the first nine months of this year, the CPI has risen at a 2.7% annualized rate, which is slightly higher than its average over the past 5 and 10 years. The core CPI (ex food and energy) is up at a 2.0% rate over this same period. Neither index shows any signs of significant slowing. The deflation threat the Fed has feared has so far failed to materialize, and inflation instead has continued its trend of recent years. Since monetary policy typically acts with significant lags, the easy money of this year is likely to translate into a quickening in the pace of inflation next year.

Thursday, July 9, 2009

Capacity utilization and inflation


As one who believes that inflation is a monetary phenomenon, I have argued that the Fed's model of how inflation works, which is based on the same principles as the Phillips Curve theory of inflation, is flawed. The Phillips Curve theory posits an inverse relationship between unemployment rates and inflation—in order to reduce inflation an economy needs to accept higher unemployment, and vice versa. The Fed's model (which enjoys broad support in the financial market) assumes that weak economic growth leads to idle resources (e.g., extra capacity, higher unemployment), and those idle resources put downward pressure on prices because workers and producers have to lower their price if they want to stay in business. The corollary to this observation is that strong growth results in fewer idle resources, and so workers and producers can demand higher prices because resources become scarcer.

In defense of those models, many observe that inflation typically falls during and after recessions, and typically rises in advance of recessions; recessions create lots of idle resources, and that is what pushes prices down. One monetarist argument against this observation is that recessions are typically caused by a tightening of monetary policy, so it is only natural that inflation should subsequently fall, while economic booms are typically associated with relatively easy monetary policy, which then allows inflation to rise. Monetarists therefore say that the Fed and the Phillips Curvers are confusing correlation (declining inflation and economic weakness/low capacity utilization) with causation (declining inflation is not caused by increased idle resources, but rather by tight money).

As this chart shows, there was a very strong correlation between capacity utilization and inflation from the early 1970s through the early 1980s. (Note that the red line, capacity utilization, is shifted 17 months to the right, so the fact that the two lines move tightly together suggests that the level of capacity utilization predicts inflation by 17 months. Note also that I am using core inflation, to eliminate the impact of dramatic swings in energy prices.) This correlation breaks down almost completely, however, starting in the mid-1980s. Why? My answer is that it's due to the Fed's zeal in combating inflation. The Fed was very slow to react to signs of inflation in the 197os, always tightening too little and too late. The Fed became more proactive in the 1980s and thus was much quicker to tighten in response to a stronger economy. Indeed, the Fed became aggressively tight in the latter half of the 1990s, fearing that the economy was so strong that it was "overheating." As a result, inflation fell throughout the 90s even though economic growth was accelerating and capacity utilization was very high.

The positive correlation between capacity utilization and inflation began to return, however, in the 2000s. Why? Because the Fed reverted to being reactive, much as they were in the 1970s. As a result of being too tight in the late 1990s, deflationary pressures surfaced in the early 2000s that were then met by aggressive easing. The Fed was then very slow to tighten (2003-2005), even though inflation was rising, and now they are in panicked easing mode because the economy is perceived to be extremely weak and thus deflation risk is assumed to be very real.

As a counterpart to my interpretation of events, I suggest you have a look at a similar post on EconompicData which has a chart that paints a very different picture than my chart. He argues that the change in capacity utilization has always been a good predictor (by 6 months) of inflation. I'm not all that impressed by the fit of the two lines on his chart (sometimes they move together, and sometimes they don't), and I don't think there is a logical reason to expect a strong fit in the first place.

Here's why: Idle resources and high unemployment may indeed depress the prices of some things, and may cause some workers to accept lower wages. But inflation is a condition in which all prices rise, not just some. So whatever reduction in price pressures we see as a result of rising unemployment and falling capacity utilization are not necessarily going to result in all prices falling. Sometimes a decline in capacity utilization will result in falling inflation, but not always. What's really driving inflation is monetary policy, as I've argued above.

The important thing to focus on today is that while the level of economic activity overall has fallen rather significantly from where it was a year ago, the amount of money circulating in the economy has risen significantly. Money is now abundant, whereas goods and services are relatively scarce. When the public's demand for money declines—something I think may already be underway—then we will have a surplus of money and a reduced supply of goods and services, and that is the classic recipe for rising inflation.

The proof will of course be in the pudding. If core inflation doesn't decline significantly in the next 17 months, then the Fed's theory of inflation will be left with very little in the way of empirical support, and it is already skating on thin ice.

Wednesday, May 13, 2009

Budget update -- awful (2)

A clarification to my post on this subject yesterday:

My comment about the "sometimes-circular logic" of the bond market was not an endorsement of the way the bond market thinks. In earlier posts I've made it clear that I think the bond market is underestimating the risk of higher inflation. One reason for that is that both the bond market and the Fed believe that inflation is largely a function of the strength or weakness of the economy. Call it the Phillips Curve theory of inflation.

As a supply-sider and as a monetarist, I believe that inflation is a monetary phenomenon. I think low inflation is conducive to stronger growth, whereas the Phillips Curvers believe that stronger growth is conducive to higher inflation.

The belief in the argument that growth causes inflation is based on the observation that inflation tends to decline in the wake of a recession. Correlation is not causation, however. Every one of the post-war recessions that we've had have been the result of a significant tightening of monetary policy. (See my posts on the real Fed funds rate and the slope of the yield curve.) So the real cause of declining inflation has always been tight money, not weak growth.

I've been pointing out for months now that despite the economy having hit a major air pocket, there has been no noticeable decline in core inflation. This contradicts the expectations of the Phillips Curvers, and supports the logic of the monetarists. Furthermore, collapsing energy prices have been the major factor depressing inflation to date, and now energy prices are rising again.

As for taxes, the market is correct to assume that higher taxes to fund Obama's expansion of government will tend to weaken the economy. But that doesn't mean that inflation is going to be low forever, as the bond market currently assumes. The inflation threat is independent of the course of taxes. Of course, it's possible that the Fed could try to soften the blow of higher taxes by keeping monetary policy accommodative, but that would only increase the eventual inflation problem.

Finally, I've mentioned before that I don't think higher Treasury yields are necessarily a threat to the economy. Higher Treasury yields will be a good sign that the economy is improving. The economy has thrived for years during periods of rising interest rates. Treasury yields are so low now that they could rise hugely before they posed a threat to the economy. We would need to see a monumental increase in the real Fed funds rate (which is currently negative) and a major flattening of the yield curve (which is now very positively-sloped) before higher interest rates would pose a threat to growth.

Saturday, August 15, 2009

Inflation or deflation?


July CPI data came out yesterday, and it was a little below expectations. Year over year, the CPI fell 2%, while overall prices held steady in July and core prices (excluding food and energy) rose a mere 0.1%. That's pretty tame, on the surface, and a source of concern to all those who have been worrying about deflation.

Most of the decline in the CPI over the past year has been due to the collapse in energy prices. That's just about run its course, however, since oil prices have doubled from their lows of last December and have been flat since the beginning of June. In the past three weeks, in fact, gasoline prices at the pump have risen 8%, which means we should see energy adding to the CPI in August.

The volatility of oil prices has been of an extreme nature in recent years, so there is plenty of justification for excluding energy and focusing on core prices instead. As the chart shows, the Core CPI is up 1.6% in the past year, and the year over year pace of price gains has been slowing. But that is deceptive, which is why I've included the 6-mo. annualized change in the Core CPI, which is now 2.1%. And even if you look at the whole CPI, it is up at a 2.4% pace year to date, and up at a 3.4% pace in the past three months. So while inflation was definitely low late last year, is not really negative or moderating now at all, and it's probably in the neighborhood of 2% or so.

That would be fine by most people, even the Fed. Except that the Fed's model of inflation says it should be at least zero or negative by now, given the huge "output gap" that the economy is currently experiencing. Conventional wisdom says that when the economy is as weak as it is now, everyone is under pressure to cut prices, and that leads to the dreaded deflation, of the sort that has plagued Japan for decades. And, as the thinking goes, deflation is very bad for economy, as we saw in the Great Depression, because it causes consumers to stuff money under their mattresses instead of spending it.

My good friend and mentor Art Laffer recently wrote a paper that debunks this notion pretty thoroughly. He points out that in a recession it is of course quite normal for businesses to face great pressure to cut costs. Cutting prices helps them become more competitive, and that is the key to survival in an economic downturn. But is cutting prices at the company level equivalent to an economy-wide deflation? No. To argue that what occurs at the company level is also what occurs at the economy level is to fall for the fallacy of composition.

When a businessperson talks about lowering prices because demand is weak, they’re not talking about dollar prices so much as they are talking about lowering the prices of their products to attract business away from other producers. To attract business away from other companies, the businessperson lowers their product prices relative to the prices of other producers’ products, thus making their goods more competitive in a price sensitive marketplace.

For a business, prices are relative prices, while for an economy, prices are dollar prices. Therefore, it only makes sense that on an economy-wide scale, the money (dollar) price of a representative good will reflect the relative scarcity of money versus goods. The scarcer the money, the lower the price of goods measured in money; the more plentiful money, the higher the money price of goods.

So when we look at inflation from a macro perspective, the price level is determined by whether or not money is scarce relative to goods and services, not by whether businesses have an incentive to cut their prices to gain market share. If there is an excess of money relative to the supply of goods and services (which become intensive during periods of recession), prices in general will tend to rise. The situation in which we find ourselves today is one of a plentiful supply of money on the part of the Fed, but a reduced volume of goods and services coming from businesses. To date, the extra money has been mostly absorbed (but not entirely, which is why inflation remains positive) by consumers and businesses that want to increase their money balances, but with time this extra demand for money will fade and money will become abundant relative to goods and services unless the Fed takes steps to reduce the supply of money. This combination of reduced output and increased money supply can lead to higher inflation regardless of how weak the economy is, and regardless of the number of businesses that cut prices in order to boost their competitiveness.

And already we see some signs that the supply of money exceeds the demand for it. The value of the dollar relative to other currencies is depressed and falling; the value of the dollar relative to gold is depressed and falling; the prices of sensitive assets such as commodities are rising (see previous post); the yield curve is unusually steep, suggesting that bond market knows that monetary policy is easy and will have to be tightened in the future; and TIPS breakeven spreads are rising. All of these market-driven prices are pointing to a relative excess of money that could become problematic. As confidence in the future improves, as it has been doing in recent months, then the demand for money will decline. If the Fed does not take offsetting actions to reduce the supply of money, then money will become overly abundant and the general price level should start to rise more rapidly.

Since the Fed keeps insisting that a weak economy will keep inflationary pressures very low, and uses that rationale to maintain its ultra-accommodative monetary stance, we can only infer that they don't understand the monetary nature of inflation. Inflation is not a by-product of the strength of the economy, as the Phillips Curve suggests (see my discussions of the Phillips Curve here), but in a fiat monetary system such as we have today, inflation is rather a by-product of the interaction between the supply of and the demand for money. If the Fed doesn't understand this, then that signficantly raises the risk that inflation will rise in coming years rather than staying very low or turning negative.

Those who worry about deflation when they see businesses cutting prices are therefore missing the forest for the trees.

Friday, October 29, 2010

One more sign that deflation is history


The GDP deflator is the broadest measure of inflation, and with the release today of Q3 GDP statistics, we see that the deflator has been rising at just over a 2% annualized rate for the past two quarters. The deflator dipped into deflationary territory in Q4/08 (-1.2%) and again in Q4/09 (just barely, -0.3%), but it's been positive for the past three quarters. If we take recent Fed pronouncements at face value (i.e., inflation is unacceptable if it's less than 2%), then a 2% pace for the GDP deflator is close enough to perfection for government work. The time for stimulus has come and gone.

It's also very important to note that inflation has turned positive despite the fact that the economy remains far below its "full employment" level, with tons of "idle capacity." According to Phillips Curve dogma, which permeates Fed thinking, this is not supposed to happen. With the economy suffering from so much "slack," inflation pressures should be virtually nonexistent or most likely negative. This is the thinking that has propelled the Fed to the cusp of QE2: they feel they have to pump up demand or face some serious deflation. Well, so far it's not working out that way. That's one more reason why QE2 is unnecessary—the Phillips Curve theory does not adequately explain how inflation works.

Tuesday, May 18, 2010

Inflation is still alive and well


The Producer Price Index of finished goods in April fell 0.1%, but only after rising at a 7.3% annualized rate in the past six months, and 5.4% in the past year. Excluding food and energy prices, the core PPI has been rising at a fairly steady 1% annual pace since early last year. So food and energy prices have been the major sources of inflation for the past year, but that doesn't mean inflation is dead.

If monetary policy were being run with the objective of keeping overall prices steady, then a significant rise in the price of one good or service would necessarily result in a significant decline in the prices of some other goods or services. With the above chart we see instead that big increases in food and energy prices did not prevent all other prices from rising. To the contrary: I note that prices of intermediate goods ex-food and energy have risen at an 8% annualized pace over the past six months, and 5.6% over the past year, while crude goods prices ex-food and energy are up at a whopping 48% annualized pace in the past six months, and 50% in the past year. Consequently we can conclude that the Fed is not pursuing a policy designed to deliver price stability.

The fact that inflation is still alive and well despite the huge amount of economic slack that has prevailed for the past 18 months also casts even more doubt than already existed on the still-popular Phillips Curve theory of inflation. Surely, if inflation had anything to do with the unemployment rate (the Phillips Curve posits an inverse relationship between the unemployment rate and the rate of inflation), then we should have seen plenty of evidence of deflation by now. To be sure, there are sectors of the economy that are experiencing price declines, but as the PPI numbers show, the overwhelming majority of prices are rising.

I've been arguing for quite some time that inflation is alive and well, and I think this is a significant issue. That's because the market continues to be very concerned about the risk of deflation; I see this in the relatively low 1.25% breakeven spreads on 2-year TIPS; I see it in the relatively low level of Treasury yields in general (2-yr Treasuries at 0.8%, 5-yr at 2.2%, 10-yr at 3.4%); and in the Fed's continued concern over deflation risk (why else would they insist on keeping short-term rates at close to zero?). If the market and the Fed were to lose their preoccupation with deflation risk, then the outlook for the economy and for corporate profits would brighten considerably, and default risk would decline. This would be undeniably good news for stocks and corporate bonds, and very bad news, of course, for Treasury notes and bonds, and for mortgage-backed securities. Furthermore, I suspect that if the Fed acknowledged that deflation risk were dead, the gold market would get a big case of the willies, because that would mean that super-accommodative monetary policy—the lifeblood of quadruple-digit gold prices—was on its way out. By the same logic, this would be a boon for the dollar, which remains historically weak.

Friday, September 19, 2008

Back to worrying about inflation

Now that the market is much less worried about a financial market implosion that leads to an economic collapse, it's turning its attention back to what I've been worrying about all along: inflation. Standard thinking (inspired by the Phillips Curve) says that if the economy is very weak, inflation will fall. That's why the bond market hasn't been too worried about $900 gold and $100 oil, because the weak economy would presumably take care of the inflation problem that these are symptoms of. This chart shows that normally, bond yields average about 3 percentage points above inflation. Right now bond yields are actually below the level of inflation (which means the market expects inflation to fall). But the Phillips Curve is not the best way to understand inflation. Monetary policy, not economic strength, is the cause of inflation, and the Fed has been pretty easy for a long time. If the economy continues to grow, look for the market to worry more and more about inflation. This relief rally has resulted in higher gold and oil prices, higher interest rates, and a weaker dollar, all signs that inflation is alive and well.

Friday, April 27, 2012

Thoughts on why real growth has been disappointingly slow


According to the government's first estimate of Q1/12 GDP growth, the U.S. economy grew at a 2.2% annualized rate, a bit less than the 2.5% expected. In numbers, that shortfall from expectations works out to about $10-12 billion, and that is essentially a rounding error. The government is going to revise its growth estimate several times in the future, and the final number could be a lot more—or a lot less—than what these charts show. One thing that won't change, however, is the fact that the U.S. economy is growing by much less than it should be, given the degree to which it suffered in the last recession. The top chart above is my attempt to quantify that underperformance, which I'm guessing is 12%, or about $1.8 trillion. That's a lot of income that should have been recovered by now.


This next chart shows that the the economy has been growing at a nominal rate of about 4% for the past seven quarters. Nominal growth has been fairly constant, but real growth has varied significantly over that same period. On balance, the economy has been muddling along, not doing anything very impressively.

Before the current recovery started, I thought the economy would post 3-4% growth, which at the time qualified as a "sub-par" or disappointing growth forecast given the depths of the recession. Instead, the economy has posted 2-3% growth on average (to be exact, real GDP has grown at a 2.4% annualized rate since the middle of 2009). My projection was relatively pessimistic at the time from an historical and theoretical perspective, but it turns out I was a bit too optimistic relative to the ensuing reality. Nevertheless, I have resisted the double-dip recession fears which have arisen a few times in recent years (most recently last Fall), and so far I've been right on that score. I still don't see signs of an impending recession, and I continue to expect sub-par growth. But in the end, whether growth is 2.5% or 3.5% makes little difference, I suspect, since my reading of the market tea leaves (notably the 2% yield on 10-yr Treasuries and the below-average PE ratio of the S&P 500) suggests that the market is not even priced to 2% growth.


The next two charts show inflation as measured by the GDP deflator, the broadest measure of inflation. The first chart shows the year over year growth of the deflator, whereas the second shows the quarterly annualized growth of the deflator. Inflation by this measure has averaged about 1.4% per year over the past three years. That's pretty tame, and about as low as we've seen for quite some time. But it is only slightly below the 2% upper range the Fed is targeting, and there are no signs that deflation is threatening.

Which brings me to the elephant in the room. The fact that we have not experienced any deflation (expect for the Q2/09 quarter, during which the deflator fell at a modest, 0.5% annualized rate), despite the magnitude of the recession and the huge 12% output gap which has prevailed for some time, is really big news. The prevailing theory of inflation (embodied in the Phillips Curve), which the Fed shares, is that it should vanish or turn negative if the economy were to experience a huge output gap for several years, such as we have experienced. Instead, inflation has been about the same in recent years as it has been for the past two decades. This probably should be a testament to the brilliance of Fed Chairman Bernanke, but the Fed's record of keeping inflation low on average has been marred by the relatively high degree of inflation volatility that we have seen in the past decade, as highlighted in the second chart: inflation has varied from a low of -0.5% to a high 4.7%. Given the nasty recession and painfully slow recovery we've been through, it's tempting to forgive the Fed this error, except for the fact that it's unsteady hand on the inflation tiller likely contributed to the 2008 recession.

In any event, the record of recent years is good evidence that the Phillips Curve theory of inflation has not done a good job at all of explaining or predicting the behavior of inflation. It's never made sense to me that inflation should be a function of the strength of the economy, or of the level of unemployment, or the degree to which resource slack exists. Inflation is a monetary phenomenon, pure and simple, and central banks therefore are the primary source of inflation.

As a corollary, while central banks have the ultimate control over our inflation destinies, they have very little ability to create real growth. Good monetary policy can contribute to growth by promoting the stability of a currency and thus bolstering the confidence of investors, but it can't just create growth out of thin air by artificially lowering interest rates or running the printing presses. In the end, real growth only occurs when the resources available to the economy (e.g., capital, labor, raw materials) are put to work in a manner which increases total output.

The federal government is also very limited in its ability to generate real growth, since spending money on more bureaucrats or more transfer payments doesn't do anything to create more output, and more likely results in greater inefficiency and thus less output. Generating more output from scarce resources is where the private sector excels. It's hard for an entrepreneur to figure out get more out of a given amount of resources, and working more hours is hard too. Working hard or harder generally requires giving people an incentive to do so, and the profit motive operating in free markets is what has proven to work best.

So if we're looking for a reason why the economy is 12% smaller than it otherwise should be, we shouldn't be looking at the Fed. I think one obvious source of the shortfall is the huge increase in government spending in recent years, most of which has been in the form of transfer payments. Instead of allowing the private sector to utilize the trillions of dollars the federal government has borrowed to fund this increased spending, the government has effectively just taken the money from the pockets of those who have been productive and put it into the pockets of those who have been unproductive or less productive. That doesn't create growth, it just wastes our scarce resources, because—as Milton Friedman taught us—nobody spends other people's money as wisely as they spend their own money. It's as if the government simply directed all of us to pour some of our hard-earned money down the toilet by buying things we don't need.


Here's another way of appreciating what has happened in recent years. The private sector has been working very hard to increase its efficiency and its output, and that shows up in the record level of corporate profits, both in nominal terms and relative to GDP (see charts above). But instead of allowing or encouraging the private sector to plow those profits back into the economy in the form of new plant and equipment, new jobs, and new technologies, the federal government has effectively borrowed all the corporate profits generated since 2009 and distributed the money to the unemployed, to the poor, to favored "green" industries, to unions, to state and local governments, and to "make-work projects," among other things. There's been a lot of money thrown around, but lots of it has been wasted in the process that could have been put to better use; we simply don't have much to show for the $1.25 trillion of after-tax profits generated per year on average by U.S. businesses since 2009. (I'm referring here to the fact that federal deficits in recent years have been roughly equivalent to after-tax corporate profits—actually a bit higher. So on a "sources and uses of funds" basis, the government has effectively used all corporate profits to fund its spending.)

Monday, September 14, 2009

Market expects an easier Fed, despite signs of recovery


This chart shows the market's expectations for where 3-month Libor will be trading in September 2010. By subtracting 30 bps you get the approximate level of the market's expectations for the Fed funds rate over time; currently the market is expecting the funds rate to be about 1.0% a year from now. What strikes me about this chart is that short-term interest rate expectations have dropped  since the end of last year—the yield on the Sep '10 contract has declined from 1.9% then to 1.3% today—despite all the obvious signs of an economic recovery that have since emerged. This is one more example of the dichotomy that I mentioned in my post last Tuesday. Some things—like T-bond yields and short-term interest rate expectations—seem to be priced to a very dismal economic outlook and/or low inflation, while other things—like copper prices, gold prices, a weaker dollar, and swap spreads—reflect strength and a portent of rising inflation.

What follows is my attempt to explain how this all fits together.

At the end of last year the mood of the market was extremely pessimistic, fearing a combination of depression and deflation that would be more terrible than what happened in the 1930s. Since then, the Fed has taken extremely aggressive steps to eliminate the threat of deflation, with the result that monetary policy is now far easier than anyone could have imagined late last year. In addition, the Fed has taken pains to assure the market that policy will remain accommodative for a long time. Fed governors feel comfortable in projecting an extended period of low short-term interest rates given the degree to which the economy is operating below its capacity; this is the Phillips Curve thinking that I've referred to time and again, which can be summarized like this: as long as the economy has lots of idle capacity, then monetary policy needs to remain very accommodative in order to counteract the risk of deflation. Put another way, with a near-10% unemployment rate, the last thing we need to worry about is inflation. (Note: this is not my view, rather what I think is driving the market and the Fed's view of the current situation.)

Looking back to the end of last year from today's vantage point, we see that on the margin, there has been a huge change in the market's perception of monetary policy. The market has shifted from expecting monetary policy to be so tight as to generate a prolonged bout of deflation, to now expecting policy to be easy enough to allow inflation of 2 – 2.5%. Such a dramatic easing of policy goes a long way to explaining why the dollar is weaker today than it was at year-end, and why gold is stronger: the supply of dollars has increased relative to what the market expected, and so the value of the dollar has dropped. It also helps explain why 10-year Treasury yields are up 135 bps over the same period, and TIPS breakeven inflation rates are up 160 bps.

But why are 10-year Treasury yields still so low from an historical perspective? (They were only lower on a sustained basis during the Depression.) Why isn't the Treasury market pricing in a higher rate of inflation, given the Fed's massive easing of monetary policy? Why is the market still so apparently eager to buy Treasuries, knowing full well that deficits will be on the order of a trillion dollars or so for as far as the eye can see?

A good friend of mine, David Malpass, suggests that the dichotomy (relatively low Treasury yields versus rising equity and commodity prices) reflects a market that is investing for two extremes (a "barbell" trade), trying to protect against inflation and deflation at the same time. Buy Treasuries to protect against deflation, since deflation would mean lower yields, while buying equities and commodities to protect against rising inflation. I'm not sure this is a robust explanation (TIPS spreads should be quite narrow, for example, if deflation fears were motivating Treasury purchases), but it does have some appeal and it squares with the continued relatively high level of implied volatility in both stocks and bonds, because it reflects a great deal of uncertainty about the future.

I think we have to look at the mechanics of the bond market for an answer to these questions, and to the pervasive and strongly-held belief that the U.S. economy will be very weak for a long time.


No matter how hard you look, you can't find any evidence today that the bond market thinks the Fed is going to make an inflationary mistake, or that there is any risk of deflation. The breakeven spread on 10-year TIPS is a benign 1.8%; and the 5-year, 5-year forward inflation rate implied by the TIPS market is about 2.25%. As far as the bond market is concerned, the Fed has addressed the deflationary concerns of late last year without jeopardizing the long-term outlook for inflation.

Furthermore, the market apparently agrees with the Fed that there is no need to raise short-term rates for quite some time, since it will be years before the unemployment rate comes back to levels even approaching full employment (variously estimated to be about 5 or 6%). According to the pricing of fed funds and eurodollar futures, the funds rate is expected to be unchanged for another six months or so, and then to creep up only gradually. 2-year Treasury yields today tell us that the market expects the funds rate to average only 0.9% over the next two years. That means you can finance 10-year Treasuries yielding 3.4% for two years and only pay 0.9%, earning a spread of 2.5% per year on average. That's a compelling investment for the bond market, since the Fed is essentially promising that it won't upset the carry trade applecart by raising rates prematurely; the Fed wants people to borrow and buy things.

As the next two charts show, the slope of the yield curve from 2 to 10 years (which is a good proxy for the appeal of the carry trade) is about as steep now as it has ever been. The steep curve makes for a compelling carry trade. 10-year yields are being held down because 2-year yields are very low. T-bond yields are thus unlikely to rise unless and until the market realizes that the Fed needs to raise short-term rates sooner than currently expected. When that happens is anyone's guess, of course, but I think it is likely to happen sooner rather than later. That better be the case, however, since being short bonds in a steep yield curve environment has a big negative carry cost. Indeed, it costs over 3% per annum to be short the 10-year Treasury right now. Unless you have a strong conviction that the Fed is going to have to surprise people by raising rates sooner than expected, you would be very reluctant to short Treasuries right now. The Fed, in short, holds the key to why T-bond yields are so low today.


I've been pointing out since late last year that forward-looking, market-based indicators of inflation have all been flashing warning signs: rising gold prices, a weaker dollar, rising commodity prices, a steep yield curve, and rising breakeven spreads on TIPS are all signs that inflation risk is picking up, not to mention the extra $1 trillion of bank reserves the Fed has dumped into the banking system. The market has been studiously ignoring these harbingers of rising inflation because the economy has fallen so far below its potential. Yet these same signs are telling us that the Fed's generously low level of interest rates is progressively weakening the demand for money; people are increasingly willing to borrow (and less likely to hold onto existing money balances) and increasingly willing to buy things like other currencies, gold, and commodities. Which is another way of saying that the Fed is oversupplying money to the system, and this will very likely fuel a higher rate of inflation in the future.

The tension that this creates—the market's confidence in a low inflation future versus the warning signs of rising inflationary pressures—can be found, I submit, in the continued, relatively high level of implied volatility in both the bond and stock markets. And that's how I tie everything together in what I hope is a coherent story.

Wednesday, October 19, 2022

Fed's Rx for the economy should be a tincture of time


As I've argued in recent posts, there's plenty of evidence to suggest the Fed has already tightened by enough to bring inflation down: the dollar is super-strong, real yields have risen sharply, the yield curve is inverted, commodity prices are plunging, and the housing market has run into a brick wall. Yet the Fed seems determined to tighten even more. I think they're driving by looking into the rear-view mirror. They're trying to burnish their reputation as an inflation fighter, after having fallen miserably behind the inflation curve in 2020 and 2021. And I think that the long-discredited Phillips Curve (which posits that unemployment must rise if inflation is to fall) still haunts the Fed governors' minds. It's all so unfortunate.

Fortunately, however, a recession is neither imminent nor inevitable. Industrial production and jobs are still growing at decent rates, 2-yr swap spreads are still in normal territory, and real interest rates are not prohibitively high. But the economy could fall into a recession if the Fed doesn't change course (aka "pivot") before too long. There's a precedent for this—in January 2019, when the Fed realized it had become too tight and reversed course—and I don't see why they can't do it again.

Chart #1

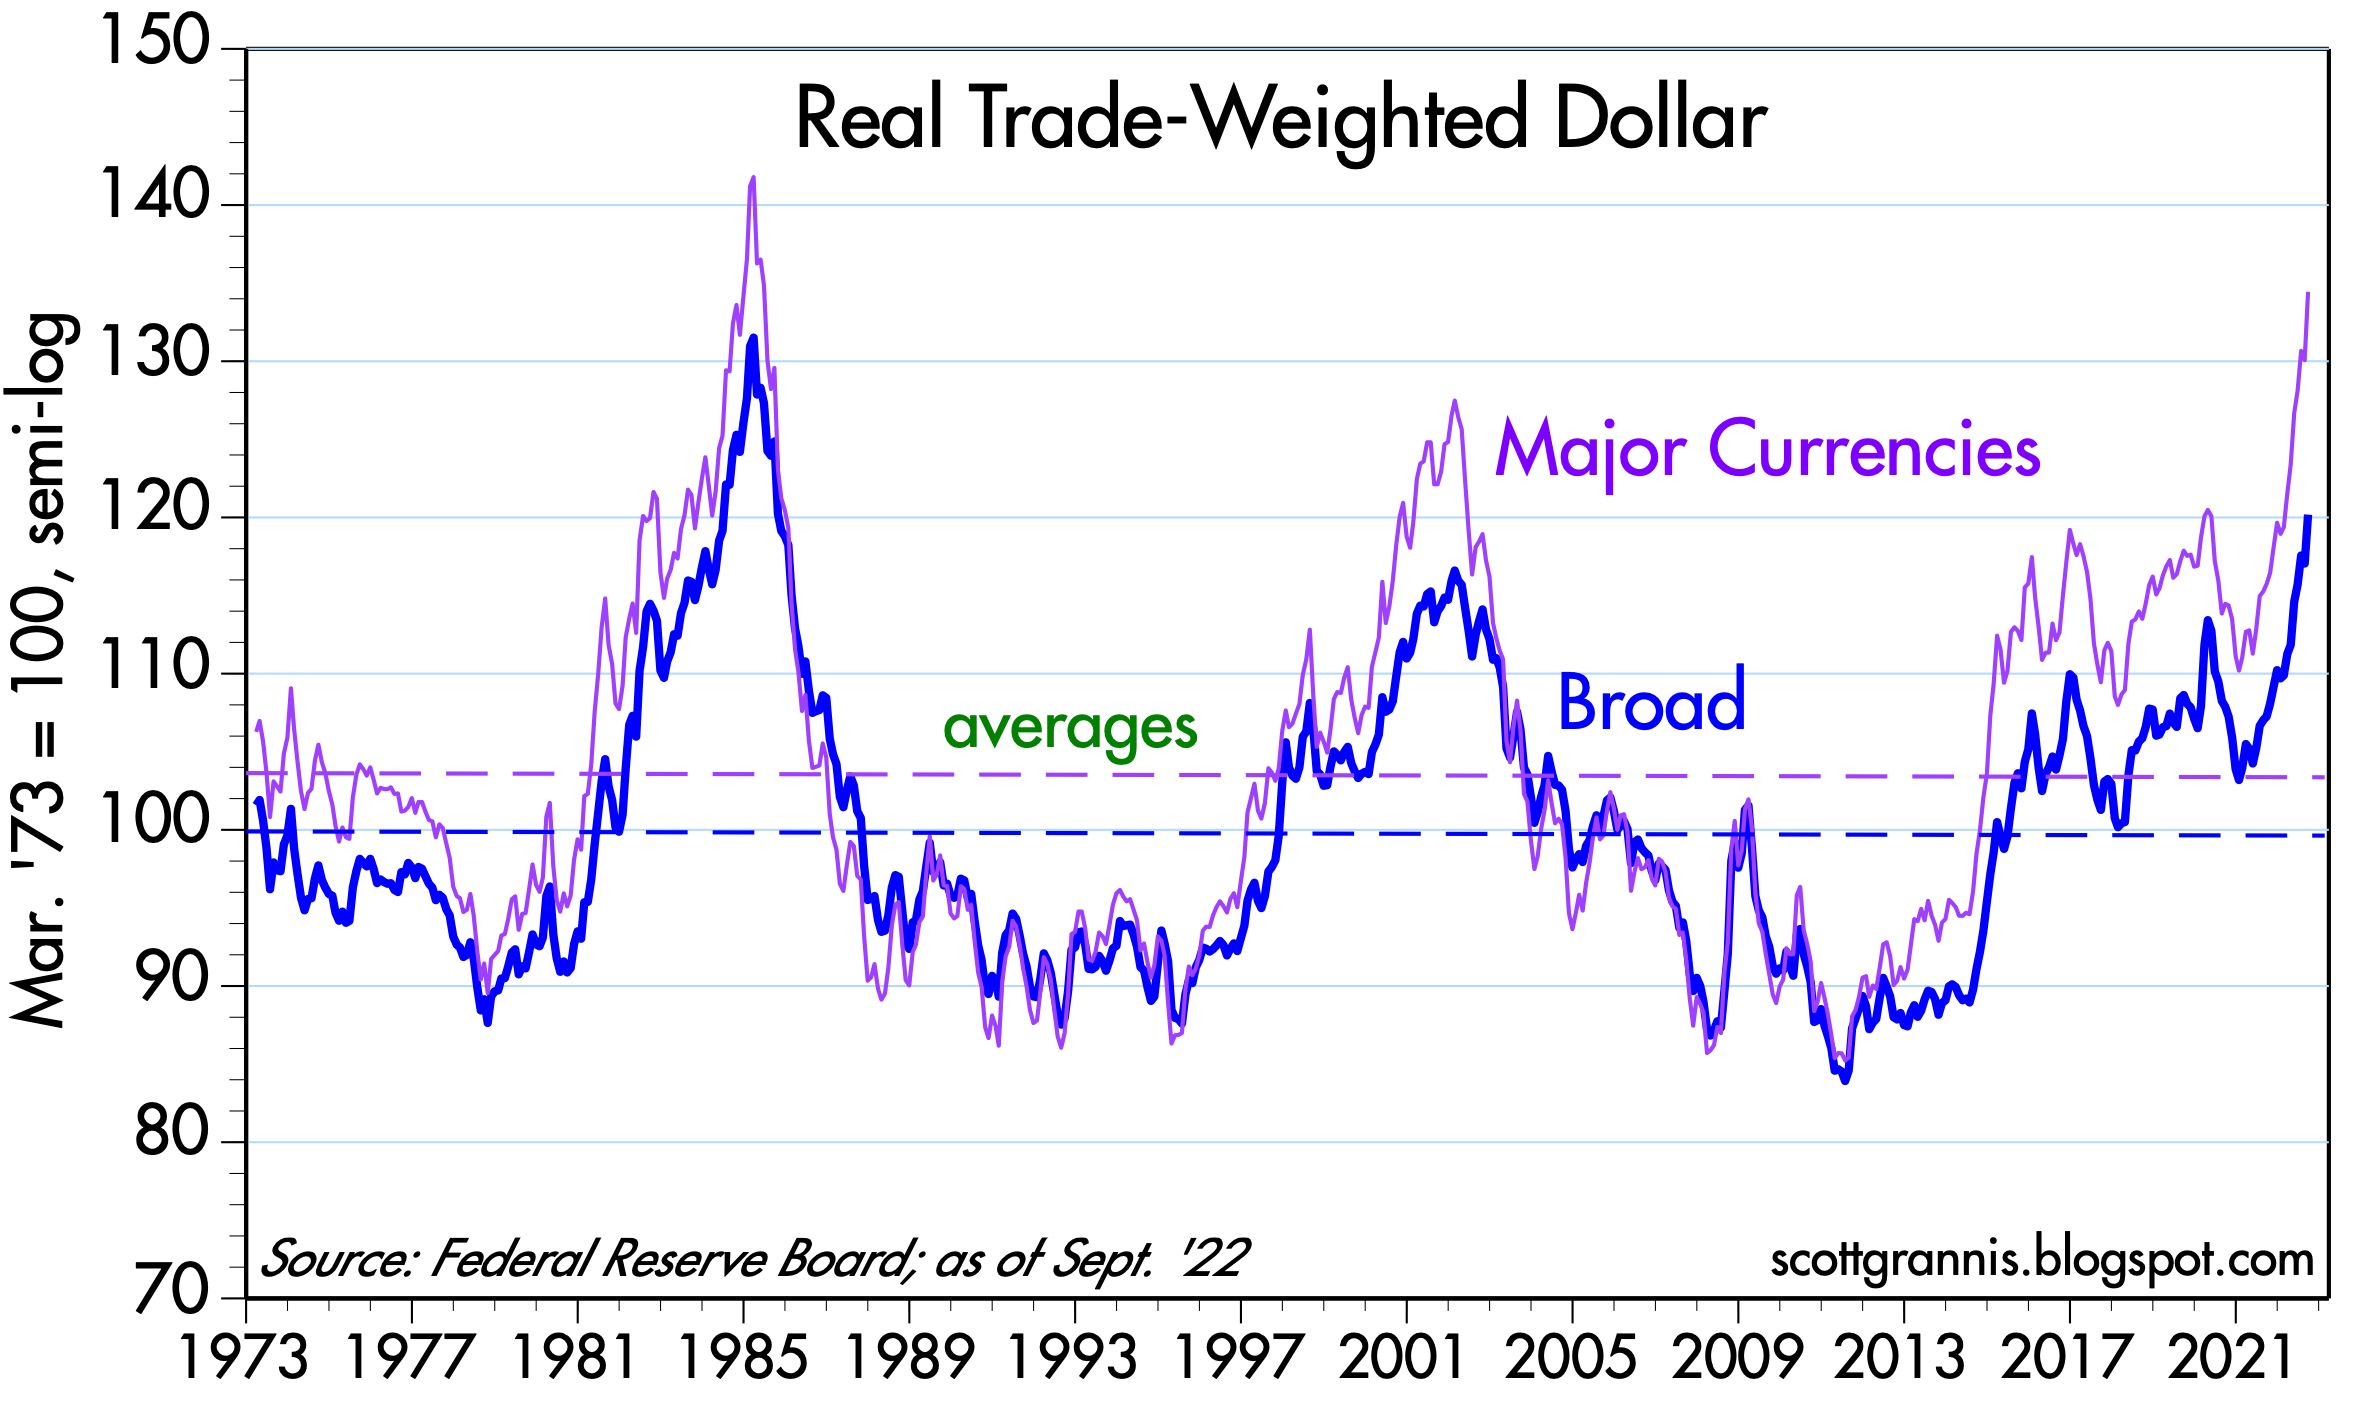
Chart #1 shows two measures of the inflation-adjusted and trade-weighted value of the dollar. By any measure the dollar is very strong. This is fully consistent with US monetary policy being tight and much tighter than that of any other major economy. Demand for dollars is strong, and there is no shortage of reasons for why that is so: geopolitical turmoil in Europe and East Asia would surely suffice. From an economics point of view, it would be highly unusual for a very strong currency to also be experiencing inflation (otherwise known as a loss of purchasing power). Prices all over the world, when translated into dollars, are falling.

Chart #2

Chart #2 compares the inflation-adjusted value of gold (red line) to the inverted value of the dollar (blue line). Big moves in the dollar's value almost always accompany inverse moves in commodity and gold prices. What's striking about today is that gold and commodity prices have not fallen further given the strength of the dollar. Long-time readers will note that this chart, which has appeared many times in recent years, has correctly predicted falling gold prices.

Chart #3

Chart #3 compares the nationwide average rate for 30-yr mortgages (orange line) to an index of new mortgage originations (mortgages taken on to finance the purchase of a new home). Mortgage rates have doubled this year, and new mortgage originations have fallen by half. That's a huge development! In other words, soaring mortgage rates combined with very high prices have dealt a heavy blow to the housing market. This is a perfect example of how higher interest rates can change incentives and also slow the economy. People today are much less willing to borrow (which implies higher money demand) and much less willing to buy (which also implies a demand for cash rather than goods. The sharply increased demand for money is acting directly to neutralize much of the extra M2 money supply that was created a few years ago. And that, in turn, means declining inflation pressures. (Recall that M2 has been flat for the past 9 months or so.)

Chart #4

Chart #4 compares housing starts (blue line) with an index of homebuilders' sentiment. Sentiment has plunged in recent months as homebuilders have seen a sudden slowdown in home purchases. In the past, sentiment has often been a very good predictor of housing starts. We could be on the verge of seeing a big slowdown in residential construction, and that would be a surefire contributor to a recession. Chairman Powell, please take note!

Chart #5

The top portion of Chart #5 compares the average rate on 30-yr mortgages (white line) with the yield on 10-yr Treasuries (orange line). The bottom portion shows the difference between the two, which looks to average about 150 bps in normal times. The spread today, in contrast, is over 300 bps; no wonder the housing market is in trouble. As the bottom chart also suggests, such peaks in spreads is typically short-lived, since they most likely reflect panicked selling and hedging by institutional players. Something is likely to change before too long, and it's likely that mortgage rates and spreads to Treasuries will decline.

Chart #6

Chart #6 compares the value of the dollar (orange line) with the real yield on 5-yr TIPS. As I've noted before, 5-yr real yields on TIPS are equivalent to the market's expectation for what the real Fed funds is going to average over the next 5 years. Real yields have soared by almost 400 bps in just over a year, which is not only unprecedented but also indicative of an extreme tightening of monetary policy. It's sort of like giving a horse tranquilizer to a mildly psychotic patient. Please, Chairman Powell, enough is enough!

Chart #7

Chart #7 compares an index of U.S. industrial production with a similar one in the Eurozone. Without a big decline in industrial production it is very unlikely that the U.S. economy is experiencing a recession. And so far, industrial production continues to grow. The Eurozone economy has been battered by the Ukraine conflict and soaring energy prices, yet industrial production has yet to decline. Both economies have an urge to recover what was lost to the Covid shutdowns.

Chart #8

Chart #8 shows the level of private sector non-farm employment, which continues to grow at a healthy pace. Recessions are famous for throwing people out of work, but we have yet to see any sign of that in the U.S. economy. 

Chart #9

Chart #9 shows the level of 2-yr swap spreads, my favorite indicator and predictor of the health of the U.S. economy and financial markets. Swap spreads are still within a "normal" range, which implies that liquidity is still abundant and the corporate profits and the economy are likely to remain reasonably healthy. As the chart suggests, swap spreads would have to rise appreciably before one might expect to see a recession on the horizon. Note also that swap spreads have tended to decline in advance of recoveries. 

Chart #10

Chart #10 is my favorite recession "dashboard," since it tracks two key indicators of monetary tightness and how they interact to produce recessions. Every recession here was preceded by an inversion of the yield curve (red line) and a significant rise in real short-term interest rates (blue line). As I noted in Chart #6, the market expects the Fed to raise short-term real interest rates (a key measure of Fed tightness) to at least 2% in coming years, but that has yet to happen, and so far the yield curve is only mildly inverted. To be fair, I'd score this chart as tentatively predicting a recession within the next year or so. 

Summing things up, there is little doubt that the Fed has already tightened monetary conditions to a significant degree. Sensitive prices (e.g., the dollar, commodity prices, gold) have turned down meaningfully, which alone would be a decent indicator of lower inflation to come. It would be a real shame if the Fed were to continue on its present tightening course in the belief that only by crippling the economy (e.g., higher unemployment, falling industrial production, and a collapsing housing market) can they hope to get inflation back under control. 

My recommendation would be for Dr. Powell to give the economy a "tincture of time," not higher interest rates.

Wednesday, June 24, 2009

FOMC stuck in the "slack" rut


The Federal Open Market Committee today told us that while they see signs that "the pace of economic contraction is slowing," they anticipate that economic conditions will be so bad for so long as "to warrant exceptionally low levels of the federal funds rate for an extended period." The main reason they cite for this conclusion is that "substantial resource slack is likely to dampen cost pressures."

In other words, they are likely to make the same mistake they made in late 2003, when they telegraphed their intention to keep the funds rate at 1% for an "extended period." From their statement today we can infer that the line on this chart will be somewhere in the range of -1 to -3% for the next few years. And that, in turn, means monetary policy will be about as easy as it's ever been. Easy enough to create at least another bubble or two, the main question being where.

In essence, the Fed is offering the world a free lunch: borrow overnight and buy just about anything that moves—move out the curve and pick up yield, buy real estate, buy stocks of companies that can merely survive, buy commodities. This is the closest thing to a risk-free arbitrage that one can imagine.

If this doesn't result in the banking system putting all those excess reserves that are currently sitting idle at the Fed to work, I don't know what will. Banks themselves now have the ability to engage in almost riskless arbitrage, using their reserves to buy all sorts of things—especially Treasury notes and bonds—that yield more.

As this op-ed in yesterday's WSJ reminded us, the Fed made a similar decision in late 2003 which ended up contributing to the bubble in housing prices, oil prices, and commodity prices. At the time, the economy was turning up, and there were plenty of warning signs that the Fed was too easy: the dollar was down, gold was rising, commodity prices were rising. Instead of tightening, they kept the fed funds rate at extremely low levels, in both real and nominal terms, for about two years. Although the signs of a recovery today aren't as strong as they were in late 2003, the warning signs of too much money are much stronger: the dollar is 10% weaker, gold has more than doubled, commodity prices are up 30%, oil has more than doubled, and the yield curve is steeper.

The rationale for all this ease is "slack," which is a codeword for the Phillips Curve theory of inflation. This theory, which has been discredited by several studies by the Fed's own economists and by others, holds that inflation has little or nothing to do with monetary policy, and everything to do with how strong or weak the economy is. The Fed's role, according to this theory, is to raise and lower rates in order to fine-tune how fast or how slow the economy grows, thus indirectly controlling inflation by first controlling economic growth. Unfortunately, hubris has trumped common sense, since no person or committee is smart enough to know what magic overnight interest rate will produce the desired level of growth. And it is arguable whether the Fed has any ability at all to fine-tune growth with its interest rate too. Plus, no one really knows how to estimate "slack," whatever that is. It's a fool's game, but the Fed just keeps playing it.

The bond market sold off today, ostensibly because the FOMC announcement ruled out any increase in the Fed's planned purchases of T-bonds and mortgage-backed securities. That's a fool's game as well, since the Fed has no ability to influence the level of bond yields. Indeed, the more bonds it purchases, the less likely that bond prices will rise; the market will realize that the Fed is monetizing debt, and that will render Treasury bonds instantly less attractive by increasing future inflation.

So the real message of the FOMC today was not that it won't increase its bond purchases, it's that the FOMC still believes in the wrong theory of inflation. Consequently, it is more likely to make a monetary error. This error could show up as another asset price bubble somewhere, a faster rate of inflation, a weaker dollar, higher interest rates in the future, and/or higher gold and commodity prices. It is not going to be of great help to the economy today, just as Obama's stimulus plans are more depressing than they are stimulative (because of the very real threat of a significant increase in tax burdens). Quantitative easing made sense when the financial markets and the economy were on the ropes. But now with the economy beginning a recovery and the warning signs of too much money growing, easy money is a fool's game. It only fuels speculative activities, while at the same time reducing investment in the U.S. because it undermines the strength of the dollar and by inference reduces the return on U.S. investments.

Despite this nasty combination of bad fiscal and monetary policy, however, I do remain optimistic. I think the economy can still manage to grow, just not as much as it otherwise could. I think the market is still priced to the belief that growth is going to be almost nonexistent or very weak, so even a modest 3% rate of growth (very modest given how much economic growth has fallen in the past year) going forward would be a welcome surprise.

In the meantime, the Fed is sending investors and households several messages: 1) buy that house you were thinking of buying sooner rather than later; 2) get rid of some of the cash you have stockpiled—since it will likely pay a negative real rate of interest—and buy just about anything else instead; 4) for the money that you want to keep in a really safe place, consider TIPS; and 5) avoid lending any of your money to Treasury (i.e., don't buy Treasury notes or bonds).

Full disclosure: I am long equities, long TIPS, long housing, and short T-bonds as of the time of this writing.

Monday, May 3, 2010

One reason inflation remains tame: strong money demand


According to the Personal Consumption Deflator, the Fed's preferred measure of inflation (and a pretty decent one, I might add), inflation with or without food & energy remains within the Fed's target range.

Note, however, that inflation from 2004 through most of 2008 was consistently above target, and I think I know why. This period was preceded by all of the conditions that I have been worrying about for the past year. The Fed adopted a very accommodative monetary policy starting in late 2001, holding short-term interest rates below 2% through late 2004; gold prices rose from $260 in early 2001 to over $400/oz by late 2003; the dollar lost over one-fourth of its value against other major currencies from early 2002 to late 2003; commodity prices rose almost 60% from late 2001 to late 2003; and the yield curve went from being flat in early 2001 to almost as steep as it is now by late 2003. I consider that all of these signs are good leading indicators of rising inflation, and we have seen every one of them repeat over the past year or so: the dollar has fallen, gold has surged, commodity prices have surged, the yield curve has steepened, and the Fed has been holding short rates at almost zero for 18 months.

The one thing that is different this time around (history never repeats itself exactly, of course) is that for most of the past year or so the public's demand for money has been exceptionally strong. We saw the evidence of that in the big decline in velocity that occurred from late 2008 through mid-2009; in the big increase in currency in circulation and in M2 that occurred from late 2008 through March of last year; in the widespread signs of deleveraging in corporate America and among households from late 2008 through today; and in the very weak growth of bank credit.

In short, monetary policy has been exceptionally easy for the past 18 months, but the public's demand for money has been exceptionally strong at the same time. Monetary policy is inflationary only when the supply of money exceeds the demand for it. This is the essence of my rationale for why measured inflation hasn't yet increased, even though my favorite leading indicators of inflation are all pointing up: the Fed hasn't oversupplied money by enough to overcome the disinflationary aftermath of sudden and unexpected shock to confidence, a significant slowdown in economic activity, and the inflation "inertia" of the massive U.S. economy.

I note that rising inflation is now showing up in many Asian countries, and particularly in China. Most of them have effectively outsourced their monetary policy to the Fed by effectively pegging their currencies to the dollar. If U.S. monetary policy is inflationary, then it would makes sense that inflation would show up in smaller and less developed economies long before it showed up in the U.S. economy.

I think it is also worth highlighting the fact that despite the depth and severity of the recent recession, and the huge degree of "slack" or idle resources that have existed for most of the past year or so, there are no signs yet of deflation. The deflation that was predicted by popular (e.g., Phillips Curve-based) models of inflation was a total no-show. Recall that at the end of 2008 the bond market—via the mechanism of TIPS' breakeven spreads—was predicting significant deflation for years to come, yet instead we find that inflation has been running at a 1-2% rate for the past year.

In any event, and as Milton Friedman taught us, the lags between monetary policy and their impact on the economy are long and variable. That measured inflation hasn't risen yet, despite aggressively accommodative monetary policy and the appearance of a host of leading indicators of inflation, is not a reason to cheer. Investors can't wait for the signs of inflation to become obvious, since by then it's too late to react.

Prudence, a focus on the monetary nature of inflation, and a quick glance at the Fed's massively bloated balance sheet (which the Fed admits may take many years to reverse) should be enough to convince investors today to worry much more about inflation than deflation. That in turn should leave one more optimistic, not less, about the future prospects for growth in the U.S. economy (since the appearance of deflation could definitely weaken the economy, aggravate the burden of everyone's debt, and increase default risk), and it should make inflation hedges more attractive, not less. It should also argue against holding cash or cash equivalents.

Full disclosure: I hold no cash or cash equivalents, am long TIPS, long a variety of equities, long high-yield debt, long emerging market debt, and short Treasury bonds (via a 30-yr fixed rate mortgage) at the time of this writing.

Thursday, September 15, 2011

Inflation picks up


The August rise in consumer prices exceeded expectations. The headline CPI rose 0.4%, vs. an expected 0.2%, while the 0.2% rise in the core rate was a tad higher than expected. As the first chart above shows, core inflation over the past six months is running at an annualized rate of 2.7%, while overall inflation is 3.6%. As the second chart shows, the rise in core inflation has been quite pronounced, and apparently owes a lot of its strength to the Fed's second round of Quantitative Easing which began almost a year ago.


What is most impressive about the rise in core inflation is that it has happened at a time when the economy has been demonstrably weak and the output gap has been gigantic (10-12% by my estimation). The main reason the Fed was so anxious to engage in QE2 was that it feared the output gap posed a serious risk of deflation. The bond market has been willing to ignore signs of rising inflation because of the pervasive belief that a large output gap provides an insurance policy against rising inflation. Yet these beliefs are being challenged almost daily. Thus, the Treasury market is perched very precariously on the edge of acceptable valuations, as real 10-yr Treasury yields are now clearly in negative territory.


Here's a Big Picture thought: what we see happening over the past year or so is the gradual undermining of widely-held theories about how the economy and inflation work. Keynesian economic theory is taking a beating, because it was used to justify a $1 trillion government spending stimulus package that not only failed to stimulate the economy as predicted, but most likely helped to weaken the economy. The Phillips Curve theory of inflation is also taking a beating, because inflation is much stronger than it has been predicting, given that unemployment is still very high.

The bad news for Keynesians and Phillips Curvers, however, is good news for supply-siders like me. Supply-side theory has been predicting relatively slow growth and a tepid recovery for over two years, since it recognizes that deficit-financed spending has no power to generate growth, and big increases in the deficit inhibit risk-taking because they tell the market to expect big increases in tax burdens in the future. (Two consistent themes of my predictions since early 2009 have been that the economy was likely to grow, but at a sub-par pace, and that inflation was likely to rise.) Rising tax burdens reduce the after-tax rewards to work and investment, so you end up getting less of both.

Monetarists and supply-siders have been predicting rising inflation for over two years, since they recognize that accommodative monetary policy, when fortified by a very weak currency, rising gold and commodity prices, a steep yield curve and low to negative real yields, will inevitably lead to higher inflation regardless of how weak the economy is. Indeed, in the supply-side framework, a weak economy is to be expected when monetary policy is inflationary. That's because easy money weakens a currency, and that increases the rewards to speculative activity while reducing the rewards to investment, and with weakened investment you get weak growth.

Along with the decline of Keynesian theories and the rise of supply-side theories, we are seeing a powerful realignment of political power in Washington. Obama, a dyed-in-the-wool Keynesian, is still insisting that what we need is more spending and more government control over the economy. But he is fighting a losing battle as more and more people begin to realize that Big Government is antithetical to prosperity. Keynesianism is all about giving power to politicians so they can pull the levers that supposedly will create growth, but now we see that politicians are fallible just like anyone and spending other people's money is never a very productive enterprise. Indeed, giving a handful of individuals who happen to inhabit Congress the power to spend a trillion dollars they don't have is so foolish as to be dangerous to our economic health.

What we can expect to see more of, fortunately, is policies that return power to the private sector, while also increasing the after-tax rewards to work and investment. Even if it takes a year or so for policies to make a clear shift in a more pro-growth direction, the prospect of improvement and the fact that in the meantime the economy is likely to continue to grow, should be enough to push equity valuations and Treasury yields higher.

Monday, December 5, 2011

Service sector report unimpressive


The November ISM service sector report was lackluster. It paints a picture of an economy that is just muddling along. There are sectors of the economy that are doing much better, however, which are not reflected in this report: mining and technology, for example. But overall the economy is growing only modestly faster than the growth of population. 


Despite lackluster growth in the service sector, and despite the economy's huge supply of unused physical and human resource capacity, more businesses report paying higher prices than report paying lower prices. This has been a persistent theme for well over a year now, and I believe it is a testament to a) the fact that monetary policy is accommodative, and b) the Phillips Curve theory of inflation is fundamentally flawed. If anything, this tells us that the risk of a monetary policy error (e.g., the Fed not having eased enough to promote a recovery) is very small at this point.


A few months ago this chart was upbeat, but now it is not. It might be reflecting the onset of a double-dip recession, but I think we would need to see meaningful deterioration in a variety of other indicators before getting worried. Consider all the positives that are still extant: weekly unemployment claims are still declining, private sector jobs are still growing, manufacturing and capital indicators are still positive, the yield curve is still steep, auto sales are strong, commodity prices are still quite elevated, industrial production is still expanding, capital spending is still strong, and corporate profits are very strong. Plus, there are increasing signs that the Eurozone is not going to give up without a fight: Italian 2-yr yields are down over 200 bps in the last 10 days, hitting 5.6% today; that's still quite elevated from an historical perspective, but it is meaningfully below the 7% level which many consider to be critical.