For the past several years the economy has been disappointingly weak (
the weakest recovery ever), and the stock market has periodically worried that things would get worse. The one reassuring constant in recent years has been 2-yr
swap spreads, which have been low and relatively stable, thus casting doubt on the validity of the market's concerns. Nothing much has changed of late.

The chart above shows how peaks in the market's level of fear, uncertainty and doubt (as proxied by the ratio of the Vix index to the 10-yr Treasury yield) have coincided with lows in stock prices. As fears rise, stock prices decline, and vice versa, as the market "climbs walls of worry." I've now labeled the fits of fear/walls of worry, to help with the analysis. The latest bout of fear has centered on the fears surrounding a possible UK exit from the European Union (aka Brexit). As polls and betting markets show the probability of a Brexit declining, markets have breathed a sigh of relief and stock prices have bounced.

If a Brexit spells bad news for the U.K. and the rest of Europe—I'm not convinced it does, but the market thinks it does—it stands to reason that a Brexit would hurt the Eurozone economy more than the U.S. economy, since U.S. exports to the Eurozone are a small fraction (~10%) of our total exports. And as the chart above shows, Eurozone equities have suffered significantly in the past year, whereas U.S. equities are relatively unchanged. In fact, it's not just a Brexit that is weighing on the fortunes of the Eurozone, it's long-term economic stagnation. I note that Eurozone equities have been underperforming their U.S. counterparts for quite a few years: since mid-2010 the S&P 500 is up almost 50% relative to the Euro Stoxx index. This alone suggests that the UK might be better off if unconstrained by EU shackles.

The chart above compares the price of gold to the price of 5-yr TIPS (using the inverse of their real yield as a proxy for their price). Both are go-to investments for those worried about rising inflation, geopolitical risks, and the end-of-the-world-as-we-know-it. Gold is impervious to the elements, and TIPS are not only impervious to inflation, they are the only security that offers a U.S. government-guaranteed real rate of return. Both prices have jumped in the past 5-6 months, no doubt encouraged by Brexit worries, general economic slowdown worries, terrorist attacks, and rising geopolitical concerns. But in the great scheme of things, prices of gold and TIPS are still lower than they were in 2011-2012, during the height of the PIIGS crisis. Things are bad, but not that bad.

The real yield on 5-yr TIPS is not only a measure of the market's inflation general instability concerns. As the chart above shows, real yields tend to follow the trend growth rate of the U.S. economy. When the economy was chugging along at 4-5% rates of growth in the late 1990s, TIPS carried a monster real yield of about 4%. With the economy growing at 4-5% per year, TIPS had to compete by offering a real rate that was somewhat less (because it is guaranteed). Now that the economy has been growing just over 2% per year for the past several years, TIPS real yields are trading at about 0%. You can lock in a zero real rate of return with TIPS, or you can take your chances with an economy that only promises to deliver 2% (which presumably sets a reasonable expectation for real returns on stocks). Not much has changed in this picture of late.

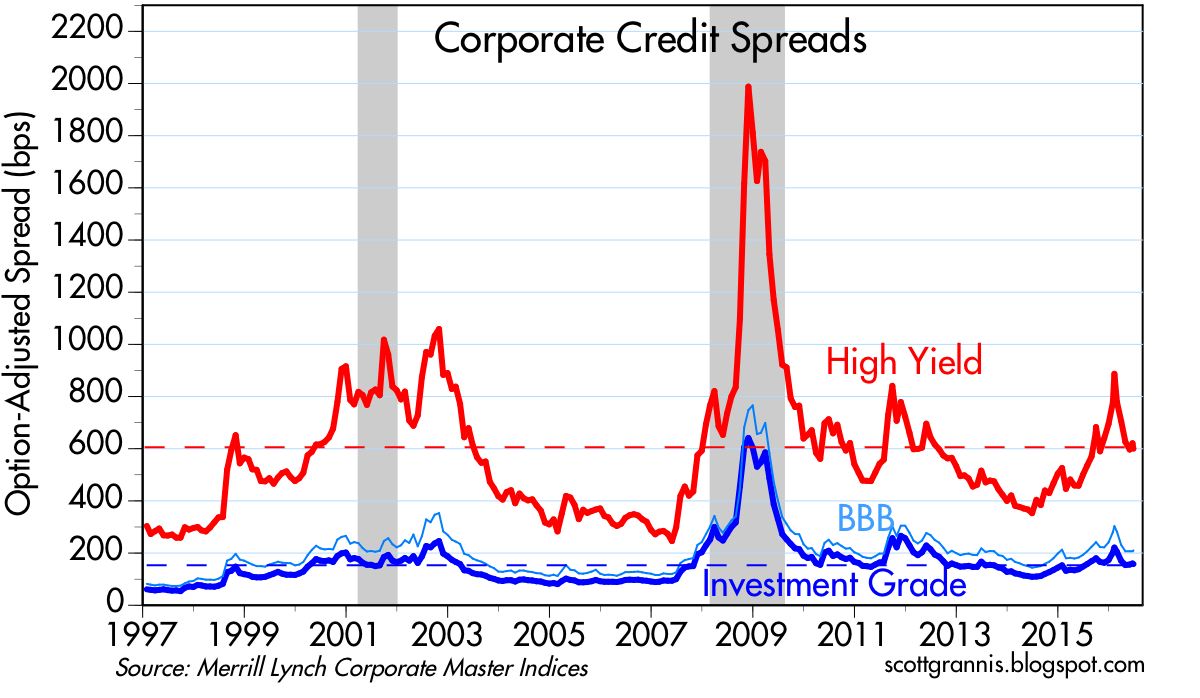
Bouts of fear are also reflected in credit spreads, which hit all-time highs in 2008, and lower highs during the PIIGS crisis and the recent collapse in oil prices. They are still somewhat elevated, which suggests the market is still concerned about a weak economy getting somewhat weaker. But they are far from panic levels. Oil prices are up, oil patch credit risk is way down, and the U.S. economy still appears to be growing, albeit still slowly.
The chart above is one I've showed many times over the past 7-8 years. It compares 2-yr swap spreads to high-yield credit spreads. I think it shows that swap spreads are good leading indicators of credit spreads and the health of the economy. They rose prior to the past two recessions, and declined prior to the start of the past two recoveries. They tend to rise before other credit spreads rise, and they tend to fall in advance of a decline in other spreads.
Throughout the recent oil-price-collapse crisis, swap spreads have remained quite low. I argued several times in the past six months that the message of swap spreads was very encouraging. Low swap spreads are indicative of healthy financial conditions—lots of liquidity and very low systemic risk. Healthy financial markets serve as a shock absorber for the real economy. Functioning and liquid markets facilitate the myriad adjustments that market participants make while coping with changing economic realities. The swap spread market was telling us all along that the crisis in the oil patch was going to be resolved without great calamity, and indeed that looks to have been the case.

Finally, the chart above, which compares U.S. and Eurozone swap spreads. U.S. markets are in somewhat better shape than their Eurozone counterparts, but neither market is pointing to a significant negative event on the horizon. That further suggests that the Brexit fears will eventually pass, and the market will successfully climb one more wall of worry.


 Posts