Sunday, June 5, 2016

Recommended reading: Ikenson on trade

Cato's Dan Ikenson has written an excellent summary of trade issues, "Trade on Trial, Again." It's timely, considering the Trump's total confusion on the subject. Hint: running a trade deficit does not mean we are "losing." Here's a short version that hits what I think are the high points, but do read the whole thing:

Not long ago, a group of Cato scholars entertained the question of whether the intellectual debate for free trade had been won.
There was near consensus that it had — in 1776 with publication of The Wealth of Nations. In the 240 years to follow, efforts to poke substantive holes and refute Adam Smith’s treatise failed and, today, nearly all economists agree that free trade, by expanding the size of the market to enable greater specialization and economies of scale, generates more wealth than any system that restricts cross-border exchange. 
[But] ... how much does it really matter whether the intellectual debate has been won when, in practice, free trade remains stubbornly elusive, and the process of U.S. trade policy formulation is distinctly anti-intellectual? 
If the free trade consensus were truly meaningful, trade negotiations would be unnecessary. If free trade were the rule, trade policy would have a purely domestic orientation and U.S. barriers would be removed without need for negotiation because they would be recognized for what they are: taxes on consumers and businesses that impede the global division of labor and the creation of wealth.

[Unfortunately] ... The case for free trade is not obvious. The benefits of trade are dispersed and accrue over time, while the adjustment costs tend to be concentrated and immediate. To synthesize Schumpeter and Bastiat, the “destruction” caused by trade is “seen,” while the “creation” of its benefits goes “unseen.” We note and lament the effects of the clothing factory that shutters because it couldn’t compete with lower-priced imports. The lost factory jobs, the nearby businesses on Main Street that fail, and the blighted landscape are all obvious. What is not so easily noticed is the increased spending power of the divorced mother who has to feed and clothe her three children. Not only can she buy cheaper clothing, but she has more resources to save or spend on other goods and services, which undergirds growth elsewhere in the economy. 
Consider Apple. By availing itself of lowskilled, low-wage labor in China to produce small plastic components and to assemble its products, Apple may have deprived U.S. workers of the opportunity to perform that low-end function in the supply chain. But at the same time, that decision enabled iPods and then iPhones and then iPads to be priced within the budgets of a large swath of consumers. Had all of the components been produced and all of the assembly performed in the United States — as President Obama once requested of Steve Jobs — the higher prices would have prevented those devices from becoming quite so ubiquitous, and the incentives for the emergence of spin-off industries, such as apps, accessories, Uber, and AirBnb, would have been muted or absent. 
But these kinds of examples don’t lend themselves to the political stump, especially when the campaigns put a premium on simple messages. This is the burden of free traders: Making the unseen seen. It is this asymmetry that explains much of the popular skepticism about trade, as well as the persistence of often repeated fallacies. 
The benefits of trade come from imports, which deliver more competition, greater variety, lower prices, better quality, and new incentives for innovation. Arguably, opening foreign markets should be an aim of trade policy because larger markets allow for greater specialization and economies of scale, but real free trade requires liberalization at home. The real benefits of trade are measured by the value of imports that can be purchased with a unit of exports — our purchasing power or the so-called terms of trade. Trade barriers at home raise the costs and reduce the amount of imports that can be purchased with a unit of exports. 
Protectionism benefits producers over consumers; it favors big business over small business because the cost of protectionism is relatively small to a bigger company; and, it hurts lower-income more than higher-income Americans because the former spend a higher proportion of their resources on imported goods. 
[Fortunately] ... Even if there were a President Trump or President Sanders, rest assured that the Congress still has authority over the nuts and bolts of trade policy. The scope for presidential mischief, such as unilaterally raising tariffs, or suspending or amending the terms of trade agreements, is limited. But it would be more reassuring still if the intellectual consensus for free trade were also the popular consensus.

As for the TPP Treaty, we don't need it, because we should not be imposing any barriers  or conditions on our trade with Pacific nations. Or any nations, for that matter.


Friday, June 3, 2016

No improvement in the jobs market

The June employment report was much weaker than expected (+38K vs. +160K), but it's not necessarily the case that the engine of economic growth has virtually shut down. We've seen a half dozen very weak numbers like this over the past 5-6 years—it's the nature of this beast to be very volatile on a month-to-month basis. The monthly payroll numbers are simply not reliable enough to make confident judgments about the health of the economy, and, moreover, they can be revised significantly in the future.

What the report does tell us is that there is no sign of any fundamental improvement in the economy or the jobs market. There had been hints of improvement in past reports (e.g., a rise in the labor force participation rate and a quickening in the growth of the labor force), but they've been largely reversed now. As a result, it's likely that the economy is still plodding along at a miserably slow pace and will continue to do so unless and until there is a meaningful change to fiscal policy.  

The Fed will find it hard to raise rates given the lack of any fundamental improvement in the jobs market, but the market fully understands this and rates are priced accordingly (no rate hikes expected for at least a few months, 10-yr yields at 1.7%, very close to their all-time low of 1.4% which was registered in July '12). Inflation expectations remain subdued (at around 1.5%), notwithstanding today's jump in gold prices and drop in the dollar. Meanwhile, liquidity is abundant (2-yr swap spreads are still very low) and the market exhibits little or no sign of any systemic stress. All eyes remain glued to the presidential elections for clues to the future, few of which have been forthcoming to date. 


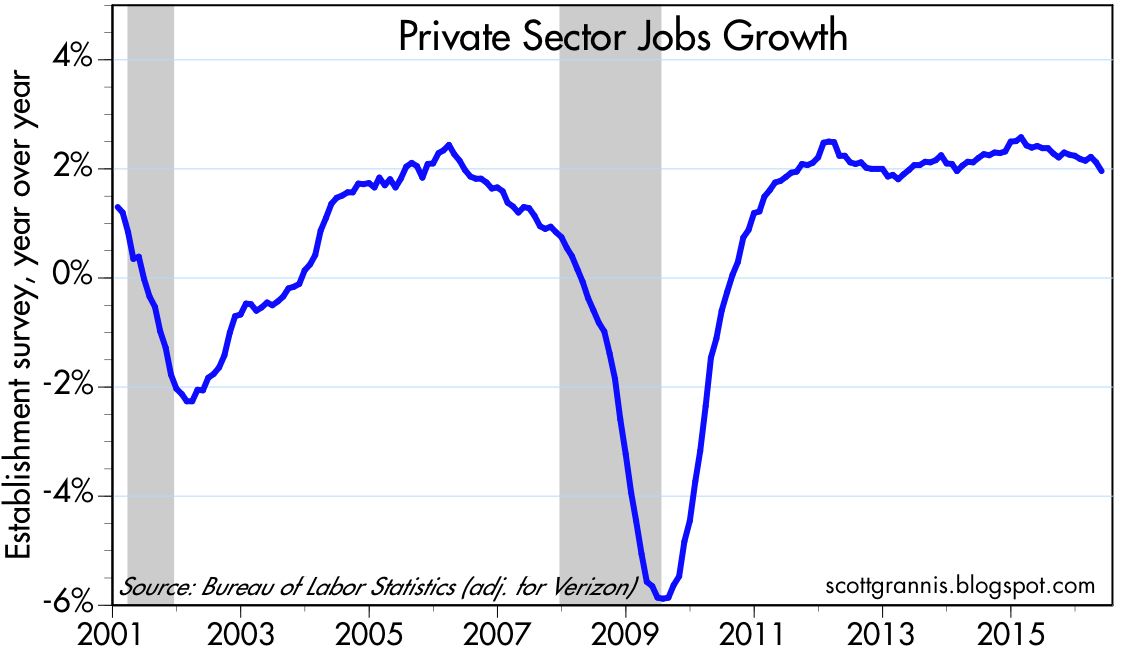
The first chart above shows how volatile the month-to-month numbers can be. I've adjusted the reported June number to reflect the fact that about 35K Verizon workers were on strike last month and thus were counted as unemployed. However, the strike has since been settled and they will be added back to the July jobs tally. We've seen about a half dozen weak numbers since the recovery began. As the second chart shows, the year over year growth in the labor force is still very much in line with what we've seen since 2011.


One reason to suspect that the June numbers were artificially low—and thus likely to be reversed in coming months—is the ADP report for June, which estimated private sector job growth to be 173K. These two series have tracked each other pretty well over the years, with the BLS series typically much more volatile. If the past is any guide, we'll see surprisingly strong jobs growth in the BLS numbers in coming months.


The unemployment rate dipped to a new cycle low, but mainly because lots of people apparently left the labor force, which we now see hasn't grown at all in the past five months. The labor force participation rate, which had begun rise earlier this year, now looks flat. At least things are not getting worse.

Wednesday, June 1, 2016

Growth persists

We're still in the weakest recovery ever, and despite widespread fears that it is running out of gas, the US economy continues to expand. Here are some charts that document the ongoing, modest business cycle expansion:


The ISM May manufacturing index was a bit stronger than expected (51.3 vs. 50.3), but it suggests that the economy is growing at a pace (2% or so) that is the same as we have seen, on average, over the past seven years. It's likely, therefore, that Q2/16 growth will be substantially higher than the 0.8% registered in Q1/16. This won't imply any meaningful acceleration of growth, however, since quarterly growth rates are typically much more volatile than the underlying growth trend.


The export orders subindex of the ISM manufacturing report was mildly positive, since it points to some modest improvement in overseas economies.


With oil prices having risen 50% in the past 4-5 months, it's not surprising to see the prices paid subindex jump to levels not seen for almost 5 years. Deflation is yesterday's news.


The employment subindex of the ISM report is symptomatic of what continues to ail the economy: a lack of investment. Companies are not confident enough about the future to commit to serious expansion and hiring plans.


Manufacturing activity in the Eurozone is about as un-robust as it is in the US.


The chart above suggests that changes in the ISM manufacturing index tend to lead (though not always) changes in 12-mo. trailing revenues per share of the S&P 500 companies. If this relationship holds, we should see a return to rising revenues per share by year end. As it is, revenues per share have only dropped. 1.2% over the past year—a relatively modest slowdown.


I wish it were more pronounced, but the decline in the prices of TIPS and gold over the past month or two suggests that the market has become a bit less worried and pessimistic.


Less worry translates into a modest rise in equity prices, as the chart above shows.


As the chart above shows, the rise in oil prices has coincided with a firming in non-energy commodity prices. Over time, the correlation of the two is strong, but oil prices are far more volatile (note the difference in the scales of the two y-axes).


The chart above shows that commodity prices have risen vis a vis most currencies in recent months. So it's not just a currency phenomenon, it's more likely that global economies have strengthened on the margin. It's worth highlighting here the fact that the Swiss franc has been the most stable—in commodity terms—of the major currencies over the years.


The housing market continues its recovery, with prices approaching their highs of just over 10 years ago. I note the apparent trend for inflation-adjusted (real) housing prices to average just over 1% per year (shown in the second chart), a rate that would be consistent with ongoing improvements in quality, size and amenities. UPDATE: This is bolstered by recent Census Bureau data, as summarized in  Mark Perry's post showing how square footage has increased over the years.


This chart has been one of the most reliable guides to upcoming recessions that I'm aware of. It suggests that recessions typically follow sharp increases in real short-term interest rates and a flattening or inversion of the Treasury yield curve (both conditions being symptomatic of very tight monetary policy). Today we are not even close to those conditions. Real interest rates are still very low, and the slope of the yield curve is a bit above average. In the absence of tight money and in the presence of relatively cheap energy prices, it's likely that the economy will continue to grow.


It's been a sluggish recovery and many millions are still without jobs. But in aggregate, real disposable incomes have been rising and continue to do so. Gains in the past year (3.2%) are in line with historical experience, but the level of disposable income remains significantly less than it might have been had this been a typical recovery. Jobs and income have gone missing, but it is a recovery nonetheless.

All of this makes a strong case for avoiding the very low yields on cash and cash equivalents.