Monday, January 3, 2011

Strong manufacturing report


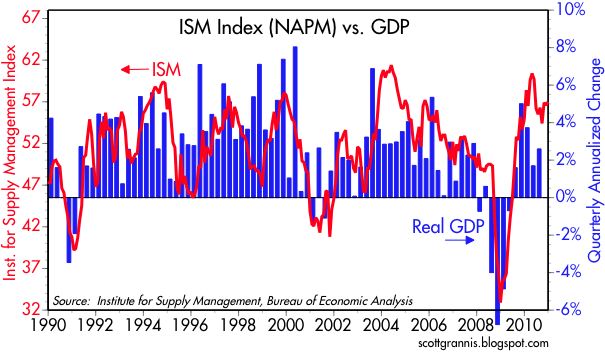
The December ISM manufacturing index came in about as expected, but it continues to point to stronger-than-expected economic growth. As this chart—one of my favorites that I have been using for more than 10 years—suggests, the recent behavior of the ISM index is pointing to GDP growth of 4% or more, leading me to expect that Q4 GDP will be much stronger than the 2.5% reported for Q3.


The Prices Paid component of both ISM indices continues to point to the absence of deflationary pressures and the persistence of inflationary pressures. Some of this could be explained by the rising price of crude oil, as the second chart suggests, with the rest being explained by rising commodity prices, a cheap dollar, a relatively strong global economic backdrop, and accommodative monetary policy.


The Employment component of the ISM index dipped in December, but remains at what is a relatively lofty level. Altogether, the ISM report continues to paint a picture of a relatively strong, ongoing recovery in the manufacturing sector, and this strength is likely to spill over into other sectors of the economy as the year unfolds.

Sunday, January 2, 2011

The long-term view of Treasury yields


Just for the sake of putting things in perspective, here is a look at the last 85 years of 10-yr Treasury yields. The green line marks the 2010 closing level: 3.3%. It took a depression and massive deflation to drive yields lower, back in the 30s and 40s. I continue to believe that the relatively low level of Treasury yields today is an excellent indicator that the financial market is terribly worried about the ability of the U.S. economy to grow and prosper. That leaves plenty of upside potential for the optimists, of which I am one.

A return to prosperity


As we start the new year, we can give thanks for the very impressive comeback in equity valuations that has played out over the past 21 months. The capitalization of global equities is now only 16% shy of its all time high, which occurred in late 2007, and just over double what it was at that awful bottom in early March 2009. A full recovery to the 2007 high will add $10 trillion to global market cap, and I see no compelling reason to think it won't happen within the next year or two. Two years ago, financial markets were all but convinced that the global economy would be mired in a deep, deflationary depression for the next several years at least. Fortunately, the future turned out to be a whole lot better than what it was supposed to be.

Mark Perry has some related comments here.