Monday, February 1, 2010
Inflation risk is heating up
This chart shows the market's 5-year, 5-year forward expected inflation rate. Today it is making a new multi-year high. Gold has perked up today as well, gaining $23 to $1104/oz. These facts square with the ISM's January price index reading of 70. Deflation is history, inflation is making a comeback. None of this squares with the skeptics' call for a double-dip recession or even 2-2.5% growth. The key inflation fundamentals are very accommodative monetary policy coupled with declining money demand. Money demand, in turn, is falling because confidence in the economy is returning; money that was hoarded when the outlook was disastrous is now getting put back into the economy. Check out my post last Friday on money velocity for more details. Every day the Fed delays a reversal of its quantitative easing is another day that inflation risk rises.
The market is not entirely unaware of this, as this next chart shows. Despite the Fed's continual assurances that short-term rates will not budge for a long time, the yield on 3-month T-bills has been rising. I don't want to make too big a deal of this, because the rise in yields is still miniscule, but all important changes happen on the margin, and this one looks like it's just getting underway. If bill yields continue to rise, the Fed will eventually get the message that it's time to tighten.
Energy conservation doesn't require a federal mandate
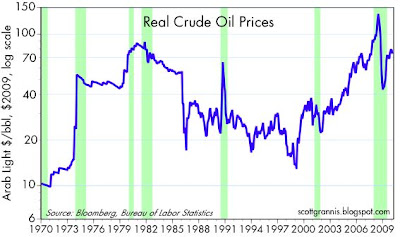
Here are two charts that illustrate how effective free markets can be in the conservation of energy. As the first chart shows, consumers spend less of their income on energy today than they did in in 1970, despite the fact that the price of oil—the source of most energy—has risen some 600% in the intervening years in real terms, as shown in the second chart.
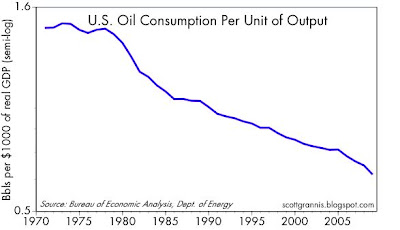
But here's a more accurate description of what has happened: since oil prices have risen 600% in the past 40 years, consumers now spend 13% less of their income on energy. Rising oil prices have spurred conservation and technological advances that have drastically reduced the amount of oil we need to run our lives and our economy. As this next chart shows, the U.S. economy today uses 57% less oil per unit of output than it did in 1970.
Free markets have thus accomplished the task of greatly reducing our energy dependence. We don't need any federal mandates or new programs or new spending to develop "green" energy. It's a process that is already well underway.
ISM indices are very bullish
The Institute for Supply Management's indices of manufacturing activity are full of V-shaped recovery signs. To be sure, these are diffusion indices, so they don't measure the strength of the rebound in manufacturing conditions; they measure instead the breadth or scope of the improvement. For example, the first chart tells us that 58.4% of those surveyed reported seeing increased activity. In an historical context, this is quite an impressive number, and it has coincided with GDP growth of 5% or more—which is exactly what we saw in Q4/09. But whereas recovery skeptics dismissed the Q4 growth as mainly due to a decline in the pace of inventory liquidation, the ISM numbers are saying that the strength of the recovery is more impressive than the latest GDP statistics suggest.
It's noteworthy also that the prices paid index has jumped to 70, which means the vast majority of businesses are paying higher prices these days. That's not exactly the sort of stuff of which deflation—still a popular theme among the recovery skeptics—is made.
I'd say the economy is in classic recovery mode, and deflation is history. This is reason for great cheer, even if Obama's $3.8 trillion budget proposal is an abomination. More on that later.
Subscribe to:
Posts (Atom)