


June CPI and PPI figures were released this week, and the buzz centers around whether Trump's tariffs have boosted inflation. There is some evidence in the numbers of tariffs boosting the prices of some goods, but it would be premature—and unwise—to declare that yes, tariffs are causing a rise in inflation.
Tariffs arbitrarily increase the price of some goods, but that is not the same as monetary stimulus, which is the only thing that can boost the overall level of prices. Absent an increase in the supply of money, higher prices for some goods will almost certainly result in lower prices for other goods. A household on a fixed budget that is faced with higher prices for food will have to cut spending on some other things.


In any event, it's difficult if not impossible to find evidence in the numbers that inflation is rising. Here are some charts to prove it:
Chart #1

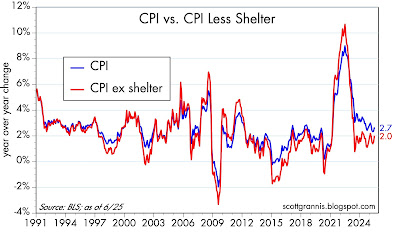
Chart #2

Charts #1 and #2 both focus on the CPI and the CPI without its shelter component. The first chart shows the change in these indices on a 6-month annualized basis, whereas Chart #2 shows the year over year change. I fail to see where the latest numbers have changed the overall picture. By any of these measures, inflation currently is somewhere in the neighborhood of 2-2.7%.
Moreover, according to Chart #2, the ex-shelter measure of inflation has been 2% or less for the past two years, as I've been pointing out repeatedly over the past year or so. The reason? The method the BLS uses to determine shelter costs is flawed, as illustrated in Chart #3.
Chart #3

Chart #3 is designed to show that Owner's Equivalent Rent (OER), which makes up about one-third of the CPI index, is driven by the year over year change in housing prices 18 months ago. Talk about lags! The rise in housing prices has slowed significantly over the past few years, and the most recent surveys show that housing prices are actually flat to down a bit over the past year. Yet OER purports to tell us that housing costs have increased by about 4% in the past year. Using a more contemporaneous measure of housing costs would thus yield a much lower overall rate of inflation.
Chart #4

Today the June figures for Producer Prices were released. They show inflation running at 2 to 2.5% over the past year. But as Chart #4 shows, producer prices overall have only increased 0.7% in the past three years, for a 0.2% annualized rate!
Chart #5

Chart #5 shows an index of non-energy commodity prices. Since overall inflation peaked in mid-2022, these prices are essentially unchanged.
Chart #6

Chart #6 shows the price of crude oil, which is a key determinant of energy prices and which has been extremely volatile over the past 60 years. Since mid-2022, when most measures of inflation peaked, energy prices have been falling.
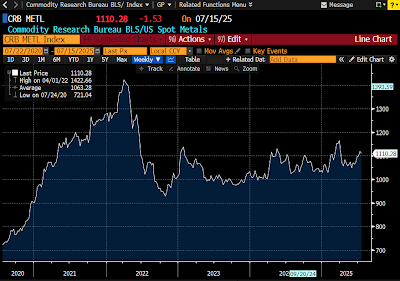
Chart #7

Chart #7 shows an index of five industrial metals prices, one of which is copper, which jumped 10% 10 days ago, thanks to a new Trump tariff. Still, metals prices overall are unchanged over the past three years.
Inflation isn't determined by individual prices; you have to look at broad measures of prices over time. Focusing on one month's numbers is a fool's game, since monthly data are notoriously volatile.
Commodity prices have been generally stable for the past three years. This is a solid base for the conclusion that the Fed is doing a good job of keeping inflation low.

7 comments:
Anyone serious about fighting inflation will support the end of property zoning.
Housing shortages cause inflation.
The government has criminalized new housing construction in much of the nation, especially the West.
But...there are no liberals, and no libertarians, when neighborhood property zoning is under review.
My favorite price index is the PPP, which has indeed been acting well for a few years. Between late 2020 and mid-2022: a disaster.
Other Charts: GDP forecasts. These (links below) are so bad they are essentially useless. I don't understand what the economics "profession" is trying to accomplish.
For your enjoyment:
https://www.atlantafed.org/cqer/research/gdpnow
https://www.newyorkfed.org/research/policy/nowcast/#nowcast/2025:Q2
https://www.atlantafed.org/blogs/macroblog/?tagid=5d64153e-5dc7-45ae-bb82-6543627ad65d
https://www.cbo.gov/publication/59349
https://www.atlantafed.org/blogs/macroblog/2022/05/19/evaluation-of-gdp-nowcasts-during-pandemic
Thanks for posting these charts, which inform and challenge my views. I don't buy Arabian light crude, but I do buy gasoline and, according to this YChart, it's been getting more expensive. Is the YChart chart wrong? https://ycharts.com/indicators/us_gas_price
Somewhat unreleatedly, how did this get started, that the trade deficit doesn't matter because it is balanced by the surplus capital account? It all depends on what this surplus capital account is. If it was investment in US businesses, that would be fine, but it is not. For the most part it is investments in US Treasuries. We all know where the "efficient" use of this money goes.
It is like me saying that my balance of payments, as a drug user, are in balance, because I buy drugs from my pusher (trade deficit) and borrow money from him to do so (capital surplus).
How such a superficial, if not duplicitous, treatment of a concept has gone on so long without total riducule is another troubling thing about truth in our world.
Dear Sir,
I really like your posts, they are not merely opinions but based on facts (charts) which I really appreciate.
Regarding inflation, it’s like if you leave a gas bottle with the valve open in a closed kitchen. You take the temperature of the kitchen 10 minutes after leaving the valve open and show it in a chart.
Temperature is ok. 20 minutes later, you do the same. Temperature keeps being the same. And you show us the chart of the room temperature. See what I mean.
Regarding inflation, now it is tamed, and you show us the chart.
The reality is that West world governments have being increasing the debt without limits for a loooong period and that is the gas valve open.
Take your poison as you will, sooner or later, and I think it will be sooner than later, we all wil be seeing the consequences. And then, charts will show something different.
In the meantime, enjoy the ride.
Inflation might look tamed so far.
And as I previously said, thanks for your posts
Reduce rates!!!! Start with the 25 pts
Post a Comment