


Today's June M2 release brought more good news: the M2 money supply in June was lower than its May level, and M2 has only increased at a very slow 1.7% annualized rate in the past six months. This all but ensures that inflation pressures have most likely peaked and year-over-year inflation will be falling by the end of this year, if not sooner. Slow money growth also is good news for the economy, since it means the Fed will not need to tighten nearly as much as the market seems to fear—and that, in turn, dramatically reduces the risk of a near-term recession.
The current episode of Fed tightening that we are living through is fundamentally different from all the others. Why? Because the excess money creation that fueled the surge in inflation over the past year was a one-off event that was tied directly to the trillions of dollars of fiscal "stimulus" that politicians pumped into the economy in the wake of the Covid lockdowns. As I remarked her two years ago, "The shutdown of the US economy will prove to be the most expensive self-inflicted injury in the history of mankind." And indeed it has proven thus. Not only was it futile—respiratory viruses cannot be contained by any known means, and masks are not only useless but unhealthy, especially for children—it was extraordinarily expensive since it thoroughly disrupted the world's major economy and was indirectly responsible for a worldwide surge in inflation whose consequences will be felt for many more months to come.
The Fed was guilty of tolerating a huge expansion in the money supply for too long, but Fed policy did not create it; massive fiscal deficits did. And since those deficits have all but disappeared, the money supply is coming back to earth. Monetary conditions have effectively tightened with only modest increases in interest rates.
In the past, the Fed tightened monetary policy by reducing the supply of reserves to the banking system. By making money scarce, the price of money rose (i.e., interest rates rose). Higher interest rates tend to slow the growth of money and slow the pace of inflation, but a forced scarcity of money typically led to myriad pernicious effects. It shuts off the flow of credit to businesses and households, ultimately resulting in bankruptcies and a collapse in the housing market.
Today's "tightening" features only higher interest rates. Monetary liquidity is still abundant, and credit spreads (leading indicators of bankruptcies) are only moderately elevated. A doubling of mortgage rates was almost immediately accompanied by a cooling of the housing market; those looking to buy a house found that the cost of doing so was suddenly much more than they could afford, so they pulled back and prices in many areas have subsided. Banks didn't stop lending so much as people stopped borrowing.
Chart #1

Chart #1 shows the 6-mo. annualized growth rate of M2. The massive money-printing episode which gave us 10% inflation is now history. The Fed didn't have to do much if anything in the way of tightening to get this result, since it was mainly the fault of politicians who showered the economy with money.
Chart #2

Chart #2 shows the level of M2 relative to its long-term trend growth rate of 6% per year. The gap between the two has narrowed this year and will continue to do so.
Chart #3

Chart #3 compares the year over year growth of M2 to the level of the federal budget deficit. It's overwhelmingly obvious that the deficit was the source of the surge in M2. But the deficit in the past 12 months has subsided to a "mere" $1.05 trillion, down dramatically from a peak of over $4 trillion. The money you received in stimulus checks in 2020 and 2021 was hot off the printing press, and that is why we have so much inflation today. Thank goodness it's now a thing of the past.
Chart #4

The bond market has figured this out, fortunately. As Chart #4 shows, the market expects CPI inflation to average about 2.5% per year over the next five years. The Fed doesn't have to do much more, since a solution to our inflation problem is already baked in the cake, so to speak.
Chart #5

The commodity markets have reacted as well to the changing monetary conditions. Virtually every commodity has fallen significantly from its recent peak. Meanwhile, the dollar has been strong throughout, which implies that the US economy is in fundamentally good shape, especially compared to other economies.
Chart #6

Chart #6 is critically important, since it shows that liquidity conditions (as measured by 2-yr swap spreads, which currently trade at the very reasonable level of 23 bps) in the US economy are excellent. There is no shortage of money; markets are liquid, and that is almost a guarantee that we are not staring into any abyss these days. The Fed hasn't really tightened at all, and the banking systems is functioning normally. The economy is working off the excess of M2 in a healthy, non-threatening fashion.
Chart #7
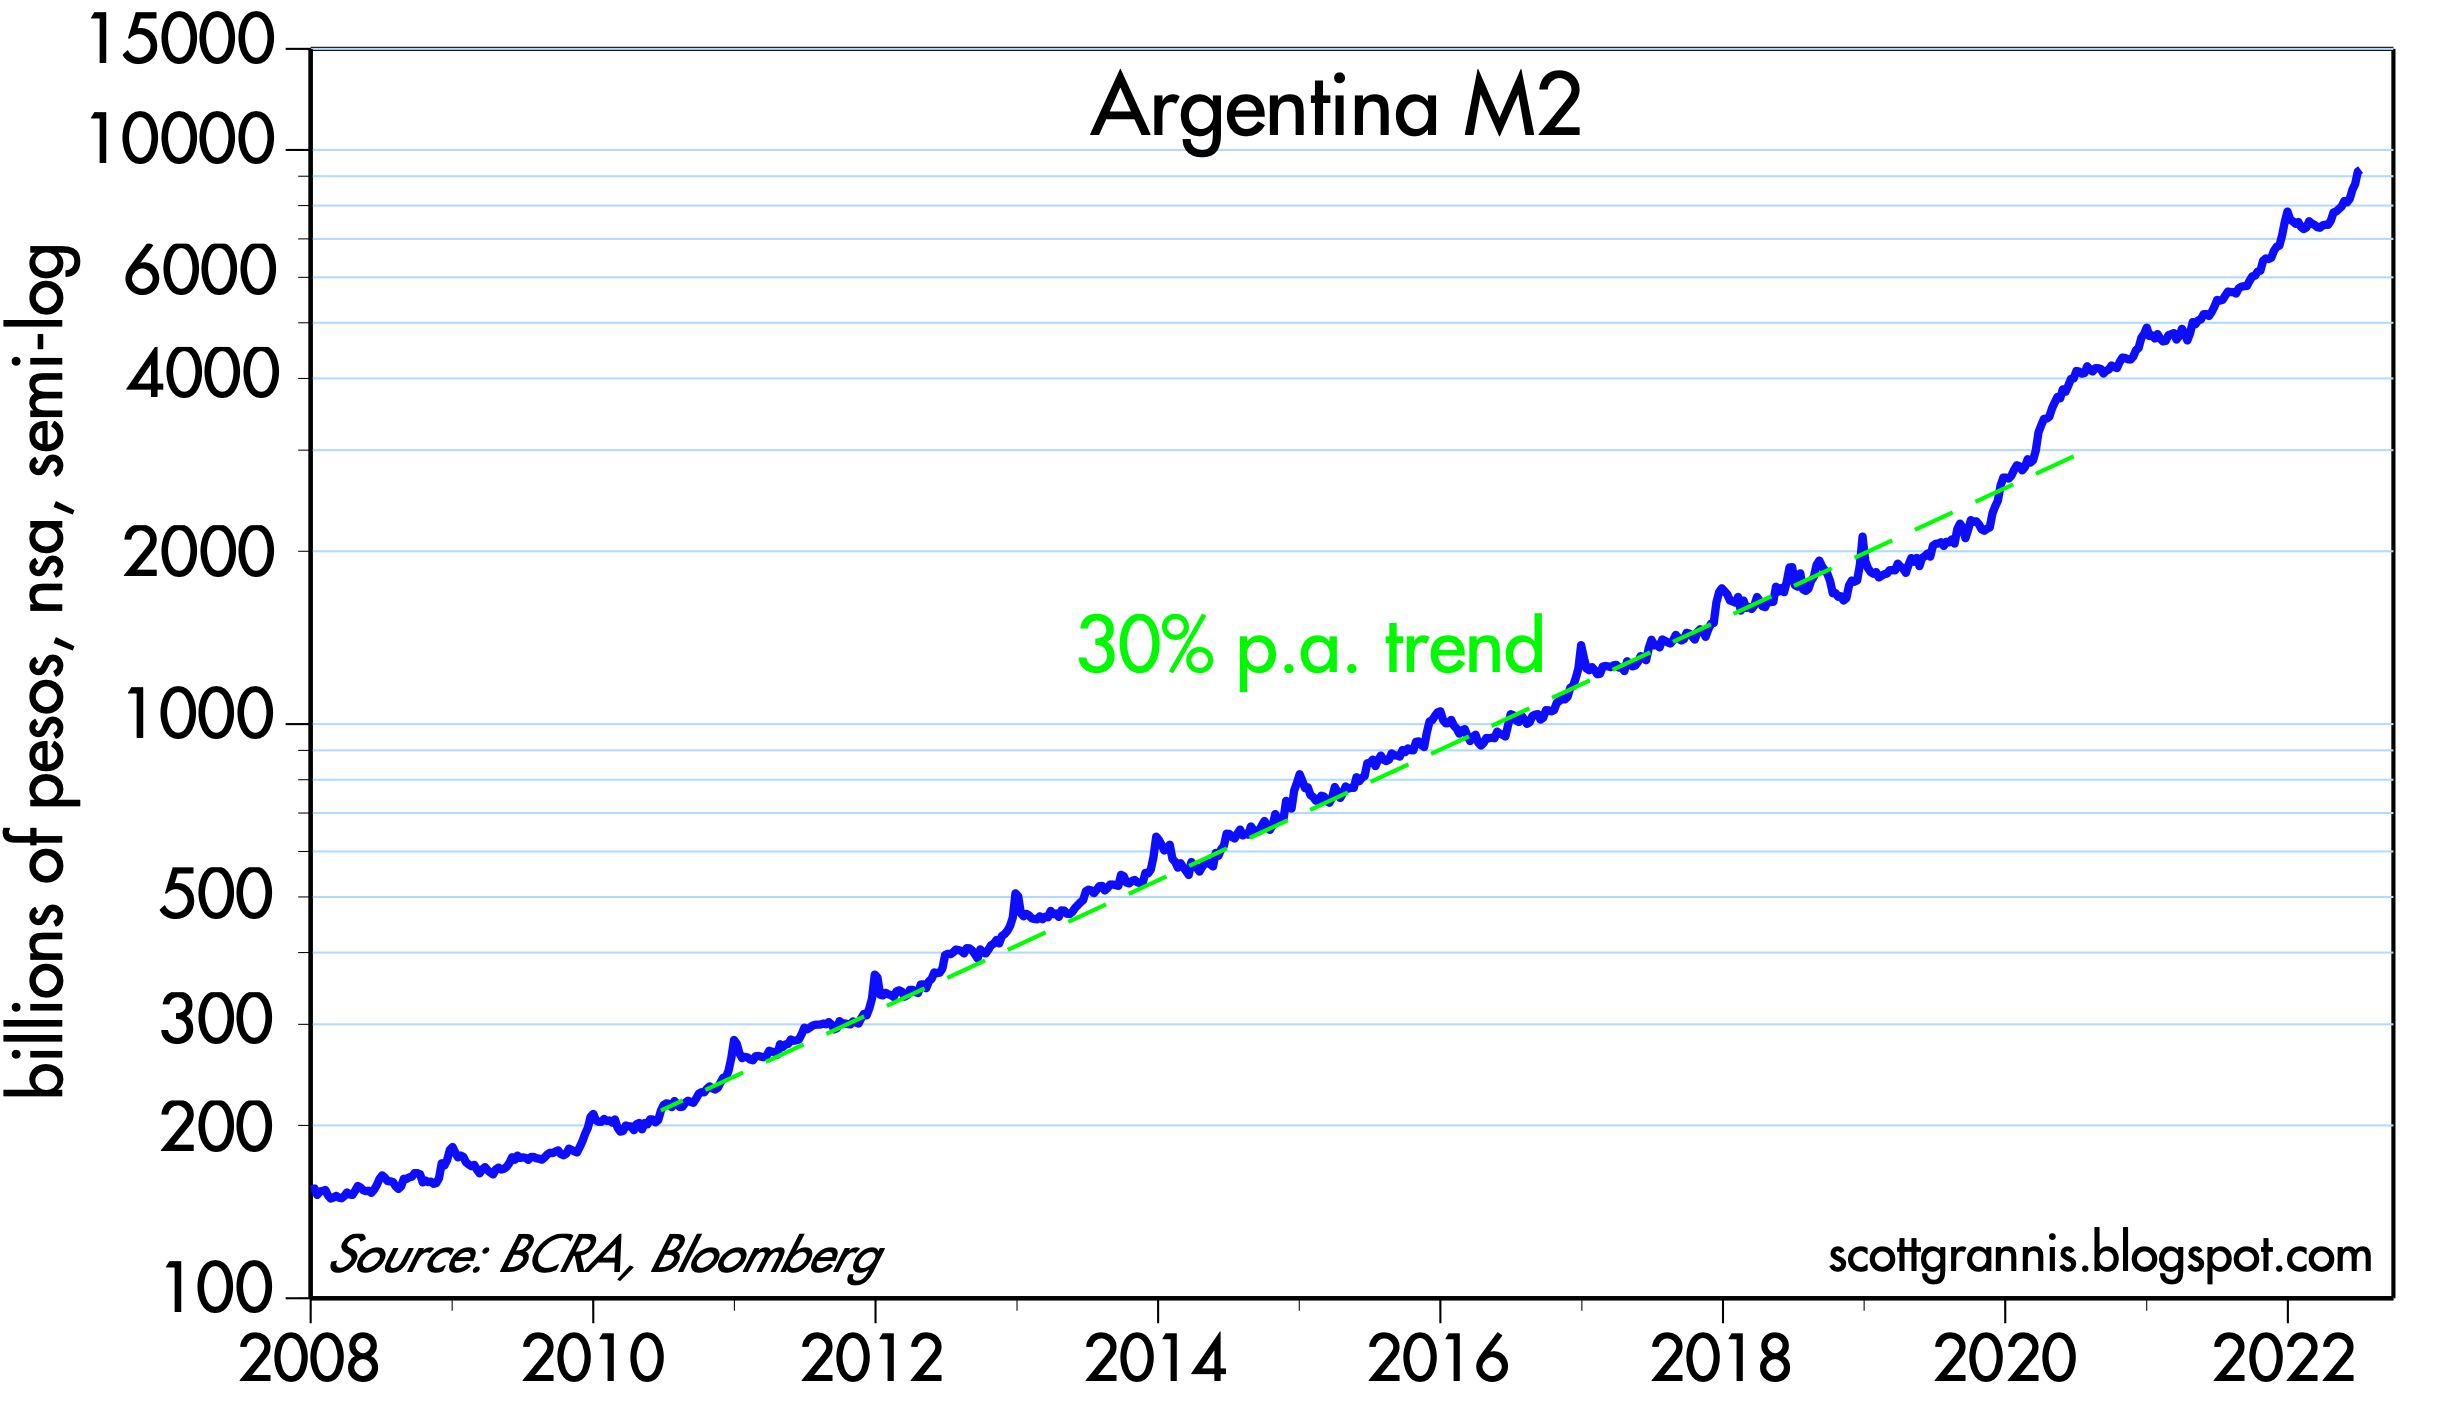
I can't resist featuring a few charts from Argentina, a country I have known and followed closely for the past 50 years. Argentina is where I first learned about how inflation works. Click here for a synopsis. Argentina has had a long and tragic history of high inflation, and it couldn't get much worse than it has been in recent years. As Chart #7 shows, Argentina's money supply grew at a 30% annual rate from 2010 through 2020; since then it has grown even faster—in the past 12 months, in fact, it has surged by almost 70%!
Years and years of money printing has given Argentina a lifetime of high inflation episodes of what might be termed hyper-inflation. (I was there to witness a bout of hyperinflation, in which prices doubled in the span of three weeks.)
Chart #8

Not surprisingly, all that money printing has destroyed the value of the peso. As Chart #8 shows, the Argentine peso has lost fully 99% of its value vis a vis dollar since early 2007. The black market exchange rate(aka the "blue" rate) has collapsed to well over 300, far below the official rate of 130. This can't go on much longer, but I wish I knew what comes next. I would certainly agree with Steve Hanke that Argentina's only salvation is to dollarize its economy, but that is unlikely since it would mean that politicians would have to balance the budget in an honest fashion. But who knows, desperate times usually result in desperate measures.
In any event, it's greatly comforting to see that the US money supply grew at a 30% rate only briefly, and the US dollar remains one of the world's strongest currencies.

18 comments:
pangloss strikes again, as ever worshipping at the church of latter day fed apologists.
Scott,
Thanks again for an excellent analysis. There is one thing I don’t understand about it. You clearly believe that M2 is the key to inflation as I do too. The fed has brought that growth down to a reasonable level. Your charts though show that M2 is still off the charts at 25% above normal. With nominal average growth of M2 at 6% and current actual growth at 1.7% it will take 5 years or so for M2 to return to a normal level. Meanwhile the current massive oversupply of M2 will be putting the same amount of pressure on inflation Commodities have definitely dropped, but only in US$.
Scott - Appreciate your perspective and wisdom.
Q: How is the Fed lowering the money supply? Just by letting bonds they hold on their balance sheet "mature", and not reinvesting the cash in new bonds? Essentially shrinking the Fed Balance Sheet by letting assets mature?
I did not know any part of the US Government ever did anything to shrink it's size...
Scott,
I agree with George's points. Wouldn't the fed have to go negative? and they can't because the money is already in the bank accounts, etc...The fed has NO control over this 40% already printed except maybe paying higher rates to the banks to NOT lend or regulating tighter lending standards. So, like George I see 5 years of excess and the fed is going to have to print more money for the deficits Congress/Gov is running. The treasury taking in more in the last few months at tax time will not last. What are we seeing to contradict our fears?
george, re level of M2: The thing to watch is not just the level of M2, but the level of M2 relative to nominal GDP. It's the ratio (M2/GDP) that measures the demand for money. If M2 holds steady, for example, but GDP grows by, say, 6% per year (2% real plus 4% inflation), then the ratio of M2 to GDP will decline by about 6% per year. I fully expect it will decline as people try to reduce their holdings of money.
Re "how is the Fed lowering the money supply?" The money supply grows when banks make new loans. When you borrow money from a bank, the bank credits your account with money, and simultaneously puts an asset on its balance sheet in the form of your IOU. The money you receive is effectively created out of thin air. The money supply grows when more people want to borrow money rather than paying off their debts. So the recent decline in M2 means that more debts were repaid than there were new loans created. When you pay off your debt, that is symptomatic of you experiencing an increased demand for money (wanting to hold more money is the opposite of borrowing money).
The Fed can encourage people to want more money by raising short term interest rates. That makes holding money balances more attractive and borrowing money less attractive. So the recent decline in M2 is a sign that higher interest rates are working: people are saving more and borrowing less.
Like your M2/GDP measure. Like the fact that you monitor the money stock. But the distributed lag effect of money flows, the volume and velocity of money, have been mathematical constants for > 100 years.
As Greg IP said, WSJ June 22, 2022: "The money supply had a poor record of predicting U.S. inflation before last year thanks to conceptual and definitional problems that haven’t gone away.
Of course, IP is wrong.
The Keynesian economists have finally achieved their objective: that there is no difference between money and liquid assets.
The FED no longer has the “tools” to control N-gDp. The money supply can never be properly managed by any attempt to control the cost of credit. Interest is the price of credit. The price of money is the reciprocal of the price level.
The effect of the FED’s operations on interest rates is indirect, varies widely over time, and in magnitude. What the net expansion of money will be, as a consequence of a given injection of additional reserves, nobody knows until long after the fact.
The consequence is a delayed, remote, and approximate control over the lending and money-creating capacity of the payment’s system.
It’s simple. Lending by the banks is inflationary (increases the volume and turnover of new money). Lending by the nonbanks is noninflationary (results in the turnover of existing money). The fallacious Gurley-Shaw thesis has run its course.
Is the economy on the cusp of a recession? I don't think so. But tomorrow we will learn the government's first estimate of Q2 GDP. If it is negative, many will say we are in a recession (i.e., there have been two consecutive quarters of negative growth. But if it is a small negative, like Q1 was, then it will be tough to say that we have been in a recession.
Three things not many talk about:
1) GDP growth estimates can and do change significantly over time, and for up to two years after the fact. A -1.6% growth estimate might end up being revised to a positive rate next year.
2) GDP growth numbers are quarterly annualized. That means that Q1 GDP growth of -1.6% was actually just a -0.04% change. That is so small as to be insignificant given the potential for sizable revisions in the months and years to come.
3) Since inflation is running at relatively high levels (e.g., 8-10%) compared to real growth (which is rarely greater than 3%), nominal GDP growth is dominated by inflation. A small miss on inflation could easily swamp the estimate for real growth, which will only be known with certainty for many months. Take all these numbers with a grain of salt.
The only things we can be relatively comfortable about these days are 1) inflation is relatively high and 2) real growth is relative low and modest.
correction: ... the only things we can be relatively confident about are ...
Constructive criticism. :)
i just re-read the last November thread titled: "Recession risk is very low, but inflation is high" and the (your) 'narrative' has evolved..
It was quite clear then (see then comments) that money supply growth was coming to a net halt and the idea was to guess the lag for the money supply component of inflation to disappear.
The WSJ recently had a piece on that (lag):
https://www.wsj.com/articles/why-inflation-is-on-the-way-down-recession-chairman-paul-volcker-markets-free-growth-fomc-jerome-powell-11658764327?mod=hp_opin_pos_4#cxrecs_s
Of course, understanding the specific sources of money supply growth helped to see the developing picture, then.
And the Fed now is tightening as the economy is slowing (!) without integrating the very potent lag that they are introducing.
Q1 and Q2 real GDP numbers may need to be revised up (using many inputs including GDI) but the slow down in the real economy has become, since May-June, very significant. The next quarters do look dismal.
Concerning the comments above, it may be helpful to remember the conclusions from Friedman's description of helicopter money. It's a one shot deal. Once money is 'distributed', price go up in proportion to excess money but, once this new money is in the system, it no longer perpetuates inflation. The fact that wages have been lagging (more and more) consumer inflation supports that view.
Thanks Scott, great analysis as always. Given the pending decline in inflation, shouldn't the Fed stop short of raising the Fed Funds rate above the 10 year Treasury, as appears to be their current path? Said differently, isn't the inverted yield curve suggesting that the Fed's plan is too restrictive? If so, won't it be difficult for equities to rally?
To follow on George’s point and now factoring in your reply about M2/GDP (learning here).
That ratio (M2/GDP) would have to drop 22% to return to pre Covid levels (from 0.9 to 0.7). See https://fred.stlouisfed.org/graph/?g=Seib
Even you GDP at 6% growth ( is that even realistic?) it would take 3+ years, no?
Great review of the economy by Scott Grannis, whether you concur or disagree.
It does seem inflation is on a fade. True, M2 was up, but there are a lot of one-offs too, such a global oil markets, Russia invading Ukraine, and C19.
You can get a reduction in velocity/transactions and higher prices too.
US housing markets are a disaster, with rents through the roof--not due to the Fed, but property zoning.
So far, wages are not driving prices higher. No cost push.
I will say it again: American corporations can make even more money in an inflationary environment. Relative debt loads can shrink.
Recession?...always a bad idea.
When Larry Summers says 10% unemployment is necessary to beat inflation....ugh.
Thanks for the informative thoughts and for your follow-up comments.
So with the GDP numbers out today, we've had two negative quarters of growth. Your points on this being a bit messy to define as a recession are well taken, but given the high inflation #'s pushing the GDP numbers up (right?) wouldn't real GDP as felt by us citizens be more negative, or at least more painful than the official #'s show?
Also, while I take a lot of optimism from your M2 analysis, my sense is that we can "talk ourselves into" a recession pretty easily even if the fundamentals aren't technically leading us there.
It looks like the long term impacts of the "neo-liberal" (I believe that's the term) economic plan:
1. increase GDP "at all costs"- e.g. "free"-trade, off-shore capital and labor for lower costs
2. KNOWN impact: working folks get poorer in domestic (developed, e.g. US) economies
3. use the big GDP to provide welfare via big govt spending to the now poorer working folks (in the US)
4. (not to be spoken): subsidize green/env activities/businesses
This is a ridiculous plan for many reasons:
a. undermines social/econo/political contract with the vast number of citizens: working people
-unemployment, mental illness, drug abuse, crime...
b. does not recognize the supply constraints that 1-4 cause
The elites really believe the economy is a bunch of electronic (tech company) bookkeeping/financial entries supported by the dirty industries and working peasants below.
So, with the help of a pandemic, we have problems with the supply in the economy (=real economy strikes back!)
Over-sized "tech"/retail companies will start the layoffs for the first time in a long time: Amazon, Facebook, etc. Overstaffed thinking the pandemic accelerated the end of the real economy. Not so fast...
How far this spills over into unemployment in the rest of the job market is the big question.
O/N RRPs represent a subtraction in reserves and the money stock. But it is not recognized by the FED’s Ph.Ds. The FRB-NY’s trading desk does not record the volume of bank vs. nonbank purchases. So, there’s a colossal error in the money stock figures. The O/N RRP facility is primarily used by the nonbanks (draining the money stock). So, the FED’s operations are not transparent.
The distributed lag effect of money flows, the volume and velocity of money, is 24mo. Therefore, you can't expect inflation to subside until Nov. this year.
The annualised growth rate of bank credit, since the invasion of Ukraine, is the highest level of annual growth recorded, apart from the forced lending associated with emergency measures in 2020, in 14 years. Powell’s failure to contain the growth in bank credit will eventually produce the rise in the growth of the money supply which will confirm his failure also to contain inflation. Until that time the focus is on the apparent end of the growth of M2 in 2022 and the likely disinflationary impact. However, the normal lag between the creation of money and a rise in the CPI is at least 18 months so there is plenty of monetary fuel to keep the rate of inflation more elevated than the recent rate of M2 growth would suggest. The 2022 hiatus in board money growth can have disinflationary impacts sometime in 2023 but by then, given the continued surge in bank credit growth, it is likely that investors will be focused on the institutional failure to control bank credit and thus the supply of money.
Post a Comment