


The growth of the M2 money supply has slowed in recent months (thank goodness!), and today's FOMC announcement was less aggressive than the market had feared. Stocks surged in a sigh of relief. As I said last February, Fed tightening is not a near-term threat. Regardless, I still think the Fed and the bond market are behind the curve. And as I point out in this post, the level of M2 is still full of inflationary potential.
Chart #1

Chart #1 shows the 6-month annualized growth of the M2 money supply as of the end of the first quarter. After registering double-digit growth rates for the past two years—an astonishing development without precedent in U.S. history—M2 growth has slowed to an 8% annual rate over the past six months, and a 6.2% rate over the past three months. For reference, M2 growth averaged about 6% a year from 1995 through early 2020. So, with growth rates back to "normal" is this a reason to cheer? Hardly. If growth hadn't slowed, that would have been very disturbing; as it is, the cumulative growth of M2 is still mind-boggling and very likely to fuel uncomfortably high inflation for the foreseeable future.
Chart #2

Chart #2 shows the level of M2 plotted against its 6% per annum long-term trend rate of growth, using a logarithmic y-axis so that a straight line on the chart represents a constant rate of growth. This chart, which I have been featuring for many months, tells an astounding story that is still almost completely overlooked by most economic and financial market observers. Among the numerous articles on the subject of inflation, you'll find that fewer than one in ten even mention the money supply. To my knowledge there are only a handful of reputable economists that see it they way I do: Steve Hanke, John Cochrane, Brian Wesbury, Ed Yardeni, and Bill Dudley.
A few things to note in the chart: M2 is now about $4.8 trillion larger than it would have been with a continuation of 6% annual growth. Put another way, M2 today is running about 28% above trend, which equates to more than four years of normal growth. If you were to have asked any monetarist back in 1995 about the consequences of such a rate of M2 growth, they would undoubtedly have said your question was too preposterous to even consider. Regardless, this chart provides all the evidence one needs to explain why inflation in the past year has far surpassed expectations—and is likely to continue to do so.
Chart #3
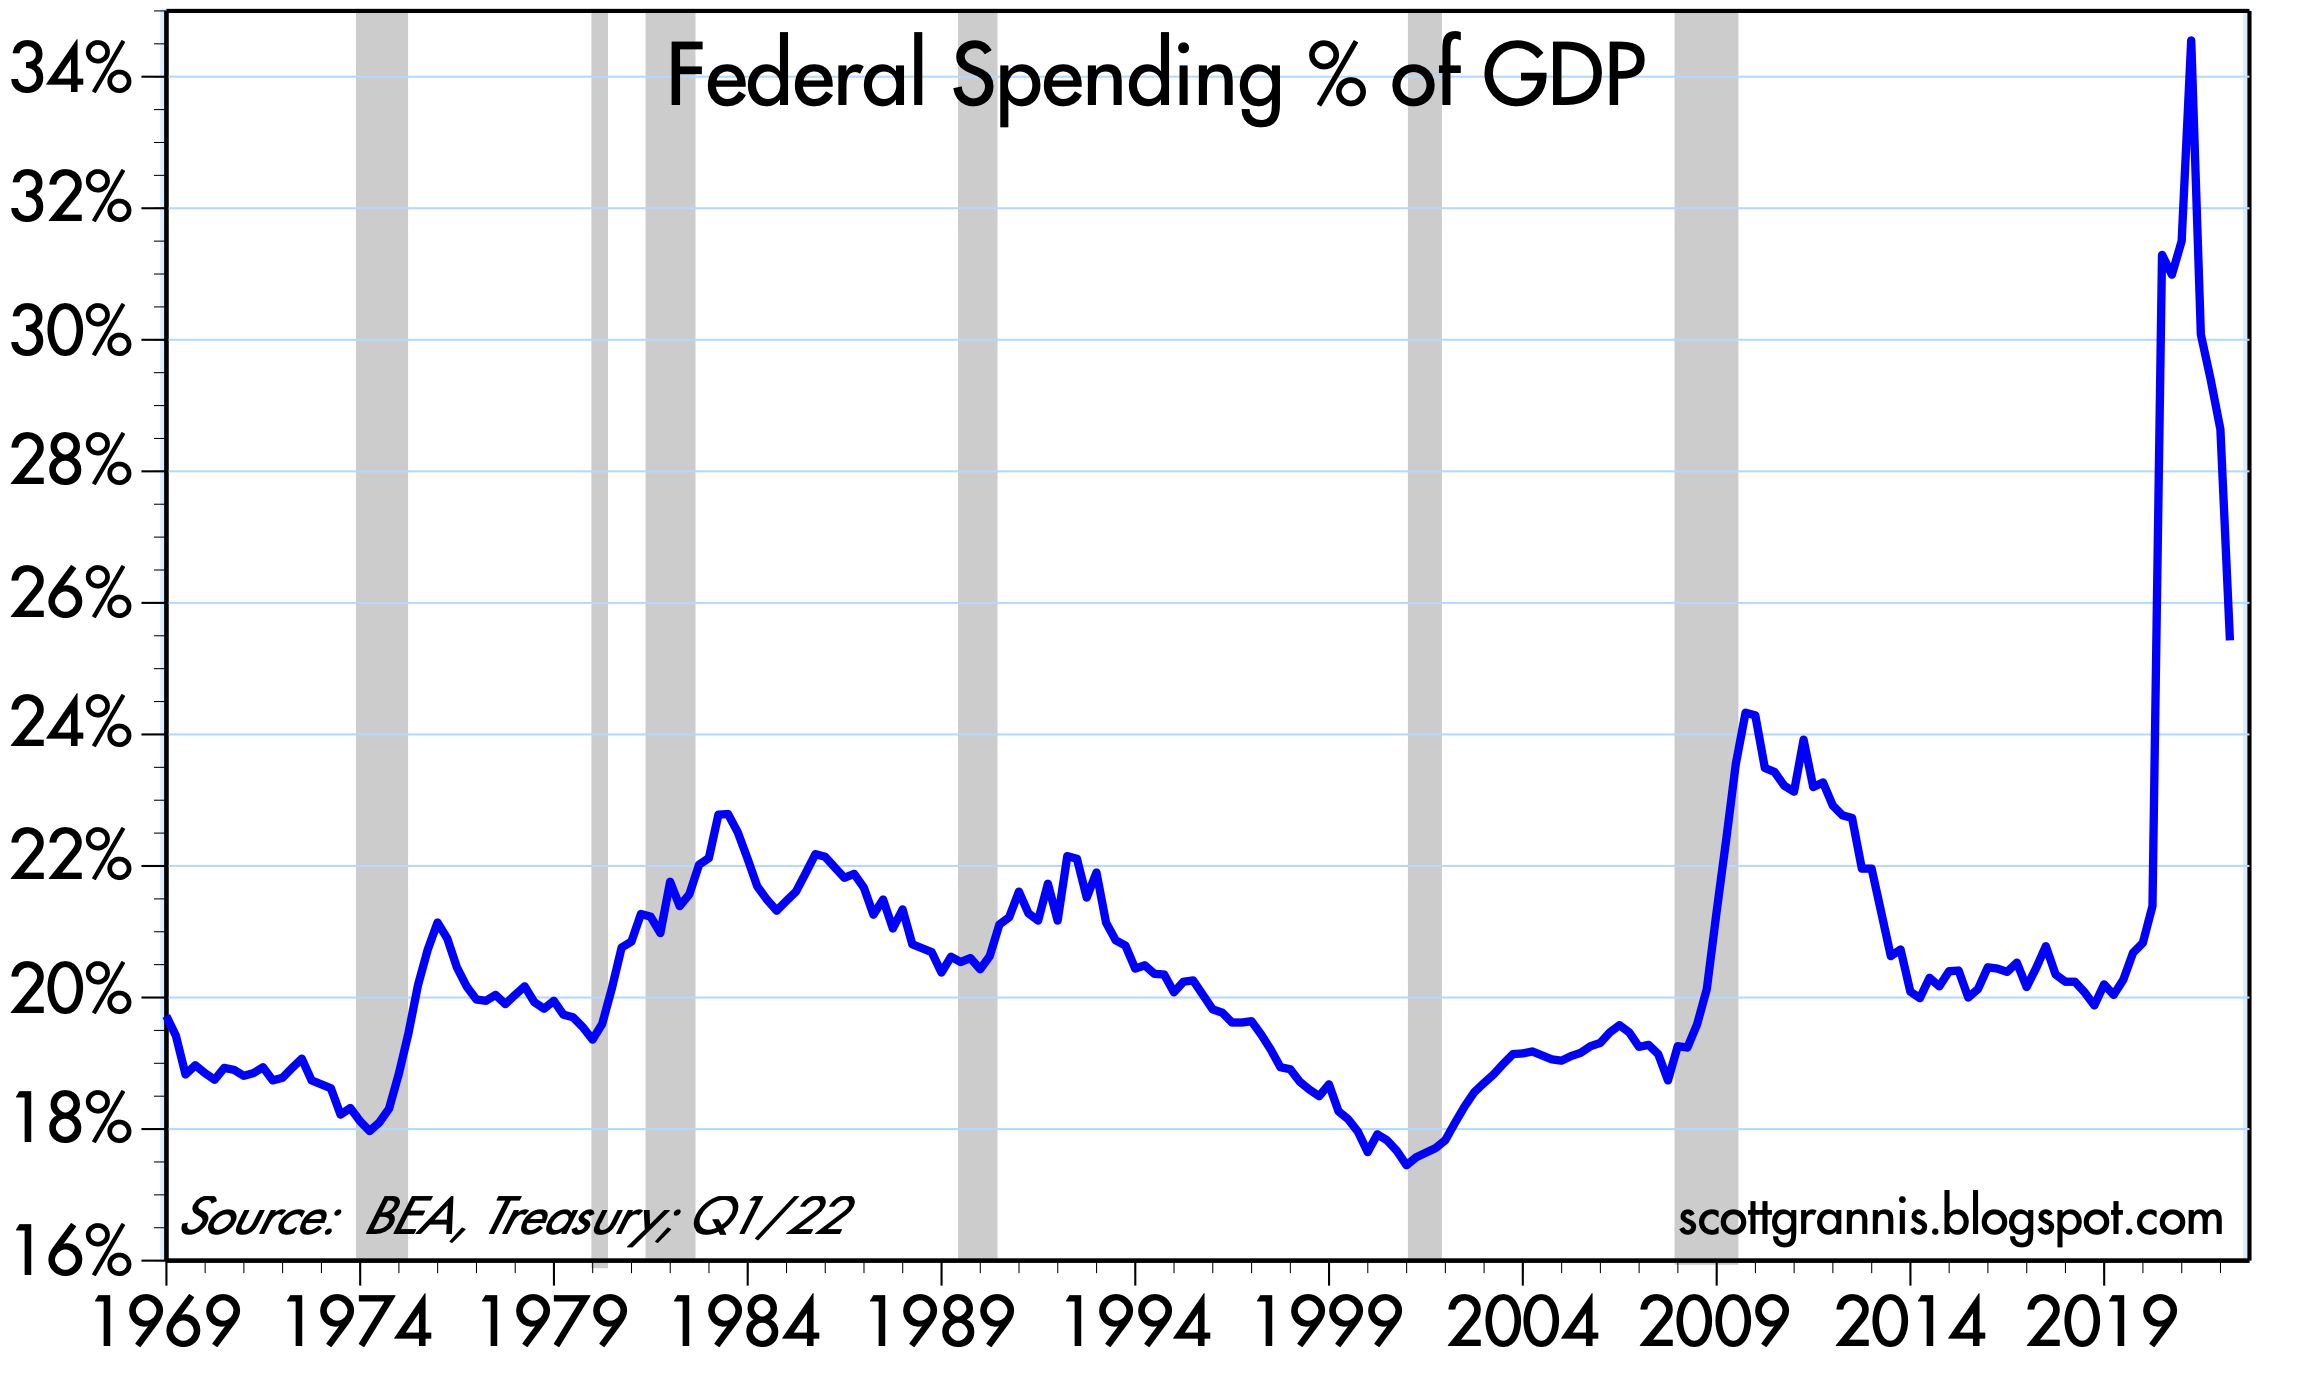
Chart #4
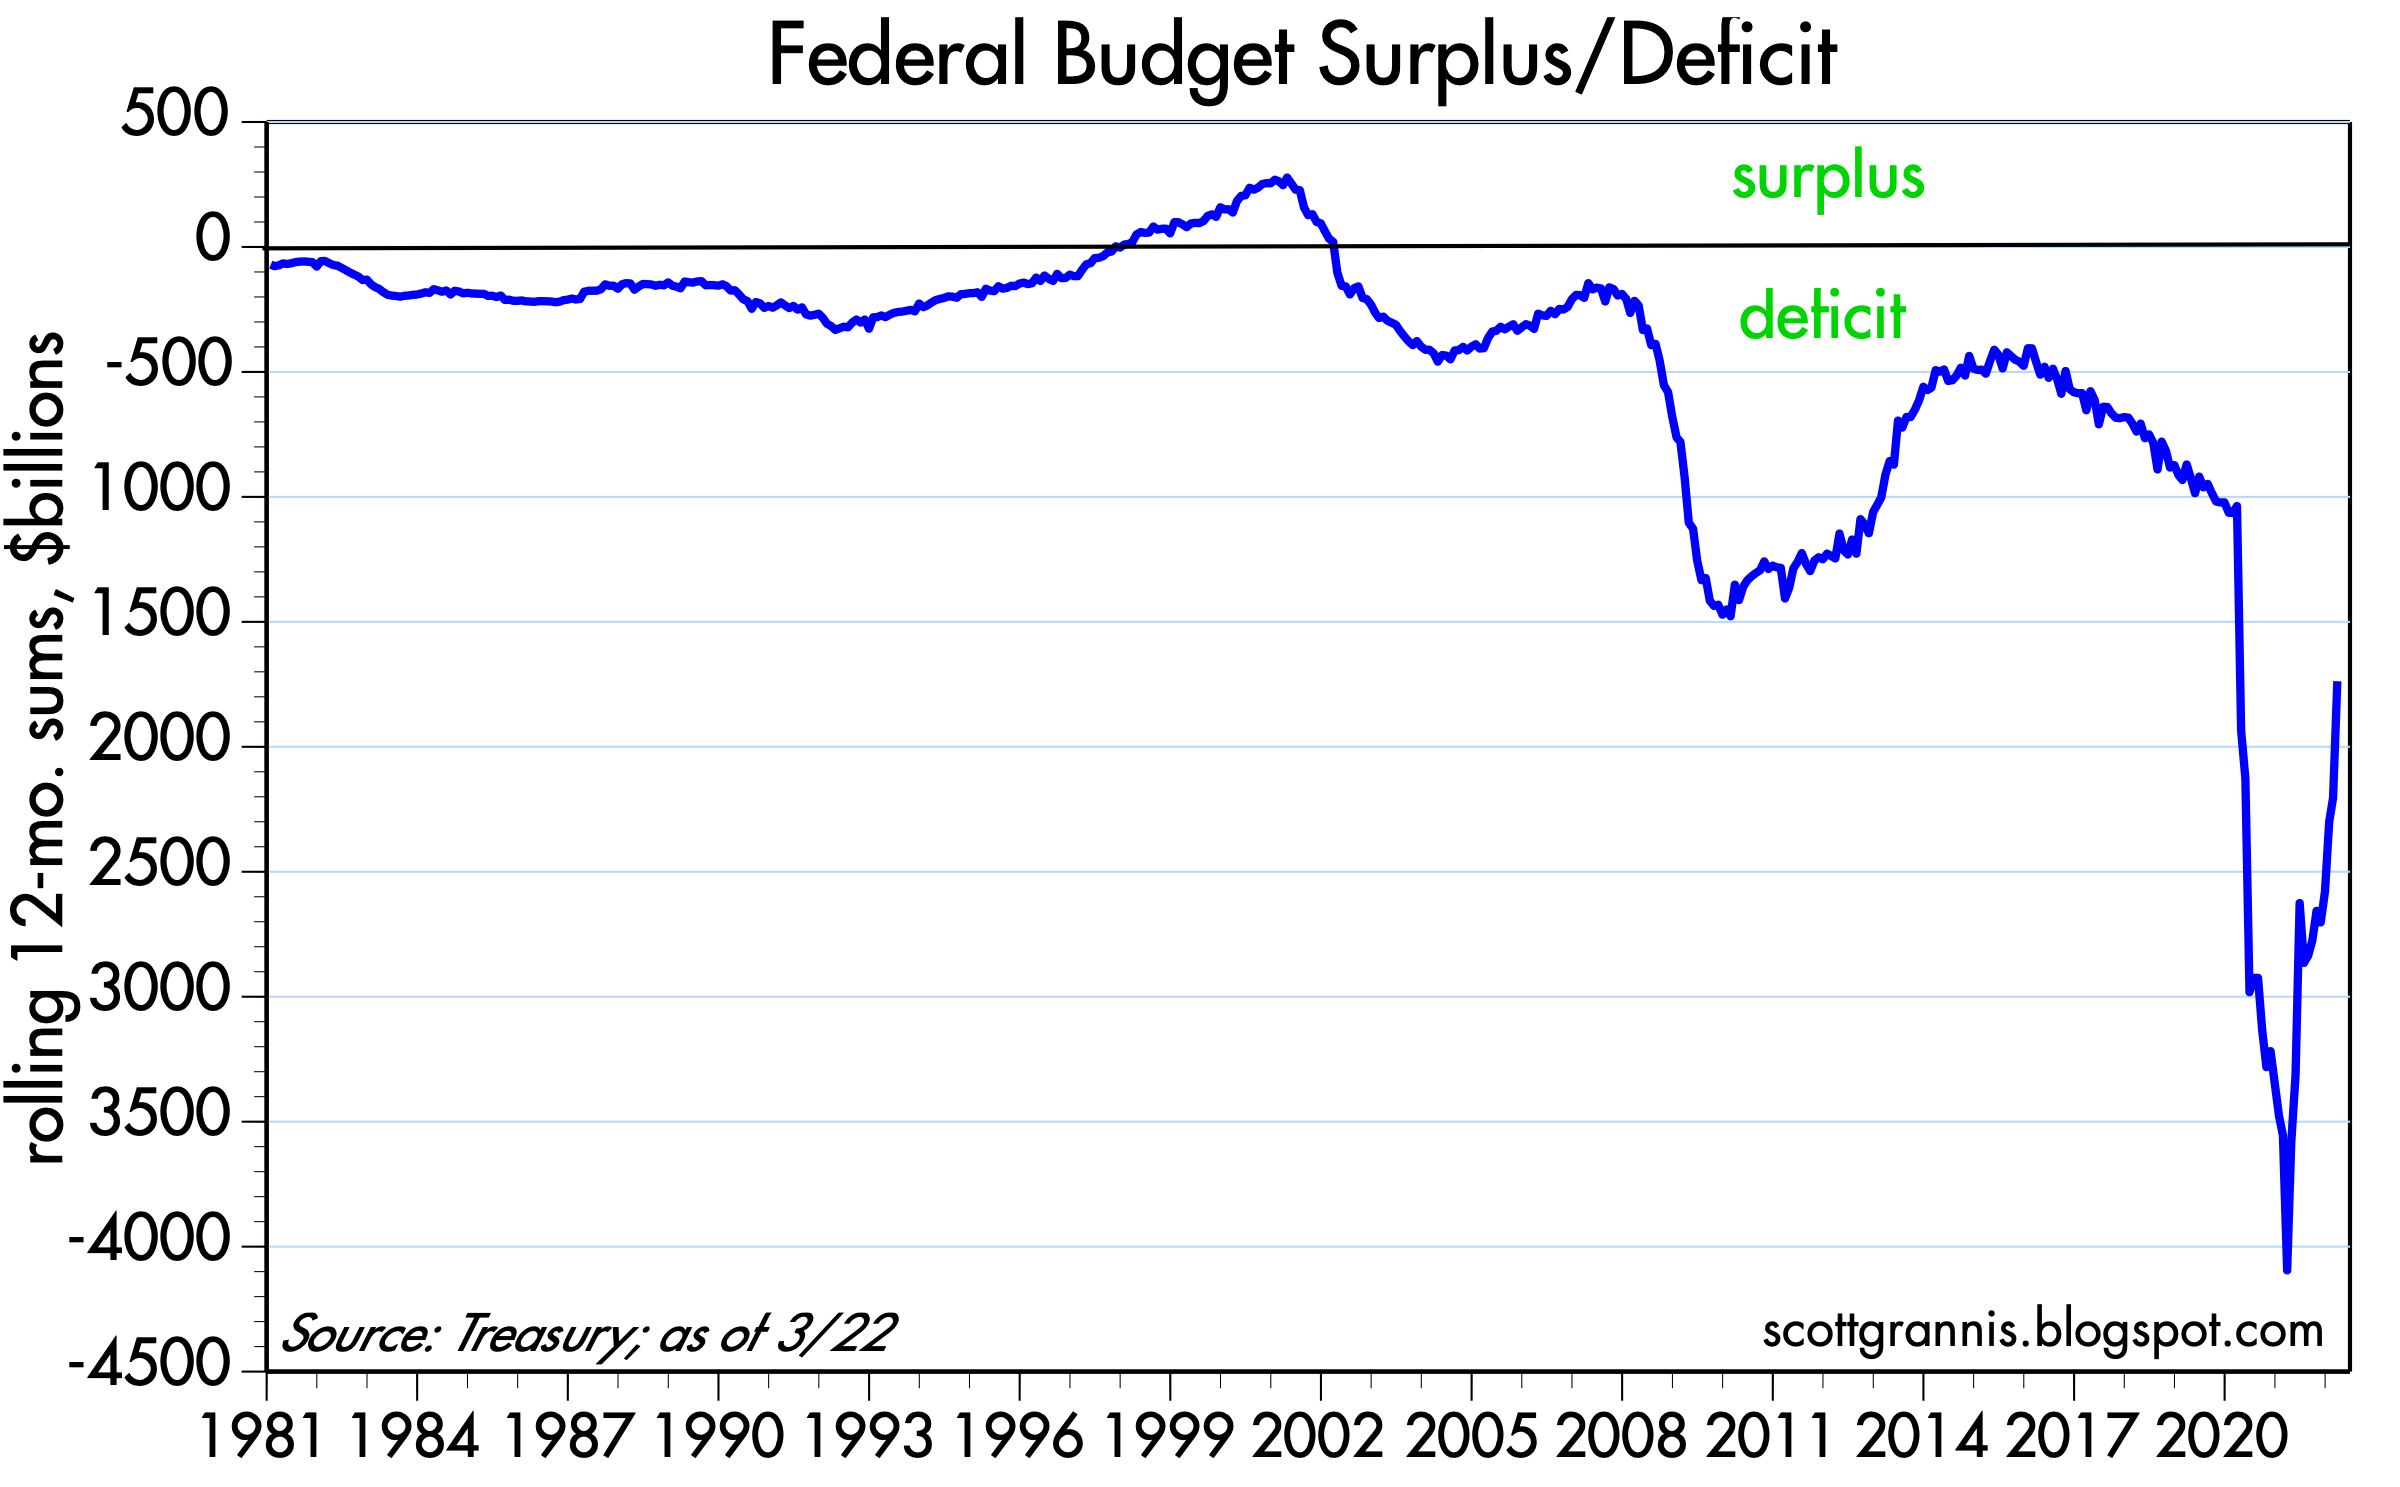
Arguably, both the 2020 surge and the recent slowdown in M2 growth had a lot to do with huge swings in government spending, as shown in Chart #3. The surge in spending was all about Covid relief and "stimulus," and it was entirely financed by issuing new debt, most of which was effectively monetized by the banking system. Fortunately, the government is no longer flooding the economy with relief checks, and Biden's absurd "Build Back Better" initiative is dead, so there is unlikely to be much more monetization. Meanwhile, tax revenues are soaring: federal revenues in the past 12 months are up 27% from the year-ago period, with the result that the deficit has collapsed (Chart #4). The rolling 12-month federal deficit was $1.04 trillion just before Covid; it peaked at $4.1 trillion one year ago, and has since fallen to $1.74 trillion. It's good that the spending and printing spree has subsided, but the legacy of debt and monetary expansion is still with us.
Chart #5

Chart #5 shows the demand for M2, which technically is referred to as the inverse of M2 velocity. (See this post from last January for a more detailed explanation.) Money demand (M2/GDP) is a decent proxy for the percent of the average person's annual income that he or she wants to hold in the form of cash, checking and savings accounts (which together comprise M2, the sum of all readily-spendable money). For many years the country's currency and bank deposit holdings were 55-60% of annual income. Yet now they are a staggering 90%. Money demand typically rises during times of turmoil, and this was quite obvious in the wake of the Great Recession of 2007-2009. It was even more so in the wake of the disastrous Covid lockdowns. It's only natural that people should want to stockpile money in times of great uncertainty.
But now that things are getting back to normal and the economy has largely recovered from the disastrous Covid lockdowns and restrictions, we are likely to see a decline in money demand. And indeed there has already been a decline of about 4% since the initial surge in Q2/21. On the margin, people are no longer desirous of holding so much money, so they are trying to spend down their money balances, and that is what is fueling the resurgence of consumer demand. For more details, see my post from last year: "Argentine inflation lessons for the U.S."
There are two ways for M2/GDP to decline: 1) slower M2 growth and/or 2) faster nominal GDP growth, which almost certainly entails higher inflation (because nominal GDP has two components: real growth and inflation, and real growth is unlikely to increase by more than 2 or 3% per year). If the Fed stays behind the curve (i.e., by not raising rates enough), then higher inflation will work to reduce the ratio of M2 to GDP.
Today the FOMC announced plans to shrink its balance sheet starting next month, but they are not very aggressive, and will be accomplished mainly by not reinvesting maturing securities. Outright sales of securities, when they do occur, won't be large and should be easily digested by the bond market. The Fed also announced a 50 bps rise in short-term rates (the overnight funds rate is now 1%) and plans to raise rates in 25 and 50 bps increments in a cautious fashion. The bond market currently expects the funds rate to top out around 3¼ - 3½% in a year or so. All told, rate hikes will be quite modest as will the reduction of the Fed's balance sheet. Will that do the trick? We'll have to wait and see, but the Fed is still far from taking aggressive steps to curtail M2 growth and/or to shore up money demand.
Interesting math exercise: Suppose M2 continues to grow at 6% per year, the public reduces its money balances to the pre-Covid level of 70% of GDP over the next three years, and real GDP grows by 2% per year. What would the annualized inflation rate be for the next three years? Answer: about 10%. That gives you an idea of the inflationary potential of the current level and growth rate of M2.

26 comments:
Another great post by Scott Grannis. Chart #1 is fascinating...well, all the charts are.
Maybe we see 10% inflation for a few years. Something tells me we will see inflation in the 5% range for several years.
The PCE core has leveled out in the low 5% range. I understand M2 is at the heart of inflation, but nevertheless, as measured, inflation does reflect oil, chronic housing shortages, supply snags, war, and many other costs associated with government bungling regarding the recent pandemic.
(Mainland China appears to want to outdo the US in exaggerated responses to a now mostly benign virus.)
I wonder if the Federal Reserve should reduce its balance sheet at all, and the connection between reducing the balance sheet and consumer price inflation must be dubious at best.
In a world with more than $400 trillion in assets, that is stocks, bonds and property, selling a few trillion in treasuries would be small potatoes, but will help to re-leverage up the US taxpayer.
The Bank of Japan holds a balance sheet equal to 100% of that nation's GDP and they have struggled for decades with minor deflation.
Well, interesting times ahead. We can at least hope for better outcomes in Ukraine, on global oil markets, and in government responses to a fading pandemic.
For investors, remember that publicly held companies are better run than ever, by lots of smart people. Do not be surprised if higher inflation shows up in higher bottom lines.
Great post Scott! Love the M2 charts! In regards to inflation, what do you think we happen in Europe. Inflation is soaring there, yet the ECB has no real plans to raise interest rates. Do you think the US fed raising rates will slow inflation in Europe or do you think inflation will continue to march higher over there? TY
al pacino, Re inflation in Europe: As I noted in an earlier post, it looks like all central banks are behind the curve. Commodity prices are up in every currency. Pretty much every country is suffering from rising inflation as the result of "stimulus" policies implemented to try to counter the disastrous impact of Covid shutdowns. It's one mistake piled on top of another. Central banks, including the Fed, are afraid to be tight and predisposed to be easy. That's a recipe for more inflation.
Scott - Thanks for the post. It's interesting that after a dovish announcement that the probabilities for higher than 3% Fed funds rate by Dec 2022 has actually increased. Based on futures pricing, at least https://www.cmegroup.com/trading/interest-rates/countdown-to-fomc.html Is this the market's way of saying you can be more dovish now but that only means you have to be even more aggressive later? The equity and bond markets seem to be saying that today also? Your thoughts?
A Clark, re market's reaction to the Fed's announcement: My read of market action as of today (May 5) is that it's difficult to draw a conclusion. Expectations for the future fed funds rate haven't changed very much at all. The Treasury yield curve has steepened noticeably, which would suggest that the market thinks a dovish Fed today means higher rates in years to come. However, inflation expectations only increased by a few basis points (based on TIPS breakevens). Credit spreads have increased, but only by a few bps. The stock market surged yesterday following the announcement but collapsed today to levels below yesterday's open. Commodity prices are up marginally, and gold is actually down a bit. Bitcoin has been pounded, however, down a whopping 10% today.
Speaking of Bitcoin, it is the one thing I worry a lot about. A big downdraft in Bitcoin prices could wipe out a lot of paper "wealth" and potentially trigger a wave of defaults. Bitcoin has been the "beneficiary" of massive amounts of speculative capital and that makes it very fragile. The 35,000 level appears to be significant, and it is just around the corner. Maybe the prospect of higher interest rates on dollar holdings is eroding demand for Bitcoin, which costs real money to hold and transact.
In any event, I struggle to see a consistent theme in all this.
In the late 1970’s, a surge in money was associated with a subsequent surge in the transactions’ velocity of funds. That appears to be the case in 2022.
Vi is a “residual calculation – not a real physical observable and measurable statistic.” I.e., income velocity, Vi, is endogenously derived and therefore contrived (N-gDp divided by M).
Income velocity has moved in the opposite direction as the transaction’s velocity of money, as in 1978, where all economist’s forecasts for inflation were drastically wrong. Income velocity ("money demand") falls as the relative proportion and volume of savings increases in the payment’s system.
You would have to segregate and weight the various aggregates, like the Divisia Monetary Aggregates Index does, in order to determine monies impact. Center for Financial Stability (CFS)
Hello Scott,
I had sell out today after 10% loss. Should have gotten out when you raised the alarm. Looks like we are going to give up all the gains and some more when this downturn is all said and done.
Job losses have not even started yet and can you imagine what will happen when they start. I was a young guy in the 2000-2003 sell off and it was not fun. I don't want to relive that disaster. I better be in cash until the dust settles.
Thanks a lot for everything you do, I really appreciate it.
Q1 unit labor costs came out yesterday and they were not good. Up 11.2% yoy. Labor output down 7.5% yoy. I find this hard to believe but that's what the numbers say.
Wages are falling behind inflation.
https://www.bls.gov/news.release/prod2.nr0.htm
So, American workers are absorbing real wage decreases, while people are getting checks from the government for doing nothing.
Others say the US needs more immigrant labor due to labor shortages.
So during a time of "labor shortages" we have declining real wages.
Not pretty.
Scott, don`t you think that strengthening USD (capital flows to safe heaven) will ease inflation rise in coming years ? Considering that 10% inflation might not be the case.
"Q1 unit labor costs came out yesterday and they were not good. Up 11.2% yoy. Labor output down 7.5% yoy. I find this hard to believe but that's what the numbers say."
There is a lot of noise in quarter to quarter numbers but
-the recent pattern (up-down) is simply a pattern seen coming out of recessions
-the year over year number is -0.6%
-after the last 3 or 4 recessions, after the noise, productivity numbers tend to settle lower and lower
Why is that and what does it mean for inflation (ultimately)?
Bitcoin is a monetary vortex that is going to suck the lifeblood from the global monetary system and effectively create a more efficient and prosperous economy for all.
M2V = PQ = Nom GDP = Real GDP(1 + Inflation)
If M2 = money supply, 1/M2 = D = money demand
Therefore
D = M2 / Real GFP(1 + Inflation)
And; Inflation = (M2/D * Real GDP) -1 = (.06/0.7 *.02) -1 if my algebra is ok
If so, I get 3%, not 10.
Carl--Thanks for your corrections.
Yes, the picture is not so bleak.
In fact, Q1 "Manufacturing unit labor costs increased 1.8 percent from the same quarter a year ago."
https://www.bls.gov/news.release/pdf/prod2.pdf
So, within manufacturing, unit labor costs are still rising at a level below the 2% inflation target of the Fed. In manufacturing, wages not inflationary, despite all the talk about "labor shortages." This is good news.
Anyway, in my view a country with labor shortages is a happy nation.
Used car prices are coming down. House prices probably next (although housing shortages due to zoning is a serious problem). My guess is oil prices will soften (no thanks to OPEC).
And labor is not the problem.
China lockdowns are a real problem and will be inflationary. Beijing seems a bit nutty. Lockdowns are not going to beat the increasingly infectious C19 virus.
With luck, maybe we can blunder out way through the next couple years...God loves fools, drunks and the United States....
CFS Inside Money Supply for March
(Released May 2, 2022)
"The broadest measure of inside money calculated by the Center for Financial Stability, including credit cards but excluding currency and Treasuries (DM4AI-), grew by 10.6% in March 2022, on a year-over-year basis."
---30---
This is higher than pre-pandemic, but lower than the 20% rate seen in 2021. And the chart shows the trend down.
https://centerforfinancialstability.org/amfm_augmented.php
My guess is inflation starts moderating. A few years of 5% inflation is not nirvana, but not the end of the world either.
Corporate profits will do fine. A real concern is the Fed will over-tighten.
Fed's Bostic said this morning he sees 2-2.5% as neutral range, after which 25 bps moves may be more reasonable.
If that's the plan, inflation will probably go higher. The Fed just doesn't have the balls to make policy tight.
"Anyway, in my view a country with labor shortages is a happy nation."
It's a funny kind of shortage with (last monthly jobs report) 363k people leaving the workforce and with total workforce still below by 1.2M vs pre-pandemic levels (assuming no growth of potential workforce since then).
The most effective and durable way to reduce M2 growth is through deleveraging. We'll all be fine but all this extend-and-pretend will only go so far.
"We" have gone from pre-funded to pay-as-you-go to buy-now-pay-later for groceries and gas and many people now say money/credit aggregates can lose touch with underlying real economy? The pendulum does swing (it always does somehow) and the Fed is only and mostly an onlooker.
Scott, Your bitcoin comment seems to be spot on. I wonder how much damage crypto can cause considering that the cyrpto market cap is around 2% of the market cap of stocks globally?
Crytpo is the biggest bubble/Ponzi scheme the world has ever seen. https://www.bloomberg.com/news/articles/2022-05-10/sec-chief-questions-whether-crypto-exchanges-bet-against-clients
Can't wait to see how low the market goes when the FED actually starts QT.
I suspect the equity market is discovering higher interest rates as well as medium term recession, notwithstanding the current positively sloped yield curve and other positive market data Scott has provided.
I'll say one thing. The US dollar is king, way up in the last year against the yen and the euro.
The yuan is collapsing too now.
"Interesting math exercise: Suppose M2 continues to grow at 6% per year, the public reduces its money balances to the pre-Covid level of 70% of GDP over the next three years..."
Elementary math question:
If the "public" reduces its money balances, where will the money go?
Carl, re "If the "public" reduces its money balances, where will the money go?"
If M2 continues to grow, then the ratio of M2 to GDP can decline only if GDP increases at a faster rate than M2. Note that GDP here is nominal GDP, which is composed of real GDP plus inflation. Since real growth of GDP is unlikely to be faster than 2-3%, then the only way nominal GDP can grow faster than M2 is if inflation exceeds 4%. That is very likely to be the case, I believe.
So in effect, desired money balances can decline only if inflation picks up. The money doesn't really go anywhere; unwanted money balances simply fuel a rise in prices.
What about the M2 reported today,apparently was much slower,historically slower?
So what about M2?
Some say 'markets' are forward looking but dissecting M2 releases for a while has revealed that the slowdown in M2 growth started a while ago.
There's always some noise in monthly data as well as with seasonal adjustments but month-over-month, annualized M2 growth is down 4.5%.
Looking back at what had been suggested (dissecting the sources of M2 growth and looking at non seasonally adjusted M2 year-over-year), here's the developing pattern:
Dec 2020-Dec 2021: +12.5%
Jan 2021-Jan 2022: +11.7%
Feb-Feb: +10.8%
March-March: +9.9%
April-April: +8.2%
and estimate for May so far: gradually lower and possibly suddenly more so with commercial banks scaling down acquisition of government debt (unheard of so far in our this-time-is-different era).
It looks live V (call this velocity or inverse demand or whatever) is coming down and the Fed hasn't really started tightening yet.
This economy looks like puzzled bystanders watching a patient deteriorate when an attempt to wean from a ventilator is started before fundamentals are addressed.
My bet is that growth has been faltering and our so called inflation will be next to fall.
The Fed will be able to pivot and, hopefully, there will be adults in the room to restrain 'heroic' measures.
Post a Comment