


I've been covering the explosive growth of M2 for almost two years now, and I'm very happy to report that M2 is no longer exploding. In fact, its annualized growth rate over the past 3 months has fallen to a mere 1.3%, down from its all-time, year-over-year high of 26.9% in February of last year. The source of the unprecedented M2 growth now looks almost certain to have been the frenzied federal spending which followed in the wake of the Covid shutdowns. That spending was effectively monetized by the Fed and the banking system, which in turn fueled an enormous increase in demand relative to output. All transpired in line with Milton Friedman's theory: "Inflation is always and everywhere a monetary phenomenon, in the sense that it cannot occur without a more rapid increase in the quantity of money than in output."
Now, in the absence of any further Covid "stimulus" payments, and thanks to surging tax revenues (see my last post for more details), the Fed's decision to raise interest rates and shrink its balance sheet, all but ensure that there will be at least no further fuel poured on the still-raging inflation fire which was sparked about a year ago. In that sense it may be said that our current inflation episode will likely prove to be "transitory." But since we also know that inflation responds to excess money with a "long and variable lag," we are likely to see uncomfortably high inflation for at least the next year or so. How high and exactly for how long is anyone's guess at this point, but at least we can now see some light at the end of the inflation tunnel.
Not surprisingly, the bond market has figured this out. Inflation expectations have cooled in the past two months: the 5-year breakeven inflation rate embodied in the TIPS market has dropped from a high of 3.7% to now 2.9%. At the same time, the bond market has adjusted downward its expectation for the peak in the Federal funds rate. Thus the market now expects the Fed to raise its target rate to a maximum of about 3% a year or so from now, instead of 3.5% by the end of next year. To my mind this seems quite optimistic. But if the bond market is right then the economy is unlikely to suffer much and the equity market correction underway may be nearing an end.
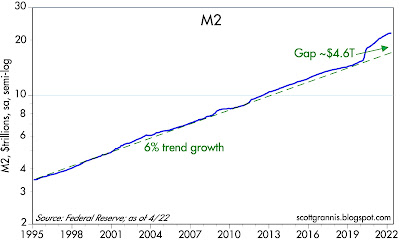
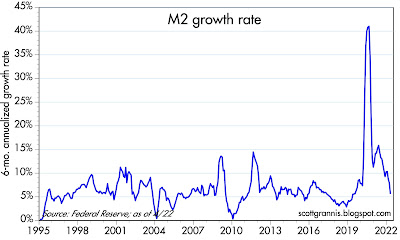
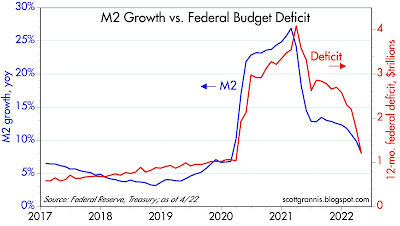
Chart #1

Chart #1 shows the level of the M2 money supply as of the end of April (data released yesterday). As growth slows relative to its long-term 6% trend, the "gap" is shrinking. But it may take at least a year or two before it disappears, so I repeat what I said earlier this month: "M2 still has a lot of inflation potential."
Chart #2

Chart #2 shows the year over year growth rate of M2. As noted above, M2 has hardly grown at all for the past three months, and the budget deficit is very likely to continue shrinking, so the year over year rate is almost certain to approach zero.
Chart #3

Chart #3 compares the growth of M2 to the level of the federal budget deficit. This is powerful evidence that the deficit was effectively financed by "money printing."
I hasten to add that this is arguably the first time in modern history that this has happened. Did the Fed allow this to happen? How exactly did M2 increase so explosively? Under our fractional reserve banking system, only banks can create new, spendable money; the Fed can only create bank reserves, which in turn are necessary for banks to create new money. Is Powell now being lauded for mopping up the mess he created? We don't know the full story yet, but I'm sure it will emerge.

58 comments:
Thanks again Scott, for another great article and timely analysis. Very glad there is a light at the end, as long as it is not another train coming our way. lol
Great write-up - really appreciate
With all the government programs handing out money everywhere, not surprised by this - plus it could only really go into one of goods, housing or savings. First two really ignited inflation.
re: " the Fed can only create bank reserves"
That's not true. It's just that when Powell pegs rates that causes a lot of debt monetization.
M*Vt = P*T in American Yale Professor Irving Fisher's truistic "equation of exchange". M = our means-of-payment money supply (isolating money intended for spending, from that money held as savings). Money has no significant impact on prices unless it is being exchanged. To sell 100 bushels of wheat (T) at $4 a bushel (P) requires the exchange of $400 (M) once, or $200 (Vt) twice, etc. Or a dollar bill which turns over 5 times can do the same “work” as one five-dollar bill that turns over only once.
William McChesney Martin Jr reimposed interest rate pegs causing the Great Inflation. Volcker turned the nonbanks into banks causing the S&L crisis. Greenspan dropped legal reserves by 40% causing the housing bubble. Bernanke destroyed real-estate, the nonbanks, and the home builders. Powell increased the Gini coefficient to the highest level in 50 years. Mass shootings are no happenstance.
The FED’s accountants’ error when they claim that reserves are drained, but not the money stock, during RRP operations.
If you know how to count, then you know AD and therefore N-gDp.
https://libertystreeteconomics.newyorkfed.org/2022/01/how-the-feds-overnight-reverse-repo-facility-works/
"The FED’s accountants’ error when they claim that reserves are drained, but not the money stock, during RRP operations."
It's interesting that, even at this point, it is not widely realized that reverse repo operations are effectively the opposite of quantitative easing and that both operations directly impact M2 growth (one needs to look at all sides of the balance sheet ledger).
How exactly did M2 increase so explosively? Under our fractional reserve banking system, only banks can create new, spendable money; the Fed can only create bank reserves, which in turn are necessary for banks to create new money.---SG
I am beginning to wonder about this. If the US government gives a check to a person, and the person spends the money...
Also, I wonder if it is necessary now for the Fed to sell its hoard of bonds. M2 has returned to normal already, so why bother to sell the bonds? The Bank of Japan has a much larger hoard of bonds in relation to GDP and inflation is not a problem in Japan, nor are taxpayers truly over-leveraged there.
I am not saying I am right, but it would be nice to see some sort of debate somewhere on this topic.
On the other hand I am not wrong either. The nice thing about macroeconomic debates is no one is ever wrong. I have been reading such debates for a half-century now and I think I'm more confused now than when I started.
That said, I think Scott Grannis is right on this one. Too much M2 growth.
Here is a great interview with a former BOE Governor. Cheers
https://youtu.be/B6Zb_AvxT8g
@Benjamin
Not all macro debates are sterile. For example, it could be constructively and factually argued that Salmo Trutta's assertion that Paul Volcker caused the S/L crisis is incorrect..
Of course too much M2 growth has been a primary driver because the US did too much (Japan just reported lowish inflation with the persistence of secular deflationary forces) but there were (are) also supply-constraint factors which have been (are) being dealt with.
It's key (to evaluate/guess) to dissect the components that led to increased M2. Typical main-street loans and leases' growth has remained relatively muted. The two biggest drivers of M2 growth by far have been:
-Massive and unprecedented QE which (by definition) increases M2, although the main effect is artificial asset inflation
and
-Massive increase in commercial banks' holdings (as assets) of government debt, which is effectively money creation through private banks monetizing government debt.
Remember that money flows. The government that issues debt uses cash that a private participant decided to lend to the government (instead of consuming, investing or whatever) and the money that the market participant receives from the government as a 'transfer', once spent, has to end up (essentially) in another private market participant's bank account as a deposit.
Now both major drivers of M2 growth have started a process of reversal:
https://fred.stlouisfed.org/series/TASLCBM027SBOG
How can inflation persist with simultaneous monetary and fiscal drags?
Contrary to the late 60s and 70s, an era of embedded expectations and ideas of ingrained inflation, real wages (apart from recession periods) rose significantly, a situation contrary to what we're going through now:
https://fred.stlouisfed.org/series/W875RX1#0
And let's not forget the increased income inequality between now and then which makes the recent trends (decreasing real wages for main street people) even more significant for people with higher propensities to consume (potential demand destruction; have you seen recent retailers' massive inventory build-ups?)
To answer your question….the government sent newly printed money directly to people, who spent that money.
^What is described here is 'helicopter money' which-
is defined by:
-The process whereby central banks print money that goes directly to the public (a money drop). So, the governments do not write this in their budget and government debt does not expand.
-And hasn't happened, at least yet.
Well...
On helicopter money, aka money-financed fiscal programs, economist Michale Woodford said QE in combo with federal deficits was a helicopter drop.
"Helicopter money as a policy option" Vox 2019
Hey, I am just a wag. That is what Woodford said.
Helicopter money, as Benjamin Friedman initially described (classic definition), was a theoretical one-time experiment to show the potential effect of monetary policy on inflation.
Of course now, there are soft forms of helicopter money definitions which only imply temporary or permanent fiscal expansion of central banks' balance sheets. Even Japan is adamant to say that their fiscal expansion is temporary..
The nominal GDP targeting crowd (à la Woodford) means progressively more and more command and control government economy, and (IMO) a guaranteed way to eventually get Argentina-type inflation.
Carl-
In general, I want smaller government and smaller taxes. Like eliminating HUD, the Ed. department, VA, USDA, Commerce and cutting military outlays in half.
But, I am a fan of helicopter drops executed by cutting payroll taxes, and making up the deficit by having the Fed buys US Treasuries and placing them into the Social Security fund.
Right now, we have this clunky system of the Federal Reserve, and it boosts bank reserves, or maybe the banks already have reserves (like now), so the Fed cuts interest rates, and buys MBS, or US Treasuries, and hopes banks lend money...to who?
Who gets the new money? Homebuyers and commercial property buyers(meaning home-sellers and property-sellers)and a smaller portion to operating businesses. The operating businesses are encumbered by the new loans.
This is called goosing the economy by giving lots of money to property sellers, and some, but on terms, to operating businesses.
A SS tax cut gives money to workers and employers. The productive people who make the economy work.
The Fed and (especially) the commercial banks like having a monopoly on new money creation. It is presented as a divine arrangement, and any other is unthinkable.
Now, I am no longer sure. Just my two cents.
^Fundamentally, i have a hard time understanding why one would support monetary operations to sustain fiscal actions based on (unrecognized) debt in order to deal with capitalism woes.
---
i follow Bill Mitchell (leading MMT proponent). He seems to have difficulty recognizing (IMO) the fact that recent MMT-like (soft definition of helicopter money) US policies have played a critical part in rising inflation. Instead of recognizing this aspect, he suggests (to correct the inflation consequences) that 'workers' should be rewarded with extra subsidies or transfers (equivalent of your proposed payroll tax 'holiday'). But then who decides the amount of transfer? the duration? who is productive?
---
Are you saying there is a free lunch somewhere that hasn't been appreciated in the last centuries?
I think it would surprise a lot of people to know that the ten year breakeven is at a three month low and is at the same level it was a year ago.
The S&L crisis was predicted in May 1980 (after the DIDMCA). The Keynesian economists had achieved their objective, that there is no difference between money and liquid assets.
LSAPs will increase the money stock if the seller is a nonbank (like 90% of all O/N RRPs)
The problem is separating supply-chain shortages with demand-side pressures. Some of the supply-side shocks which were previously cyclical, are now secular (structural). The distributed lag effect of monetary flows, the volume and velocity of money, have been mathematical constants for > 100 years, not "long and variable" as Friedman pontificated.
Powell is an idiot: “The connection between monetary aggregates and either growth or inflation was very strong for a long, long time, which ended about 40 years ago”.
In Bernanke's new book he convicted himself: "targeting the price of money - the federal funds rate". Interest is the price of loan funds. The price of money is the reciprocal of the price level.
As an example, look what caused the fall in housing prices, the GFC. M1 NSA money stock peaked on 12/2004 @ 1467.7. It didn’t exceed that # until 4/2008 @ 1514.2.
Dec. 2004's money #s weren't exceeded for 4 years. That is the most contractive money policy since the Great Depression. But that's not how you measure it. The lag for money flows, the proxy for inflation, is 24-months.
As soon as Bernanke was appointed to the Chairman of the Federal Reserve, he immediately initiated, his first "contractionary" money policy for 29 contiguous months (coinciding both with the end of the housing bubble, and the peak in the Case-Shiller's National Housing Index in the 2nd qtr. of 2006 @ 189.93), or at first, sufficient to wring inflation out of the economy, but persisting until the economy plunged into an economic wide depression). I.e., the drop in housing prices coincided with the monetary lag.
For > a 2 year period, RoC’s in M*Vt (using required reserves which are driven by payments), proxy for inflation (for speculative assets), were NEGATIVE (less than zero!).*
re: "ten year breakeven"
Read: Dr. Daniel L. Thornton, Vice President and Economic Adviser: Research Division, Federal Reserve Bank of St. Louis, Working Paper Series, “Monetary Policy: Why Money Matters and Interest Rates Don’t”
http://bit.ly/1OJ9jhU
Long-term money flows peaked in January. But the gap between short-term money flows, proxy for real output, and long-term money flows widened thereafter. But who knows? Powell eliminated the distinction between means-of-payment money and monetary savings (Regulation D, the more than six withdrawals or transfers per month out of your savings account).
If you look at the money stock, as opposed to the FOMC's administered rates, you'll discover that Alan Greenspan never tightened monetary policy (i.e., despite 14 raises in the FFR (June 30, 2004 until January 31, 2006), - every single rate hike was “behind the inflationary curve”, behind RoC’s in long-term money flows).
And Bernanke never eased monetary policy despite the FOMC's 7 reductions in the target FFR (which began on 9/18/07 until 4/30/08).
Core PCE peaked, 5.3% at the same time long-term money flows peaked, now 4.7%. You can lead a horse to water but can't make it drink.
Salmo:
I am seeing pce core at 4.9% yoy April.
https://www.bea.gov/data/personal-consumption-expenditures-price-index-excluding-food-and-energy
The orthodox macroeconomists are calling this runaway and catastrophic inflation. The rate has actually cooled in the last few months.
I am old enough to remember the 1980s when the Wall Street Journal editorialized that any rate of inflation under 5% was good enough and that was when Volcker was Volcker and Reagan was Reagan.
I am no fan of 5% inflation, though I think anything under 3% is good enough.
I do not like mounting debts upon the US taxpayer.
Yeah, Volcker's reign was a myth. Monetarism has never been tried.
I have a dream
That the Fed loses discretion
And ability for ‘fine-tuning’ actions
And aggregate demand manipulations
That end up in balance sheet expansion.
More debt, more money, huge mistake,
Unhinged from real economic activity,
Unintended consequences, plenty.
Then what will it take?
Personal Saving Rate (PSAVERT) | FRED | St. Louis Fed (stlouisfed.org)
As a result of previous actions, there has been a Fed put and now there’s a Treasury put.
So un-American?
What will it take?
Scott, Can you please revisit OER in ration to percentage of CPI (in 2022?) and see where we are at?
Re OER and the CPI: Owners' Equivalent Rent is up 4.8% in the 12 months ending April '22. OER currently accounts for 25-30% of the CPI, and it is rising. Typically it takes rising home prices 12-18 months before they show up in OER. Home prices started accelerating about 2 years ago; national home prices are up almost 40% in the past two years, and they rose over 20% in the 12 months ended March '22. I think this points to OER contributing significantly to CPI inflation for at least the next year, if not for longer.
Don't know Scott, was going to write something about White House determining the direction of the FED, but then I read the other comments.
Also how did you get the M-2 money numbers since its a discontinued data? Did you rebuild it?
I am just currious
M2 has not been discontinued. But M2 used to come out every week, and now it only comes out once a month, on the fourth Tuesday of the following month.
"Over the past 12 months, average hourly earnings have increased by 5.2 percent." --BLS report, on Friday.
This is actually cooling off a bit.
Unfortunately, the productivity figures are not good, although I suspect there is more than the usual friction in the numbers, due to the whole C19 thing.
Still, even modest gains in productivity would mean wages are not the source of inflation.
But Larry Summers is shrieking we need to cool off labor markets.....
Not decontrol of property markets?
Powell destroyed the deposit classifications, but contrary to Bernanke, money and inflation have always been connected. The rate-of-change in the demand deposit time series bottomed in the first qtr. of 2020 and peaked in the first qtr. of 2022 (coinciding with the Fed’s preferred inflation gauge, Core PCE ).
Targeting N-gDp is a sound proposition – but politically unpalpable. First, there is too much noise in the data leading up to a final product figure – that makes a futures market untradeable. Second, the FED couldn’t hit a N-gDp target with any consistency, leading to a crisis of confidence. The FED can only hit a short-term interest rate target, which should be the free market’s job.
The stock market is in a permanent bear market, in spite of any bear market rally. The inelasticity of demand for gas will cause a recession in other products normally purchased. The economic oracles may seem convincing, but if they actually understood economics, they’d be trading futures.
" too much noise in the data leading up to a final product figure"- I read an evaluation of Fed predictions of several variables- inflation, interest rates, maybe GDP. It was focused on their 1 year predictions, and the average miss was 37%. Is economics really a science? (rhetorical question)- there are hundreds or thousands of PhD economists working at the Fed...
"inelasticity of demand for gas will cause a recession in other products normally purchased"- right. I think this is where the "inflation is always a monetary phenomenon" argument gets confused. You can have an "inflation problem" (in one important industry/product/sector) and maybe not have a "total price index" inflation.
The covid adventure made the 2019 "financial crisis" fade away.
Something similar seems inevitable.:
https://en.wikipedia.org/wiki/September_2019_events_in_the_U.S._repo_market
Helicopter money would not be driven by monetary policies, it would be by fiscal policies.
I've mentioned this many times in the past and been discounted by Scott, who I trust most for economic insight and have been reading for well over ten years by now.
Treasury and FED in concert injected money, M2, directly into the bank accounts of consumers in the form of stimulus payments, FED unemployment subsidies, child tax credits and more.
It seems obvious this circumvented traditional fractional reserve banking money supply expansion.
In effect, average wages were up due to FED unemployment subsidies in addition to state unemployment, stimulus payments, child tax credits, etc. A wage price spiral inflation.
Re helicopter money: Before the Covid-era fiscal "stimulus" payments, deficit spending was never a source of inflation. Treasury borrowed money from the public in order to pay its bills, so there was no monetary expansion involved. But in the past two years, it all changed. I still don't know how exactly it happened, but it's pretty clear that the money supply increased at an enormous pace and coincident with a massive increase in deficit spending. So the Fed and Treasury (and effectively the politicians who voted for all the massive spending bills) are complicit in this unprecedented money printing episode. It's been a real lesson in how smart Milton Friedman was. A laboratory case study in how monetary expansion leads to higher inflation.
These are our leaders: ""Bernanke: “a flawed and over-simplified monetarist doctrine that posits a direct relationship between the money supply and prices". Powell: “The connection between monetary aggregates and either growth or inflation was very strong for a long, long time, which ended about 40 years ago”.
There is no “Fool in the Shower”. Contrary to economic theory, & Nobel laureate, Dr. Milton Friedman and Anna J. Swartz (“Money and Business Cycles”), monetary lags are not “long & variable” (A Monetary History of the United States, 1867–1960, published in 1963). The lags for money flows, the volume and velocity of money, have been mathematical constants for > 100 years.
Inflation, Economists, Yellen-
Yellen is writing a bio- and evidently changing her story/throwing Biden under the bus:
https://www.bloomberg.com/news/articles/2022-06-04/yellen-wanted-biden-relief-plan-cut-by-a-third-biographer-says#xj4y7vzkg
Remember when she and the other parrots said that more stimulus/govt spending would cause inflation to go down?!
Another great Yellen moment is when she basically participated in the groupthink prior to the 2008 debacle, saying that the banking/shadow banking system problems were not big enough to cause systemic economic problems. Better to fail as a group than alone, as they say.
I get the feeling that her fumbling the messaging on inflation will cause a departure from the administration within a few months.
I honestly never understood the supposed enormous intellects of Greenspan, Bernanke, Yellen. I did look up her bio and her notes (while a student) in econ classes were so detailed that they called them the "Yellen" textbook. When I was in academia, we had a name for very hard workers that were not the most clever: "Plodding A's".
"deficit spending was never a source of inflation."
How can you make that conclusion? Isn't it possible that the unusual levels of bipartisan deficits simply mitigated some the deflationary forces? Maybe it's different this time because it was simply too much?
M2 growth, for the last 20 years or so (never before on a sustained basis) has continuously outpaced nominal GDP growth. Why?
"I still don't know how exactly it happened"
But the numbers are in full display. Out of the 4.6T 'excess' M2:
1-total reserves at commercial banks have increased by 1.9T as a result of QE.
This does not really count for consumer inflation. It's an asset swap driving financial speculation and the Fed balance sheet expansion results in the recognition of an asset that has no influence on M2 numbers and simultaneously creates virtual dollars liabilities which end up as created dollars in M2.
https://fred.stlouisfed.org/series/TOTRESNS
2-Government debt held by commercial banks has been growing faster than general economic activity, especially since the GFC and especially+++ since March 2020 (sudden reversal...) and this explains 1.6T of the excess M2 since March 2020.
https://fred.stlouisfed.org/series/USGSEC
---) One more attempt to explain:
Let's say Scott buys a government debt contract (ie bill, note or whatever) from the Treasury, the cash moves from Scott's account and eventually, let's say, to Benjamin's account as a 'transfer'. No new money created. Just redistributed. Maybe Scott's propensity to consume is not the same as Benjamin's but there is no new money created. However, once this new government debt contract exists AND once a commercial bank buys the contract from Scott, the bank performs an asset swap (cash held as asset becomes debt held as asset) but doing so it creates a new deposit in Scott's account ie new M2 is created just like any time a bank creates money supply through the fractional reserve paradigm. Scott, who had foregone consumption (or investment etc) for example as the cash was instead directed to the Treasury, by selling the government debt contract to the bank, regains the cash. So both Scott and Benjamin end up having dollars and half of those dollars were created out of thin air.
What's the significance?
Many. But there is significance at least for how long this inflation wave will last. This very unusual process has not only slowed but has reversed (see Fred graph above). This means that the primary driver behind inflation is gone. I wonder about the lag but i would say JPM's CEO Jamie Dimon is on the right track when he recently suggested to brace for the hurricane season.
So 1- and 2- explain about 3.5T out of the 'excess' 4.6T. It's interesting to note that, for the same period, credit (real estate mortgages) can explain 80-95% (range depending of what is believed to be the appropriate trend of mortgage growth vs real underlying economic activity) of the remaining (1.1T) excess credit M2 creation. How sustainable is that?
You can have an "inflation problem" (in one important industry/product/sector) and maybe not have a "total price index" inflation.--wkevinw
Actually, I think people forget that with MV=PT, you can have inflation concurrent with large drop in velocity and transactions.
In such a scenario, a large decrease in transactions but higher prices can occur, with no monetary expansion.
There are a lot of supply constrains right now in the US, such a benefits for people who do not work, and ubiquitous property zoning.
The Fed faces a tough tightrope---it can obtain the result of low price inflation, but even lower velocity and transactions. In other words, we beat inflation by throwing people out of work (the Summers solution).
Well, of course, the US economy needs oodles of reforms, such as no taxes on productive behavior, and total un-zoning of property.
But the Fed operates in the real world. My guess is the Fed overshot a bit, and now will undershoot.
There is the troubling aspect of elite leadership in DC that always decides inflation is serious when real wages rise.
You wonder why populism is on the rise?
"There is the troubling aspect of elite leadership in DC that always decides inflation is serious when real wages rise.
You wonder why populism is on the rise?"
Real wages have not been rising..
https://www.bls.gov/news.release/realer.nr0.htm
And average numbers underestimate the squeeze on the lower 60%+ because of the high CPI-essentials, growing inequality, disappearing temporary and marginal leverage that low-pay Americans 'enjoyed' for a very short time and disappearing 'benefits'.
It is said that the populace don't see the connection between the present inflation and government deficits. They will.
Carl: re bank reserves and M2. Bank reserves are not part of M2. Banks acquire reserves by selling Treasuries and MBS to the Fed, and banks typically acquire Treasuries and MBS by purchasing them from the public with the proceeds of deposit inflows. M2 only grows as bank deposits and checking accounts grow, and as currency grows (currency is issued only on demand from the public so it is never inflationary).
Bank reserves indeed rose significantly in the wake of Covid stimulus spending, but reserves also rose in the wake of quantitative easing from 2008 through 2013. Yet that period of reserve expansion did not spark any meaningful increase in M2.
The big increase in M2 that occurred from 2020 through late last year can only have been fueled by an expansion of bank lending, since that is the only way that spendable money can be created in our fractional reserve banking system. The problem I have is that I can't see the evidence that the public borrowed $4.6 trillion extra from the banking system. One possibility would be that banks lent to themselves and used the proceeds to buy securities which they then sold to the Fed. But that would be highly unusual.
Regardless, I am open to suggestions to solve this mystery which I haven't seen anyone address so far.
Scott Grannis: I am just a wag and I really can't answer your question but I have a couple thoughts.
i. Michael Woodford contends that quantitative easing, in conjunction with federal deficits, is in effect a helicopter drop.
2. The world's financial markets are entirely globalized and money travels around the globe at a click of the mouse.
If we think of the global money supply, then we must consider the European Central Bank, the Bank of Japan, the People's Bank of China, the Bank of England, and perhaps a few other central banks.
Benjamin: the Fed engaged in 3 rounds of Quantitative Easing, and only the third coincided with a big Increase in M2 and a subsequent big increase in inflation. Quantitative Easing, as I have explained many times over the past 10 years, is not necessarily inflationary. Quantitative Easing in essence is simply the Fed transmogrifying bonds into T-bill equivalents. No new money is created. What happened in the past two years was something that we have never seen before.
Scott Grannis:
OK, assume huge pools of liquid capital globally. Some sort of "flight to quality" takes place.
The US may have a so-so government, but that is lot better than being exposed in a China, Russia, Latin America, Easter Europe, etc.
Canada seems to be having a version of the same thing---huge amounts of money flowing into Canadian property markets.
People who sell real estate are not required to know the seller. People who sell real estate end up with a huge boodle of money, which they deposit.
Well, it is a thought.
"Bank reserves are not part of M2"
Apologies but this is incorrect.
You need to take into account what happens simultaneously on the commercial banks' balance sheet. When the Fed buys a government debt paper, it does so essentially from a non-bank market participants. Note that, until very very recently and for many many years, commercial banks have been net buyers of government debt paper.
When the Fed virtually prints a reserve dollar, it does end up as a reserve dollar deposited at the Fed, with the new dollar being an asset for the commercial bank and a liability for for the Fed. Simultaneously (it's not controversial, it's basic math and basic reporting), as the commercial bank, as a simple intermediate, recognizes this cash as an asset, it has to 'print' a new dollar deposit in the non-bank participant's account who sold the government debt. This new private deposit, by definition, is included in M2.
There's this link where this is discussed:
https://fedguy.com/the-mechanics-of-quantitative-easing-and-m2/
see in Principles of Money Creation
This is not an alternative fact..
-----
i've followed this for more than 20 years and, post GFC, QE has contributed to M2 in a basic math kind of way. In 2020, the math still applies. There is no trick. The combination of acute QE and corporations drawing credit lines (also M2 'creation') mathematically explain the quasi-vertical rise in M2.
re: "only the third coincided with a big Increase in M2"
Banks don't lend deposits. Deposits are the result of lending. All bank-held savings are lost to both consumption and investment, indeed to any type of payment or expenditure. They are frozen.
Every time a commercial bank buys securities from, or makes loans to, the non-bank public, it simultaneously creates an equal volume of new money, demand deposits, somewhere in the payment’s system. From the standpoint of the system, the banks pay for their earning assets with new money, not existing deposits.
The GFC spawned a "flight to safety". And it was encouraged by the FDIC raising deposit insurance to unlimited from $100,000. The reduction to $250,000 released savings. That's what caused the "Taper Tantrum". That's what dropped the unemployment rate from 8.0% to 5.0% by Dec. 2015.
It's stock vs. flow. Secular stagnation is the impoundment of savings in the payment's system.
Income velocity falls as the proportion and volume of savings increases in the payment’s system.
Professor emeritus Pritchard, Ph.D. Chicago 1933, MS Statistics Syracuse, never minced his words, and in May 1980 pontificated that:
“The Depository Institutions Monetary Control Act will have a pronounced effect in reducing money velocity” -- because economists don't know a debit from a credit.
https://fred.stlouisfed.org/series/SAVINGNS
see: “Commercial Banks and Financial Intermediaries: Fallacies and Policy Implications–A Comment Leland J. Pritchard Journal of Political Economy
Vol. 68, No. 5 (Oct., 1960), pp. 518-522
“The case against commercial bank saving accounts”
Leland James Pritchard 1964 Banker’s magazine
“The economics of the commercial bank : savings-investment process in the United States” Leland James Pritchard 1969
“Should Commercial Banks Accept Savings Deposits?” Conference on Savings and Residential Financing 1961 Proceedings, United States Savings and loan league, Chicago, 1961, 42, 43.
“Profit or Loss from Time Deposit Banking”, Banking and Monetary Studies, Comptroller of the Currency, United States Treasury Department, Irwin, 1963, pp. 369-386
Link: The riddle of money, finally solved BY Dr. PHILIP GEORGE
http://www.philipji.com/riddle-of-money/
Carl, you still have it wrong. When a bank receives deposits from savers, it must somehow invest that money. One way is to buy Treasuries from the public. Another way is to buy Treasuries from the public and then sell those Treasuries to the Fed (while it is engaged in Quantitative Easing). The Fed "pays" for the Treasuries by crediting the bank's account at the Fed with what is called "bank reserves." Bank reserves then function as T-bill equivalents for the bank, since they are risk-free and pay a floating rate of interest. Bank reserves become an asset for the bank and a liability for the Fed, as you correctly note. Nowhere in this process do banks have to create money.
Banks create new, spendable money (which bank reserves are not) by making loans to the public. A borrower signs an IOU which the bank books as an asset, and the bank credits the borrower's account with newly minted money, which becomes a liability for the bank.
Prior to late 2008, banks needed to hold bank reserves to collateralize their deposits (e.g., $1 of reserves for every $10 of deposits). Since bank reserves paid no interest back then, banks always held the minimum possible quantity of reserves. The Fed used the supply of bank reserves to implement monetary policy. By reducing the supply of reserves, banks holding more deposits had to borrow reserves from other banks, so a shortage of reserves resulted in higher short-term interest rates. If banks wanted to expand their lending, they needed to acquire more reserves. More lending resulted in more spendable money, some of which found its way back to the banks in the form of deposits, which were then reinvested as above. In general, an increase in bank reserves coincided with an increase in deposits, but deposits were an order of magnitude larger than bank reserves.
Since late 2008, when the Fed began paying interest on bank reserves, banks have treated bank reserves not as an asset to avoid (because they paid no interest prior) but as an attractive asset relative to other forms of lending. As more deposits flowed into banks (fueled by stimulus checks), banks had more $ to "invest" in bank reserves, which they viewed as very safe assets that bolstered their balance sheets. So there is no longer a fixed relationship between bank reserves and deposits.
^Paragraphs 2 and 3 are self-evident, a conclusion that doesn't prevent paragraph 4 from being partially wrong and paragraph 1 from being essentially wrong.
For paragraph 4, read the following under the heading money created... with two graphs showing the relatively tight relationship between monetary base and deposits and the second graph confirming that money supply growth came a lot from QE and not from private loan growth, explaining the dwindling loan-deposit ratio at commercial banks. Banks, in the aggregate do not decide about the general level of excess reserves, the Fed does.
https://seekingalpha.com/article/4434908-alices-adventures-in-equilibrium
Cash assets held at commercial banks has exactly matched total reserves:
https://fred.stlouisfed.org/series/CASLCBM027NBOG#0
For paragraph 1, this is puzzling. This is not an argument about Trump being narcistic or Biden being demented (i guess we could qualitatively argue about degree), it's about a simple numerical answer which explains what you cannot seem to be able to explain (rising M2 post Fed 2020)??? Apart from intellectual vanity how can one explain your use of a potentially theoretical argument (banks selling Treasuries from their own balance sheet) when numbers show the exact opposite and in a massive way as commercial banks were net buyers (the most important buyers apart from the Fed) of Treasury debt securities from Feb 2020 to now?
Since QE does not increase M2, should we assume that Quant tightening will not decrease M2?
What do you expect would cause M2 to fall?
What about leverage in the financial markets? Is this M2?
Just a thought. If the interest rate on bonds is less than the interest rate on reserves doesn't it make sense for the banks lend internally, buy eligible bonds, sell to the Fed and get the higher reserve rate? Isn't that what happened over the last two years? Isn't it a way to stabilize the financial system's plumbing via stabilizing bond pricing and as a result stabilizing CDS ie the Fed is taking risk out the system by buying MBS and making the bank capital more stable with the reserves and the interest payments.
QT might reverse that and increase risk in the system that might impact liquidity but perhaps the Fed can deal with that via Repos and Reverse Repos which seemed to work out a year ago when the system got tight.
No Fed expert here; I just read a lot and follow the Fed actions which, ever since 1987 seem to be the bell weather for the market's direction.
https://home.treasury.gov/system/files/221/TBACCharge1Q12021.pdf
"When the Fed purchases a security from a non-bank
private sector entity it results in the creation of a bank
deposit"
Open market operations should be divided into 2 separate classes:
(#1) purchases from, and sales to: member commercial banks;
(#2) purchases from, and sales to: "other non-bank entities":
(#1) OMO transactions of the buying type between the FRB-NY's "trading desk" (the Central bank) and the member commercial banks directly affect the interbank demand deposit volumes in one of the 12 District Reserve banks without bringing about any change in the money stock.
The “trading desk” credits the master account of the clearing bank used by the primary dealer from whom the security is purchased. This alteration in the assets of the commercial banks (the banks’ IBDDs), increases - by exactly the amount the PD’s portfolios (or acting as dealer agents, NB’s portfolios), of Treasury and coupon securities was decreased.
(#2) Purchases and sales between the Reserve banks and non-bank investors directly affect both bank reserves (inside money) and the money stock (outside money).
@minnesota nice: re: "What do you expect would cause M2 to fall?"
O/N RRPs cause the money stock to fall. They absorb cash. But the FED's accountants incorrectly claim that the money stock is not drained, and thus the money #s reported are wrong.
@minnesota nice,
Interesting questions.
If interested read the following which has several relevant parts: easing and tightening vs deposit growth etc:
https://economics.td.com/ca-quantitative-tightening
Tightening will occur two ways: maybe actual selling of securities and mostly letting securities mature, with the same end result: lower deposits and lower M2, but the actual mechanism is not the same.
1-If the Fed actually sells the securities, most selling will occur through, as has been happening since post GFC easing started, to non-bank market participants (hedge funds, private equity funds, the States and local authorities, non-bank financial institutions, money-market funds and non-residents). Then, as described, tightening will have the exact opposite effect of easing, ie deposits and M2 will tend to go down in correlation to the extent of tightening. An interesting discussion here would be how commercial banks' net buying/selling of government debt securities will evolve vs net effects on deposits and real on-the-ground and main-street-consumer inflationary potential.
2-If the Fed, as expected, only lets its SOMA portfolio decline over time (maturities reached and proceeds not reinvested), you get the same exact result on declining deposits, M2 etc but the mechanism is different. Remember the Scott to Benjamin money transfer described above through the issuance of government debt? The money is not transferred immediately and will sit (transiently) in the Treasury General Account at the Fed. When the money is parked there temporarily, reserves, deposits and M2 decrease by the same amount. apart from the accrual aspect, this tends to be insignificant although the size of the TGA has grown ++ because this money, which was taken from Scott's bank account will end up in Benjamin"s with no net change in reserves, deposits and M2. However, when the Fed lets securities mature, it take the proceeds from the TGA (decreased deposit liability) which means that Scott's money (and a few other Americans), instead of going to another fellow American (and a few) is used to pay back government debt. This relatively byzantine way to deal with tightening means that letting debt maturities mature means decreased reserves, deposits and M2, just like as if securities would be sold to non-bank participants before maturity.
-----
What about M2 falling and leverage in 'financial markets'. Corporate leverage and margin debt are reaching historical highs versus GDP and this has meant money creation (deposits, M2 etc) all the way up. There's now noise with money movements at the TGA and in the reverse repo market but, for M2 to go down, you would need deleveraging (debt pay back). Can you imagine that without the Fed-Treasury complex getting involved, again?
Real earnings growth still negative (month over month and year over year):
https://www.bls.gov/news.release/realer.nr0.htm
Advance real retail and food services sales down big time, inventories bloated...
Is this still a red-hot economy or an economy like a camel's back waiting for a straw?
-----
In Q1, consumer loans and loans in general were still up (with government debt issue spiking again) and this private loan growth has been persisting in Q2 so far but other components of M2 growth (Fed open-market operations, commercial banks' net sales of government debt) have become negative..
Post a Comment