


Chart #1

As Chart #1 shows, real GDP growth has been on a downtrend for the past several quarters. I had expected Q1/18 growth to exceed 3%, as it had in previous quarters, but it was not meant to be. A number of observers have noted that first-quarter growth tends to be on the weak side, perhaps due to faulty seasonal adjustments, and that may well be the case.
Chart #2

Nevertheless, as Chart #2 shows, year over year GDP growth (which avoids seasonal adjustment flaws) has been trending significantly higher for the past year or so. At 2.9% currently, it meaningfully exceeds the 2.2% average annual growth rate for the current expansion.
Chart #3

Despite the recent pickup in growth, the big picture is far from impressive. As Chart #3 shows, the big picture is dominated by an ever-widening "gap" between where the economy is and where it might have been had past growth trends continued. By my estimate, the size of the gap is about $3 trillion.
Chart #4

Chart #5

As Charts #4 and #5 show, one of the biggest things that has happened in the past year or so is a sharp rise in business and consumer confidence. Confidence jumped almost immediately following the November 2016 elections.
Chart #6

As I've argued for many years, one of the defining characteristics of the current business cycle expansion has been risk aversion and a lack of confidence. People were so shocked by the near-total collapse of the financial markets and the global economy that they began to stockpile money. Money demand surged, as shown in Chart #6, beyond anything we had seen previously. That is now beginning to reverse; people are beginning to spend down their money balances and to use their cash to finance increased spending and investment.
Chart #7

Chart #7 tracks the two components of money demand shown in Chart #6: M2 money supply and nominal GDP. I calculate that if the relationship that prevailed between M2 and GDP for the decades prior to 1990 were to re-establish itself, this could result in an additional $4 trillion of nominal GDP. In other words, if the stockpiled cash were to be released into the economy, this could support an additional $4 trillion of national income. That's equivalent to an increase in national income of roughly 25%.
Chart #8
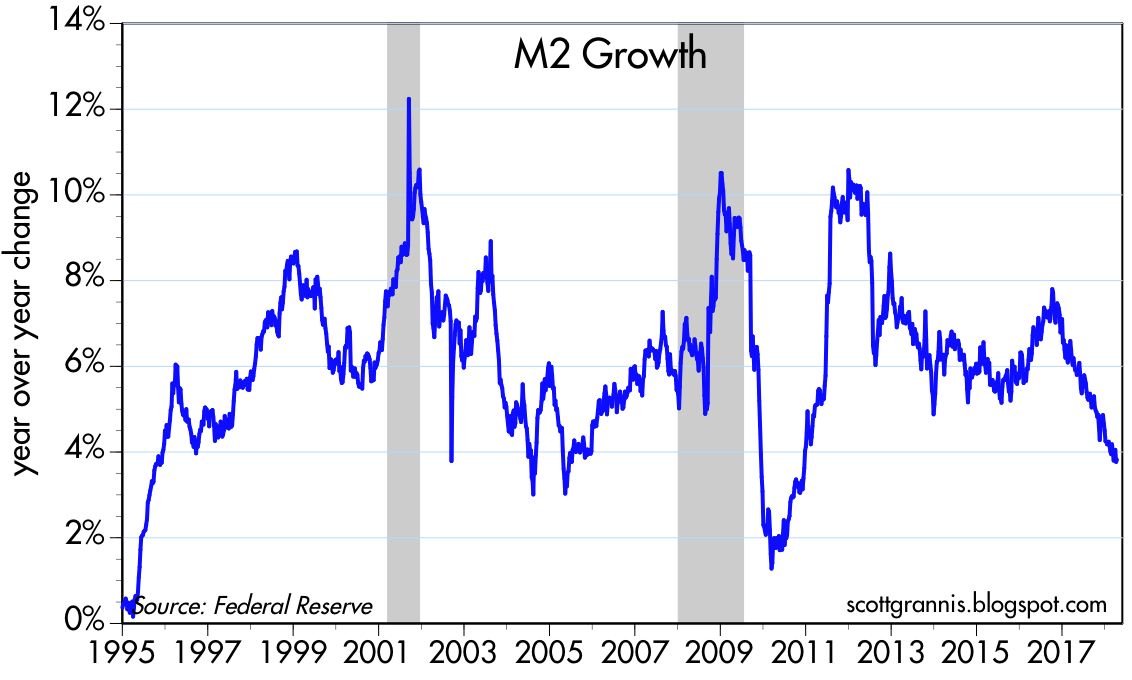
Chart #9

The rise in confidence directly coincides with a decline in the growth of M2 and Bank Savings Deposits, as shown in Charts #8 and #9. Bank savings deposits, I have argued, are an excellent measure of money demand, since in the current expansion they have paid little or no interest. People have put trillions of dollars in the bank because they want it to be safe, not because they want the interest. Bank savings deposits were about 50% of M2 prior to the 2008 recession, and they have now grown to be almost two-thirds of M2. From the end of 2008 until the end of 2016, bank savings deposits more than doubled, from $4 trillion to $8 trillion, for an annualized rate of increase of almost 10%.
Savings deposit growth has now fallen to about 3%, which is similar to the decline in M2 growth to 3-4%. In the past several quarters, M2 growth has been less than nominal GDP growth, with the result that the demand for money (i.e., M2/GDP) has declined. This is potentially just the beginning of something that could continue for years. The Fed no longer needs to force-feed liquidity to the economy; the increased willingness of people to spend what they have accumulated is sufficient to do the trick.
Chart #10

Chart #10 shows the other important and recent change in the economy: a pickup in investment, which began early last year, coincident with rising confidence and fueled of late by tax reform. Private fixed investment rose by almost 7% in the year ending March 2018. By historical standards, investment is still relatively weak, as Chart #10 shows, but it is increasing at a healthy pace. Increased investment enhances the likelihood that we will see a pickup in productivity and living standards in the years to come. As Chart #10 also shows, there is plenty of upside potential here.
Q1/18 growth may have been a bit disappointing, but a look inside the numbers shows that there is reason to remain optimistic.

14 comments:
Scott, I am much interested in your “monetary take” on things in this article!! It is not the common perspective I would say, and as such I would very much like to understand your way of reasoning in more detail.
Do you agree that real money growth in a credit based system is with few exceptions based on new bank credit (I am not considering bank reserves here)?
Also would you agree to the formula that money times velocity equals nominal GDP?
Thanks!
Great post.
Looks like more slow growth, low inflation, yet rising West Coast housing costs ahead (due to artificial supply constraints, property zoning).
Some people are talking up the employment cost index for March, private-sector up 2.8% YOY March. They say it means inflation.
But unit labor costs (which factor in productivity) have been dead in the water for a couple of years.
https://fred.stlouisfed.org/series/ULCNFB
There is still no inflation from the labor sector, although the Fed and the financial community commentariat can hardly talk about anything else.
Like soaring housing costs due to property zoning.
The US and the West Coast could have a property and business boom for the ages, if somehow we could go to free markets in property development.
Scott,
If the relationship between nominal GDP and M2 is broken because of the demand for money, the next interesting question is, what is the catalyst to release the contained M2. Beyond the financial crisis, do you think that the baby boomers are the main reason that the demand for money is so high?
Chris: the M2/GDP relationship is not broken, it has simply changed. To better understand this, think of GDP as equivalent to the average person's annual income, and M2 as the average person's average balance in his or her checking account, plus cash, plus money market funds, plus bank savings deposits (i.e., cash or cash equivalents, call it "money"). For decades the average person kept cash on hand that was equal to 55-60% of his or her annual income. This dropped to 45% in the late 1990s, and then this rose to 70% a few years ago. The demand for money has never been so strong. People have stockpiled enormous sums in bank savings deposits, despite the fact they paid almost nothing in the way of interest. Now it appears that the demand for money is weakening, as people attempt to reduce the amount of cash they hold relative to annual income.
I've argued that the huge increase in the demand for money was driven primarily by risk aversion in the wake of the financial crisis of 2008-09. Now that confidence is rising, people feel less need for mountains of cash. This has little to do with baby boomers or millennials.
FANG firms spending billions: https://www.bloomberg.com/gadfly/articles/2018-04-27/alphabet-amazon-microsoft-and-facebook-wage-a-capex-war
"Overall, stocks continue to be supported by strong first quarter corporate earnings. More than half of Wall Street's S&P 500 companies have reported and 79.4 per cent have beaten consensus estimates.
Analysts now expect Q1 earnings growth of 24.6 per cent, more than double forecasts at the beginning of the year and thanks in large part to hefty tax cuts."
---30---
And last year was hardly a dud.
I will say it again: These are the good ol' days for corporate earrings.
Absolutely and a fraction of GDP, corporate earnings are crushing it, and far, far higher than the Reagan days or anything since. All-time records.
For corporations, it is full-tilt boogie boom times in Fat City.
I like it!
Benjamin: Good comment on corporate earnings. I would add one important thing: the market has most likely fully priced in the big improvement in corporate earnings resulting from the tax cut. I said this near the end of last year. The other shoe that is yet to drop is a significant pickup in economic growth, which has not been priced in yet. I think we should see it, but the market is not yet convinced. For now, the world is waiting to see if GDP growth will pick up in a meaningful fashion. This, if it happens, will mark the next chapter in the market story (higher).
Scott,
Could you give me a short lesson in the relationship between money demand & velocity, and why you focus more on money and less on velocity? Is increasing velocity just another way of saying money demand is decreasing?
If banks increased the lending (decreasing their reserves), would that, by definition, decrease money demand?
Thank your for your years of economic education through your posts!
minnesota, re money demand/velocity. I define money velocity as GDP/M2; the number of times a dollar of cash is spent every year. Money demand is the inverse, M2/GDP; the portion of a year's national income that is held in cash. When velocity goes down, demand goes up. The two are joined at the hip, as it were. Obviously, neither money demand nor money velocity are constant. They change as confidence and risk aversion change. Lots of risk aversion makes people want to hold more cash, and to spend cash less frequently, etc.
According to the slope of the yield curve, economic growth expectations are neither exciting nor worrisome, just ho hum. If these monetary based expectations are realized, we're not going to get that a significant pickup in economic growth. I'm disappointed. I've been hoping for 3%-4% real growth and another 20%+ year for the stock market. Strong earnings are coming in for 1Q2018 but I don't see stocks rallying as a result. Stock markets are relatively expensive and investor sentiment has been too good, and monetary measurements are starting to get tighter, and I am worried that we are in the late stages of this bull market cycle, and to me it "feels" more like a period of gloom than boom.
I worry that our government has made too many bad policy decisions, putting too many able bodied workers on disability and increasing deficit spending for non-investment, that we're not going to see those boom times again for a long time. Yes, we have growth but GDP seems locked into <3%. I wonder, Scott, if your 2.1% post financial crisis average can ever get back to that 3.1% long-term average. I know the US is a developed nation and China is not, but we too have much in undeveloped human resources, and we too have lots of poverty that can be transformed into prosperity. We can grow faster than inflation, can't we?
Just talking to myself. It is a Brave New World.
US Treasury Secretary Steven Mnuchin said the bond market will absorb rising federal debt, no problem: "By definition, supply and demand will equate," he told Bloomberg.
The "What me, worry?" Alfred E. Neuman Memorial Award goes to Mnuchin. This is a GOP Treasury Secretary? Whose GOP? We have come a long way from Everett Dirksen….
And...
"In a recent in-depth interview, Amazon founder Jeff Bezos said that Amazon and his other businesses aren't nearly as important as Blue Origin.
Blue Origin builds, tests, and launches reusable rockets and spaceships in the desert of west Texas.
Bezos said he wants Blue Origin to help move all heavy industry into space and transform Earth into a residential and "very beautiful planet."
This is the richest guy on the planet? The most successful businessman ever? Heavy industry in space?
Well, another day, another dollar. I am much too pedestrian for this modern era….
Scott Grannis can say, "I told you so."
Report: First-quarter gold demand hits 10-year low
Global demand for gold has fallen to its lowest first-quarter point in 10 years, the World Gold Council says, amid lower demand both for physical bars and for gold-backed ETFs.
Total gold investment demand fell to 973 metric tons, down 7% Y/Y, according to the report.
U.S. Mint data shows April sales of 4,500 ounces of American Eagle gold coins, down 25% from last April. Overall Eagle sales for Q1 fell 59% Y/Y, the WGC says.
Bar and coin demand was at 255 metric tons for the quarter, down 15% driven by a 26% drop in the world's biggest bar and coin market: China, which has seen some pressure off the strength of the yuan.
ETF inflows were worse off, declining 66% to reach 32.4 metric tons.
Gold futures moved in up electronic trading after the FOMC statement; they're up 0.3% to $1,310.10/ounce.
---30---
I wonder about gold. China central bank is a big buyer, so is Russia.
Why do people think gold is a store of value? Anyone who bought West Coast real estate in the last 40 years has done great.
Not so with gold. Why not buy platinum?
Silver was a monetary metal even before gold.
A parallel observation on "more money entering economy" aka "demand shock" by Gavyn Davies in FT on April 29. https://amp.ft.com/content/998b63b2-4879-11e8-8ee8-cae73aab7ccb?__twitter_impression=true
https://seekingalpha.com/article/4169767-everyone-side-boat?page=2
I am not sure what the above post means, but the amount of speculation in oil markets is much, much larger than back in 2008, when last I took a deep look (by my amateur standards) at the market.
Even back then in 2008, I thought the tail was wagging the dog (speculators, and possibly state actors, artificially driving up the price of oil), and I was right, but the market was wronger-and-longer that I had expected. You know what that means.
Well, now the oil futures markets is seven times as large as 2008, and it was huge then.
My guess is we see prices rise for while, and then start a multi-year retreat, which should help hold inflation down.
About the only real bottleneck in the global economy are urban housing shortages, caused by property zoning. I think even OPEC has had its best days.
Post a Comment