Sunday, December 31, 2023

Recommended reading: "Poor Charlie's Almanack"


I learned many things from my time at Western Asset Management, many of them from fellow colleagues such as Ken Leech. Ken further endeared himself by one day inviting Charlie Munger to address the professional staff. What a delight that was! As icing on Munger's talk, we received a copy of the first edition of Poor Charlie's Almanack, which I subsequently read and reread. It's full of wit, wisdom, and investment savvy. If somehow you've never heard of Charlie Munger the legendary investor, don't stay ignorant for longer than it takes to click on the link below.

A second edition has just been published by Stripe Press, only weeks after Charlie's passing at the ripe old age of 99. Not content with just publishing a marvelous book, the good folks at Stripe have also made it available online in a delightfully inspired format. I know of no greater and free gift to the world than this: Poor Charlie's Almanack

Best wishes to all for the coming New Year!

Wednesday, December 27, 2023

Monetary policy and economic overview at year end


The Fed has conquered inflation. It's time to start easing. The economy looks OK, no looming recession. 

Chart #1

Chart #1 is arguably the most important chart that the market and the Fed have almost completely ignored for decades. Sure, everyone talks about the money supply (the best measure of which is M2), but no one talks about money demand. And as all students of economics should have learned, prices are set at the margin by the intersection of supply and demand. As Milton Friedman taught us, inflation happens when the supply of money exceeds the demand for it; so when there is an excess of money supply relative to demand, then prices rise and the value of the dollar declines. But without knowing money demand, which is half of the equation of inflation, we are in the dark when it comes to understanding inflation. To be fair to those who have ignored money demand, there is no direct measure of money demand. But we can infer what is happening with money demand if we just observe inflation: rising inflation must mean that money demand is falling relative to money supply. 

And as subsequent charts show, there are other ways of understanding what is happening with money demand.

Chart #2

Chart #2 shows the amount of dollar currency in circulation (currency represents about 10% of M2). From 1995 through early 2020, money in circulation grew by a relatively constant 6.6% rate per year. This in fact is an excellent measure of money demand, because no one holds onto currency if they don't want it, because there is an opportunity cost to doing so. If you handed me a suitcase full of $100 bills I would rush to the bank to deposit the money in order to earn interest. And then I would probably use some of the money to buy some stuff and invest in the stock market and/or real estate. In short, I have no need to hold tons of cash. But in the wake of the Covid crisis the demand for dollar currency soared; everyone wanted to hold more cash because of all the uncertainty that prevailed at the time. Currency grew by a record 16.4% in the 12 months ended Feb. '21. More recently, however, the demand for cash money has fallen rather significantly. Currency has increased at a mere 0.9% annualized rate in the 6 months ended Nov. '23. Currency now is within spitting distance of its long-term growth trend. The surge in the demand for currency has almost completely reversed from its early-covid levels.

Rising money demand in 2020-21 kept the surge in M2 money from causing inflation. Falling money demand since 2021 has kept the decline in M2 money from causing deflation.

Chart #3

Chart #3 shows the level of M2. Here the story is similar to that of currency, only much more dramatic: M2 surged in the wake of Covid, rising by some $6 trillion (almost 40%) to a peak in late 2021. (As I have explained before, this surge in M2 was almost exactly equal to the increase in the federal deficit that was caused by $6 trillion of Covid-related "stimulus" payments.) Since its peak, the "excess" of M2 at its peak has fallen by 58%, and M2 now looks on track to return to its long-term trend line in a year or so. 

Chart #4

Chart #4 shows the level of retail money market funds, which now comprise about 8% of M2. Even as M2 started to decline early last year, retail money market funds began to surge, fueled by the sharp rise in short-term interest rates that resulted from Fed tightening. Virtually all of this increase was in fact money that moved out of traditional bank savings and deposit accounts as individuals were attracted to the much higher yields on money market funds, so this increase was not a sign of increased money demand. Instead, it is an excellent example of how rising interest rates can increase the public's demand for certain forms of money. 

Chart #5

Chart #5 shows the level of bank reserves supplied by the Fed to the banking system. Bank reserves are not cash that can be spent anywhere, and they are only held by banks—in effect, they represent loans that banks grant to the Fed in exchange for reserves. Prior to late 2008, reserves paid no interest and so banks held only the minimum amount of reserves necessary to collateralize their deposits. Since 2008, bank reserves have effectively become T-bill equivalents for the banking system. As the chart shows, reserves have rarely been more abundant. Banks' balance sheets are thus loaded with high-quality, liquid, interest-paying debt. That in turn means that banks are effectively awash in liquidity. As I've argued before, abundant liquidity has made the current Fed tightening episode unique. In previous tightening episodes, the Fed actively restricted the supply of (non-interest paying) reserves in order to push interest rates higher, and that in turn aggravated credit conditions and helped tip the economy into recession. Not so today, thank goodness!

John Cochrane elaborates on this subject in his op-ed in today's WSJ.

Chart #6

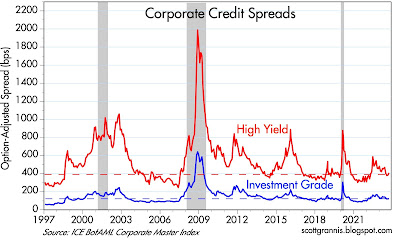
Chart #6 shows the so-called "junk spread," which is the difference between the credit spread on high-yield vs investment grade corporate bonds. Both nominal spreads and the difference between credit spreads are near all-time lows, which is unprecedented at a time when the Fed is no longer tightening and is instead poised to start lowering interest rates. this directly contradicts other "classic" recession predictors, such as the following chart. Monetary conditions are VERY different this time.

Chart #7

Chart #7 shows why many still worry about a looming recession. Note how every recession since 1960 was preceded by sharply rising real interest rates (blue line) and an inversion of the yield curve (red line). Today we see rising real interest rates and a definite inversion of the yield. So does that mean a coming recession? Not necessarily.

As the discussion above highlights, not all Fed tightening episodes are the same. I've embellished on this many times in the past, noting that it's not enough to have high real interest rates and an inverted curve to produce a recession: you also need to see high and rising credit spreads and a shortage of liquidity.

Chart #8

As Chart #8 shows, inflation as measured by the Personal Consumption Expenditure Deflators (a better measure of inflation than the CPI) has, over the past six months, fallen to 2% or less on an annualized basis. The Fed has succeeded in reaching its goal. Bravo!

Chart #9

Chart #9 shows the three major components of the PCE deflator. Non-durable goods price inflation has been almost zero since mid-2022, while durable goods have experienced deflation over the same period. Only service sector prices (which are dominated by housing costs; see my previous post for an explanation) are rising these days, but the rise is exaggerated by flawed calculations. 

Chart #10

Chart #10 shows the level of Commercial & Industrial Loans by US banks. Loan growth has been almost non-existent in the past year (thanks no doubt to high interest rates choking off demand for credit), and many analysts worry that this poses a threat to economic growth.

Chart #11
 (

However, as Chart #11 shows, delinquency rates are near historic lows. Deliquency rates tend to rise as the economy nears recessionary conditions, but this is manifestly not the case today. Corporations are not struggling to pay outsized debts, and are thus much less at risk of having to tighten their belts. Mortgage delinquency rates are now below their pre-Covid lows. Private sector indebtedness is not a problem today. Public sector indebtedness, however, is another story, which I hope to address soon. 

Chart #12

As Chart #12 shows, real yields tend to track real growth trends. With the economy likely growing by a little more than 2% per year (tepid by historical standards), real yields should be much lower than they are today. That will correct itself as the Fed eases.

The big question today: when will the  Fed start lowering interest rates? Today the bond market is betting it will happen at the March 20 FOMC meeting. In my experience, however, when the market becomes highly confident of something that is going to happen in 3 months' time, the event usually happens sooner. Sometimes the future cannot wait very long to happen. I'd put some bets on an ease at the January 31st FOMC meeting. 

Tuesday, December 12, 2023

CPI less shelter is only 1.4%


Shelter costs comprise about one-third of the CPI, and shelter costs are driven primarily by housing prices 18 months before. Which is to say that the way BLS goes about calculating the CPI is bogus. If we take out this bogus component of the CPI we are left with the fact that the CPI rose a mere 1.4% in the 12 months ended November '23. Long story short: the Fed has successfully stomped out the inflation fires that started back in early 2021. The inflation that is still grabbing headlines today is an artifact of the crazy way that the government has decided to measure shelter costs.

Of course, shelter costs are not the source of inflation—they are the result of inflation. Since June 2022, readers of this blog have known inflation was going to decline. That was when I confirmed the impressive decline in the M2 money supply. As I explained at the time, huge growth in M2 from 2020 to 2021, fueled by the monetization of Covid-related deficit spending, was the proximate cause of our national inflation nightmare. M2 continues to decline, and interest rates continue to be high (both of which mean monetary policy is tight), so shelter costs and the broader CPI will likely continue to decline as well.

Chart #1

As Chart #1 shows, the Owner's Equivalent Rent component of the CPI (red line) is primarily driven by changes in housing prices (blue line) with a lag of about 18 months. If this correlation continues (as is quite likely), then the contribution of OER to the CPI will be declining for another 12 months or so. 

Chart #2

Chart #2 compares the year over year change in the CPI with a version of the CPI less shelter. Amazing fact: the 6-mo. annualized rate of change of the CPI less shelter has been 2% or less for 11 of the past 12 months! 

Chart #3

Chart #3 compares the value of the dollar (inverted, blue line) to the level of non-energy commodity prices. Normally, there is a strong inverse correlation between the value of the dollar and commodity prices. The strengthening of the dollar in recent years (shown here as a declining blue line) has exerted a strong deflationary influence on commodity prices, just as has happened during prior episodes of a stronger dollar (e.g., from 2011 through 2015). In inflation-adjusted terms, commodity prices have fallen by about 25% since March '22, which was just a few months before the CPI peaked in June '22. This lends further weight to the idea that inflation is continuing to decline. (Commodity prices usually react early to changes in monetary policy.)

If these trends continue to play out, don't be surprised when you see negative consumer price inflation within the next 6 months. And don't be surprised if the Fed figures this out and lowers interest rates well before, and by more, than the market currently expects.

Tuesday, December 5, 2023

Some big picture charts


While the world waits anxiously to see if the jobs report this Friday shows that too many people are working—because the Fed (erroneously) believes that might be inflationary and thus a reason to raise interest rates still further—I offer six charts that look at the U.S. economy from a big picture perspective. I don't find anything sinister or strange in these charts. Instead, I see an economy that is growing moderately (perhaps only modestly). I see a healthy labor market, an equity market that is rising at a normal pace, bond yields that have most likely risen by enough to cool inflation, credit spreads that are unremarkable (which is good), and a dollar that has been fortified by Fed tightening. 

Chart #1

Chart #1 compares the number of job openings to the number of people looking for jobs. Rarely have openings exceeded the number of job seekers by as much as they have in recent years. What's wrong with that? 

Chart #2

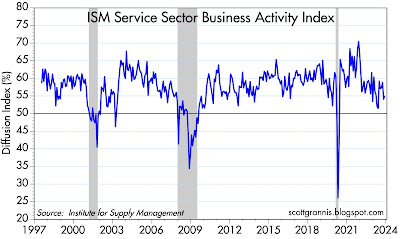
Chart #2 shows an index of service sector business activity. Conditions are still improving (almost 55% of businesses surveyed report improving activity). Things have been better, to be sure, but they would have to deteriorate materially to make me worry about a recession. In any event, this survey suggests that it's reasonable to expect the economy to continue to grow by, say, 2% per year. No boom, no bust.

Chart #3

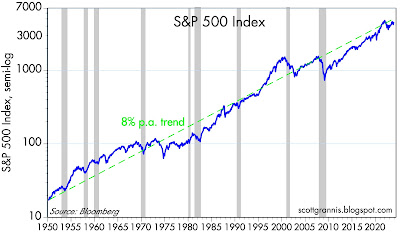
Chart #3 shows the S&P 500 index from 1950 through today. As any student of long-term stock market returns knows, equity prices tend to rise by about 8% per year on average (sometimes more, sometimes less). Add about 1.5% for dividend yields, and you get a long-term total return for equities of about 9.5% per year. Today's market looks pretty normal by those standards. 

Chart #4

Chart #5

Chart #4 shows the yield on 10-yr Treasuries going all the way back to 1925. It's been a wild ride, to be sure, especially for the past few years, as yields rose by more and faster than at any time in history. Yields hit a low of about 0.5% in the midst of the Covid shutdowns in 2020, and have since risen to a high of 5%; today they closed at just over 4%. 

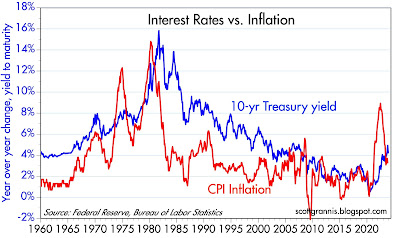
Chart #5 compares these same yields to year over year consumer price inflation from 1960 through today. If—as seems likely—the Fed succeeds in bringing inflation down to 2% or so and holding it there, there's no reason 10-yr yields can't trade in a range of 3.5% - 4%. We're pretty close to that already.

Chart #6

Chart #6 shows two very liquid measures of credit spreads (Credit Default Spreads). Credit spreads are notorious for moving up in advance of recessions and moving down as the economy recovers. That's because credit spreads are driven primarily by the market's outlook for corporate profits, which in turn is a function of the health of the economy. Right now credit spreads are only modestly elevated, which is consistent with a forecast of about 2% real economic growth.

Chart #7

Chart #7 compares the value of the dollar (white line) to the real yield on 5-yr TIPS (orange line). The two have a strong tendency to move together over time. Fed monetary policy is captured in the level of real yields (higher yields mean tighter policy). So a tight Fed means higher real yields, which in turn make the dollar more attractive. The dollar looks somewhat weak of late, and that probably means the market is expecting the Fed to ease policy over the next year or so. And in fact the bond market fully expects the Fed funds rate to be cut 5 times (125 bps) by the end of next year, with the first cut coming in the second quarter of next year. I wouldn't surprised to see the Fed cut rates at the March FOMC meeting, if not sooner. Real yields on 5-yr TIPS will probably be trading around 1% by the end of next year.

Thursday, November 30, 2023

A reassuring outlook


This is a short post to update M2, GDP, and inflation statistics. All are consistent with the view that the economy is growing at a moderate pace and inflation is fast approaching the Fed's target (indeed, by some measures it is already below target).

M2, the most important monetary variable that the world (and the Fed) seem resolutely to ignore, continues to decline. It ballooned in 2020 and 2021 as $6 trillion in deficit-financed COVID "stimulus" spending was mysteriously monetized. Since then, excess M2 has dropped by more than half, and the remainder has been effectively neutralized by Fed interest rate hikes.

In apparent defiance of multiple forecasts that Fed tightening would surely result in a 2023 dominated by recession, GDP grew at a recently-revised and robust 5.2% annualized rate in the third quarter. Once again, market wisdom (e.g., the economy has the unique ability to confound the majority of forecasts) has proven correct. Those who still adhere to Phillips Curve thinking are still scratching their heads: how is it that the economy can strengthen even as the Fed tightens and inflation falls?

It is now abundantly clear that the Fed has no reason to tighten monetary conditions any further. Inflation is within spitting distance of its target. Indeed, the only question at this point is When will they begin to ease? The market is now quite sure that the first easing will come at the May '24 FOMC meeting, but there is no reason they can't ease well before then. Thus, there is reason to remain optimistic about the outlook for the economy and the financial markets.

Chart #1

Chart #1 shows the level of the M2 measure of the money supply, arguably the best measure of money that is easily spendable. Since 1995, M2 grew by about 6% per year, all the while inflation remained relatively low and stable. The "bulge" in M2 has now shrunk by more than half, thanks to negative M2 growth and ongoing growth in prices and the size of the economy. 

Chart #2

Chart #2 is designed to show how growth in M2 predicts inflation by about one year. Negative M2 growth since late 2022 strongly suggests that measured inflation will be declining for the next year.

Chart #3

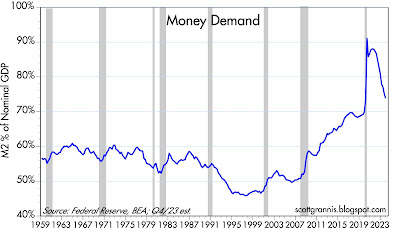
Chart #3 looks at what I call "Money Demand." It's the ratio of M2 to nominal GDP, and it is best described as the amount of readily-spendable cash money that households are willing to hold expressed as a percentage of their annual income. Money demand surged during the onset of the Covid crisis, only to then collapse as the world slowly returned to normal. In times of crisis it is natural for folks to want to hold bigger money balances, and to subsequently spend down those balances as the crisis passes. Money demand today is almost back to where it was pre-Covid by this measure. Today, folks are still willing to hold some extra cash thanks to the fact that interest rates on cash have soared. Short-term interest rates of 5% or so actually more than make up for current inflation rates of 3% or so. So there's an incentive to hold on to cash rather than spend it. For most of the past 3-4 years or so, those incentives were reversed: interest rates were lower than inflation, so the smart thing to do was to "borrow and buy." Today the monetary incentives are tilted to "save and invest."

Chart #4

Chart #4 looks at the 6-mo. annualized rate of inflation according to the total and core versions of the personal consumption deflator. Both have now fallen to 2.5%, which is only marginally above the Fed's target of 2%. 

The inflation drama is over. 

Sunday, November 19, 2023

Congratulations, Javier Milei!


Javier Milei first appeared on my radar screen 3-4 years ago. At the time I thought he would be the perfect person to rescue Argentina from economic oblivion, because he sees things the same way I do. But then I realized that was almost impossible. How could he, a virtual unknown, ever overcome generations of Peronist rule and endemic corruption? Well, he did, and now he has a shot at pulling off one of the world's greatest turnarounds. Milei has beaten long odds to become Argentina's next president starting December 10.

For a person like me (libertarian, classic liberal, conservative, free marketer, monetarist), Milei is just about ideal. He knows exactly what ails Argentina and what is needed to turn things around. But it won't be easy, since Argentina's Deep State (much more entrenched and corrupt than our own Deep State) won't surrender without a fight. So of course the world's capital markets will be slow to revise upwards their projections for the Argentine economy.

But here's the thing: Argentina has fallen about as far and as fast as any country in history. It's a total mess. Raging inflation, a collapsing currency, rampant poverty, endemic and generational corruption—it couldn't be much worse. So much bad news has trashed Argentina's currency (see this post). As a result, the country can be bought for fire sale prices.

Investors will justifiably worry about the odds against Milei's success. So many things can go wrong. So many hurdles to clear. Where will he get all the dollars needed to dollarize the economy? How can he slash government spending and subsidy payments without sending millions to the poorhouse? How can he possibly dislodge legions of Peronist bureaucrats who don't even bother to show up for work until it is time to collect their monthly check?

Nevertheless, if Milei manages to get some traction with the monumental changes he is proposing, the upside potential for the Argentine economy is very difficult to overestimate. In my fantasies, I see Argentina inundated by a tsunami of foreign capital in the years to come. When the cheapest economy in the world suddenly becomes the one with the most upside potential .... Well, you fill in the blanks. It could be exciting, to say the least.


Wednesday, November 15, 2023

Inflation RIP


I've been predicting the demise of inflation for at least a year now, and today's CPI report makes it official—there's no denying that inflation has fallen to within spitting distance of the Fed's target. Not coincidentally, the market has finally acknowledged what I've been expecting for many months: the chances of another Fed tightening at this point are zero. The only issue now is when the Fed starts to cut rates; the market thinks the first cut comes at the May 1st FOMC meeting, while I think it happens much earlier.

Chart #1

Chart #1 compares the year over year change in the CPI to the CPI minus its shelter component (which comprises about one-third of the CPI index). Absent shelter costs, which we know have been artificially inflated due to the BLS's flawed methodology (see Charts #2 and #3), the CPI is up only 1.5% in the year ending October '23. In fact, by this measure, inflation has been at or under the Fed's target for the past six months.

Chart #2

Chart #2 shows the 1- and 3-mo. annualized rate of change in Owner's Equivalent Rent (the major component of shelter costs). Here we see that shelter costs have been rising at a 5-6% annualized rate for the past several months. Contrast this to the fact that nationwide housing prices, according to the Case-Shiller index, have only increased 1.4% since mid-2022. Bottom line, the OER is substantially overstating inflation.

Chart #3

Chart #3 is designed to show that the BLS methodology effectively uses changes in housing prices from 18 months prior to drive changes in Owner's Equivalent Rent. Big changes in housing prices thus feed into the CPI calculation with a lag of as much as 18 months! This chart also strongly suggests that the big deceleration in housing prices that began a year ago last summer will cause the change in OER to fall to close to zero over the next 9-10 months. That in turn strongly implies that the contribution to inflation that comes from shelter costs will be declining for many months to come. It wouldn't be surprising, therefore, to see overall CPI inflation fall into negative territory in the next 3-6 months.

Chart #4

Chart #4 shows that changes in the growth rate of the M2 money supply tend to show up in similar changes in the rate of inflation with about a 1-year lag. This is strong evidence that the recent bout of inflation we have endured had a monetary origin. As I've explained numerous times in the past year or two, the source of our inflation surge can be traced to the monetization of some $6 trillion in federal deficit spending in 2020-2021. Happily, there has been no further debt monetization since 2021.

Chart #5

Chart #5 shows the 6-mo. annualized rate of change of overall and core producer prices (producer prices tend to be upstream of consumer prices, so this is like seeing a preview of the trend of the CPI in the months to come). By this measure, inflation is running at a 0-2% rate. Moreover, the producer price index has not changed at all since June '22

Inflation is dead, may it Rest In Peace.

Is there any reason at all for the Fed to hold off on lowering rates until May? Not that I can see.

Monetary policy is manifestly tight, as reflected in a variety of indicators: 1) a significant deceleration in the rate of nearly all price increases, 2) a 57% plunge in new mortgage originations since early 2022 (i.e., high interest rates have severely impacted the housing market), 3) a 20% decline in non-energy commodity prices since early 2022, 4) at 2.3%, real yields on 5-yr TIPS (an excellent barometer of how tight monetary policy is) are substantially higher than their 28-yr average (1%), and 5) the yield curve is still inverted.

If the Fed remains true to form, they will wait too long to lower rates, just as they waited too long to raise rates two years ago. And that, in turn, means that when they eventually do lower rates, they will have to lower them faster and by more than if they were to start now.

The good news is that there is still little or no reason to think that the economy is at risk. Swap and credit spreads are low, implied volatility is low, initial jobless claims are low, and liquidity is abundant. 

UPDATE (11/16/23): Here is an updated bonus chart showing how the federal deficit was monetized in 2020 and 2021, and how that link was severed about a year ago. Today we have big and ongoing deficits measured in trillions of dollars, but they are no longer translating into big increases in the money supply. This is how it should be. Deficits should never be monetized, and as such they needn't be inflationary. But since today's deficits are the by-product of excessive spending, they represent a drag on growth. The government is borrowing money and spending it wastefully. That squanders scarce resources and depresses the economy's long-term growth potential. Our children and grandchildren will pay the price in the form of living standards that could have been higher. 

Chart #6


Saturday, October 28, 2023

Growth and inflation update: not much to worry about


The big news this week—though widely anticipated—was the 4.9% annualized growth of the economy in the third quarter. Analysts still infected by Phillips Curve thinking worried that a strong economy would encourage the Fed to keep rates "higher for longer," thus posing the risk of a recession next year. (Note: economic growth does not cause inflation. In fact, over the past year the economy has continually beat growth expectations, all the while inflation has been declining rather significantly.) By week's end, worries about Middle East tensions trumped growth fears, and inflation data showed that disinflation, not inflation, remains the order of the day. Interest rates backed off their highs, and equities traded lower. Expect Phillip Curve nightmares to continue to haunt the market this coming week. As for Middle East tensions, well, that merits concern but I don't know of any obvious solution to that.

Chart #1

While 4.9% growth in one quarter certainly stands out as a big number, it's worth noting that it's an annualized number. In fact, the economy reportedly grew only 1.2% in the third quarter. And as Chart #1 shows, the path of real GDP (blue line) experienced only a small wiggle to the upside with this latest number, and it will probably experience a much smaller wiggle next quarter. The big story with GDP is that the economy has been growing by more or less 2.2% since mid-2009. That's a lot slower than the 3.1% trend which prevailed from 1965 through 2007. Today, the U.S. economy is unfortunately not in danger of growing too fast. It is just muddling along, fighting the headwinds of very high tax and regulatory burdens aggravated by excessive government spending on transfer payments and "green" energy boondoggles (green energy needs subsidies to compete since it's woefully inefficient).

 Chart #2

Chart #2 shows the year over year change in the GDP deflator, which is the broadest measure of inflation we have. By this measure, inflation has fallen from a high of 7.7% to now 3.2%. 

Chart #3

Chart #3 shows the 6-mo. annualized rate of change of the Personal Expenditures Consumption Deflator and its core (ex-food and energy) version (note: the PCE deflator is a better measure of inflation than the CPI because the weights of its components change dynamically as consumer habits change). Over the past six months both of these measures show inflation rising at a 2.8 - 3.2% annual rate, only about 1 percentage point faster than the upper end of Fed's target. 

Chart #4

Chart #4 breaks down the Personal Consumption Deflator into its 3 main categories. Note the impressive decline in durable goods prices which began in 1995, the year China first opened its economy to world trade. Most of the increase in inflation in recent decades comes from the service sector, which in turn reflects mostly wages. The huge increase in wages alongside a significant decline in durable goods prices means that an hour's worth of work today buys more than 3 times as much in the way of durable goods as it did in 1995. We've never before seen such an increase in purchasing power; prior to 1995, durable goods prices never declined on a multi-year basis.

Chart #5

Chart #5 shows real and nominal yields on 5-yr Treasuries and the difference between the two (green line), which is the market's expectation for what CPI inflation will average over the next 5 years. The rise in yields over the past 18 months has been driven almost exclusively by the rise in real interest rates. Real rates, in turn, are the best measure of how tight monetary policy is. Thus, tight money (as measured by a 340 bps rise in real yields) has brought inflation expectations down to about 2.3%, which is almost exactly the upper bound of the Fed's target for PCE inflation (2%), because the CPI tends to exceed the PCE deflator by about 30-40 bps per year.

Chart #6

Chart # 6 compares the level of real yields on 5-yr TIPS to the 2-yr annualized growth of GDP (which I use because it smooths out the random quarterly variations in actual GDP growth, and it likely mimics the public's perception of what current GDP growth is). Real yields tend to track the strength or weakness of the economy; high real yields prevailed in the late 1990s when the economy was exceptionally strong (growth rates of 4-5%), and real yields have been low during most of the past decade as the economy has averaged 2% annual growth. With the exception of the past 18 months, of course, when real yields have surged. If the economy remains on a 2.2% growth path, it wouldn't be unreasonable to expect that real yields will decline significantly from today's 2.4% levels. That would likely coincide with a relaxation of the Fed's monetary stance, and that, in turn, would provide welcome relief to the market.

Wednesday, October 25, 2023

M2 update: continued disinflation


With this post I provide continued coverage of the all-important M2 money variable that almost no one, including the Fed, has bothered to pay attention to for the past several years. Click here to see my first post (October '20) highlighting the extraordinary growth of M2 and why it wasn't inflationary. Click here to see my first warning (March '21) that rapid M2 growth threatened a significant increase in inflation. Click here to see my first prediction (May '22) that slowing M2 growth presaged declining inflation. 

I'm happy to report that M2 continues to decline, thus ensuring continued disinflation. It's still early to worry about deflation, but it could happen if the Fed waits too long to start cutting interest rates.

Chart #1

Chart #1 shows the level of M2 compared to its 6% trend rate of growth which began in 1995. (Note the use of a semi-log scale for the y-axis, which displays a constant rate of growth as a straight line.) At the peak of the M2 "bulge" in December '21, M2 exceeded its trend by about $4.8 trillion. The "gap" has now shrunk by more than half, and currently stands at about $2.2 trillion. The gap has shrunk due to 1) soaring interest rates, which have slowed loan growth, and 2) declining demand for money, which has fueled spending and higher prices. 

Chart #2

Chart #2 compares the growth rate of M2 with the size of the federal budget deficit. Here it becomes obvious that the $6 trillion surge in deficit-financed spending in 2020 and 2021 was almost entirely monetized, thus boosting M2 by $6 trillion. The good news is that despite continued deficit spending since mid-2022, virtually none of it has been monetized. Thus, ongoing deficits no longer pose a risk of higher inflation. 

Chart #3

Chart #3 compares the growth of M2 with the rate of consumer price inflation. I've shifted the CPI line one year to the left, to show that it took about one year for the huge increase in M2 to find its way into the inflation statistics. The chart further suggests that since M2 growth has been declining for well over one year, CPI inflation is likely to continue falling for at least the next 3-6 months and could potentially reach zero. In my previous post I argued that inflation has effectively fallen to the Fed's target zone already.

Chart #4

Chart #4 shows the level of currency in circulation, which represents about 10% of M2. This is an important statistic to follow because it helps to understand what I call "money demand." Nobody holds large amounts of cash unless they really want to. Suppose, for example, that you discover a suitcase full of bundles of $100 bills in your basement. Your first instinct would be to take that cash to your bank and deposit it to your checking or savings account in order to earn interest. The bank, in turn, would receive that cash and most likely send it off to the Fed, where it would be effectively removed from circulation. In places like Argentina, however, where holding dollar bills is essentially the only way that people can safeguard their cash holdings, millions of people happily stuff bundles of $100 bills under their mattress. (It's estimated that some $250 billion in US currency is held by Argentines.) 

This chart confirms that money demand surged in the wake of the Covid shutdowns and then began to taper off as the economy slowly began to return to normal over the course of 2021. Strong money demand neutralized the surge in M2 at first—we know that because inflation did not rise until well after M2 ballooned. But then money demand weakened, causing money to be released into the economy, where it supported a growing economy and fueled higher prices. 

Currently, I estimate that there is only about $50 billion of "excess" currency in circulation, which implies that money demand has just about returned to normal. And that, in turn, suggests that the monetary fuel for higher inflation has just about dried up.

Chart #5
 

Chart #5 is another way of looking at "money demand" on an economy-wide scale. It's simply the ratio of M2 to nominal GDP, and as such, it's a proxy for how much of our annual incomes we collectively prefer to hold in currency, bank checking and savings accounts, and retail money market funds. Money demand surged with the Covid shutdowns, rising fears, and great uncertainty, then collapsed as the economy returned to normal and the price level rose. According to this chart (and Chart #1) there is still an excess of M2, but its inflationary potential has been largely neutralized by the Fed's aggressive rate hikes. (Higher interest rates encourage people to hold higher money balances than they normally would, instead of spending them down.) 

Friday, October 20, 2023

Argentina votes as the peso plunges


I've been an observer of the Argentine economy ever since I first went there in 1970 to visit my soon-to-become wife. So I am compelled to make this brief post as Argentina's currency passes a key marker: today, Argentines must now come up with 1000 pesos to buy just one dollar. Actually, if Argentina had never taken multiple zeros off its currency several times since 1916, when the exchange rate was 2 pesos per dollar, today it would take 10,000,000,000,000,000 (ten quadrillion) of those original pesos to buy a dollar!

The spark behind the latest peso plunge is Sunday's presidential election. The front-runner, Javier Milei, promises to ditch the peso and dollarize the economy. Which, in my opinion, is the only sensible thing to do, though it might prove tricky to implement. The Argentine government has been resorting to the printing presses to finance its profligate spending for far too long. People know that every day you hold a 2,000 peso note (the largest note in circulation!) in your pocket you are losing money at the rate of 150-200% per year—i.e., the current rate of inflaton. So the demand for pesos has plunged and the demand for dollars has soared. No wonder Argentines are demanding radical change—this has gone on for far too long.

The lesson in this for the U.S. is that our government seems to have abandoned any concern over deficit spending. The budget deficit for the just-finished fiscal year was about $1.700,000,000,000, which is over 6% of GDP. It only exceeded that level during WW II, the 2008-09 Great Recession and its aftermath, and the 2020-22 Covid shutdowns. Today it's sky-high despite the fact that the economy is relatively healthy. Federal debt is now about 94% of GDP, and annual interest payments on that debt are about $1 trillion and rising. We were flirting with Argentine-style inflation a few years ago, when the M2 money supply increased by $6 trillion (40%) in less than two years, thanks to $6 trillion of Covid-related deficit spending.

Chart #1

As Chart #1 shows, since 2007 the peso has lost 99.7% of its value vis a vis the dollar, and the losses are accelerating. Something is going to have to change, and quickly, or the economy will grind to a halt for lack of money. Let's hope our own Congress can get its act together as well.

Thursday, October 12, 2023

CPI ex shelter is 2.0%


On a year over year basis, the CPI is up 3.7%. Excluding shelter costs, which we know are artificially inflated by BLS methodology, the CPI is up only 2.0%. It is not unreasonable to think that the Fed has successfully arrested the inflation that was caused by $6 trillion of federal deficit spending in 2020 and 2021. Mission accomplished. No more rate hikes are needed.

Chart #1

Chart #1 compares the year over year change in the CPI index (blue line) and the CPI index less shelter costs (red). The CPI including all prices rose 3.7% in the past 12 months, but excluding just one category—shelter costs, which are heavily influenced by housing prices 18 months prior—the CPI was up only 2.0%. 

Chart #2

Chart #2 shows how BLS methodology effectively uses changes in housing prices 18 months prior (blue line) to drive the Owner's Equivalent Rent component of the CPI, which makes up about one-third of the CPI. Housing prices and rents stopped rising over a year ago, but the BLS is assuming that shelter costs are still rising at a 7% annual rate, thus artificially boosting the overall CPI. For the next six to nine months, the BLS-calculated increase in shelter costs will be dropping significantly, and that will meaningfully reduce the shelter contribution to the CPI. Meanwhile, the CPI has received a boost from rising gasoline prices in August and September; and a lot of that boost will reverse in coming months, since nationwide gasoline prices have fallen in the past several weeks. In short, expect measured inflation to remain low for the foreseeable future. Low enough to keep the Fed from raising short-term interests rates further than they already have.


Thursday, September 28, 2023

M2, GDP, and interest rate update


A quick update on M2, GDP, and interest rates: 

There is still a "surplus" of M2 money, but it is shrinking every month. Higher interest rates have boosted the demand for money, in effect neutralizing the declining M2 surplus. We know this because all indicators point to a significant decline in inflation, especially when measured at the margin (year over year growth rates can be very misleading when important changes in trends are occurring). High interest rates discourage borrowing (banks expand the money supply by lending), encourage saving and discourage spending (holding onto all that M2 keeps it from getting spent).

Inflation is not driving interest rates higher—the Fed is. Real interest rates on TIPS have surged to levels not seen since before the Great Recession. This is a sign of monetary tightness, as is the recent weakness in gold prices, the strength of the dollar, and well-grounded inflation expectations. It may also be a sign that the market has become more confident about the outlook for the economy. There's one thing that has the market worried, however, and that's the risk that the Fed will keep on pushing rates higher than they need to be. 

The BEA today released revised GDP statistics going back many years. Real (inflation-adjusted) GDP is now measured in 2017 dollars (before it was 2012 dollars), and the revisions show it has been growing a bit faster since 2009 than we thought (before it was 2.1% per year, now it's 2.2% per year). The much-feared recession (I've lost track of the many recession forecasts that have fallen by the wayside over the course of this year) has yet to appear, and I still see no signs that it is imminent or likely in the near future.

Chart #1

As Chart #1 shows, M2 has fallen by almost 4% since its peak in the summer of last year. The "gap" between M2 and its long-term trend growth of 6% per year since 1995 has now shrunk by half and looks set to continue shrinking. When M2 first surged there was no increase in inflation because the demand for money in the first phase of the Covid lockdowns was intense—fear was rampant, and it was difficult to spend all the money that was being showered on the public in the hopes it would forestall a depression. But as the economy began to open in early 2021, the demand for money began to fall and that fueled a surge in inflation—demand for goods and services outstripped the supply. The Fed failed to react to this dynamic at first, (saying inflation was just "transitory") but then began tightening in earnest in early 2022. 

Chart #2

Chart #2 is evidence that the surge in M2 was caused by excessive, debt-fueled government spending. M2 surged just as the federal deficit surged. Declining deficits removed the source of M2 growth beginning in early 2021. We are fortunate that the second surge in deficit spending, which began about a year ago, has not resulted in any increase in M2. Deficits are no longer being monetized. Thank goodness. And so far, there has been no return of Covid panic.

Chart #3

Currency in circulation comprises about 10% of M2. As Chart #3 shows, currency growth also surged in the wake of Covid, only to retreat. The excesses of the Covid era are fading.

Chart #4

Chart #4 shows the growth of real GDP (blue line) as it compares to two different trend rates of growth (green and red). From the 1960s until 2007, real GDP grew on average by about 3.1% per year. Following the Great Recession, it has only grown by about 2.2% per year. What caused such a huge change? I think it is the result of 1) excessive government regulation and spending, 2) higher tax burdens, and 3) increased social welfare spending (transfer payments). Whatever the cause, the economy has experienced sub-par growth for over two decades. Things are unlikely to improve unless we reverse the causes of sub-par growth, and that's not about to happen anytime soon.

Chart #5

Chart #5 shows the quarterly annualized rate of growth of the GDP deflator, which is the broadest and most timely indicator of inflation available. During the second quarter of this year, prices throughout the economy rose at a mere 1.7% rate, well below the Fed's professed target. Memo to Fed: pass this chart around the office!

Chart #6

Chart #6 looks at the level of 5-yr real and nominal yields, and the difference between them (green line), which is the rate of inflation the market expects to prevail over the next 5 years. Inflation expectations are well grounded, and have fallen in the past year or so—thanks to the Fed's decision to jack interest rates up. One important conclusion thus appears: interest rates are higher not because of inflation fears, but because of the Fed's actions. And the Fed's actions appear to be driven meaningfully by mistaken worries that the economy might prove to be too strong and thus inflation might remain too high. Balderdash: the economy is still experiencing sub-par growth even as inflation has plunged. Growth didn't cause inflation, deficit spending that was monetized did, and it's not happening anymore.

UPDATE (Sept. 29):

Chart #7

Chart #7 shows the 6-mo. annualized change in the Personal Consumption Deflator and its Core (ex-food and energy) version, both of which were released this morning. The former is a broader measure of inflation than the CPI, and its weightings change dynamically as the economy changes (not so with the CPI, which is why it is a flawed measure). It is up at a 2.6% annualized rate. The latter is the Fed's favorite measure of inflation, and it is up at a 3.0% rate; but on a 3-mo. annualized basis, it is up only 2.2%. Inflation is rapidly approaching the Fed's target—why can't they acknowledge this? Why is the market so nervous? 

Chart #8

Chart #8 shows credit spreads for investment grade and high-yield corporate debt, as of yesterday. By any measure, credit spreads are relatively low, and that implies a healthy economic outlook. There is no sign whatsoever here of an impending recession. This chart also directly refutes the idea—apparently embraced by our addled Fed—that economic weakness is necessary to bring inflation down. Since inflation peaked in mid-2022, investment grade spreads have fallen from 171 bps to 123 bps, and high yield spreads have fallen from 600 bps to 409 bps. Both of those declines imply a much-improved economic outlook at the same time as inflation was falling from 8-9% to less than 3%.