On the eve of what is likely to be the end of this cycle of Fed tightening (even if the Fed hikes rates 25 bps tomorrow, they will almost surely convey the impression that no more hikes are envisioned), this blog continues its coverage of the all-important money supply figures. The June M2 number was released today and it was unremarkable. Year over year M2 growth is running at about a -4% rate, while M2 has been relatively flat over the past three months. This is consistent with further declines in inflation over the next 6-9 months.
It continues to amaze me that only a handful of Fed watchers pay any attention to the M2 money supply. The vast majority of inflation-related commentary—including that of the Fed itself—lavishes attention on just about every inflation indicator and variable except the money supply. Milton Friedman must be rolling in his grave. As he famously said, "inflation is always and everywhere a monetary phenomenon." Inflation happens when the supply of money exceeds the demand for it, and the lags between money supply and inflation are "long and variable." So when the US M2 money supply grew at a 20-30% annual rate in 2020 and early 2021, a big increase in inflation was very likely to show up in early 2022. And, not surprisingly, it did.
Chart #4 shows the Conference Board's index of consumer confidence. July's figure was reported today, and it showed a welcome increase. This supports my long-held contention that there is no reason to worry about an imminent recession. The economy is likely to continue growing for the foreseeable future, albeit at a relatively unimpressive rate of 2% or maybe a bit less.
We've now seen M2 growth not only collapse, but actually turn negative over the past two years. Again, not surprisingly, inflation began to decelerate dramatically starting about one year ago. More recently, M2 growth has been flat for the past three months, so to the extent that some observers, like Brian Wesbury, worry that collapsing M2 portends an eventual recession, the M2 news has become much less worrisome.
Chart #1
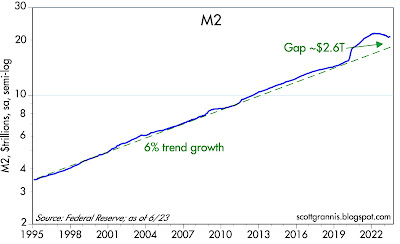
Chart #1 shows the level of M2 relative to its long-term trend growth rate of 6% per year. (Note that the y-axis is plotted on a log scale, so a straight line represents a constant rate of growth.) M2 is still about $2.6 trillion above trend. I've interpreted this to mean that there is still a lot of liquidity in the economy, and this should act as a buffer against adverse developments.
Chart #2
Chart #2 compares the year over year growth of M2 with the rate of consumer price inflation, with the latter shifted to the left by one year to illustrate the fact that there is approximately a one-year lag between changes in M2 growth and changes in inflation. The chart strongly suggests that the CPI is on its way to zero over the next 6-9 months. As such, it's reasonable to conclude that the Fed has acted appropriately, if belatedly, and no further tightening is therefore necessary; lower inflation is "baked in the cake" at this point.
Chart #3
Chart #3 compares the growth rate of M2 with the 12-month running sum of monthly federal budget deficits. This chart strongly suggests that most or all of the deficits from 2020 through early 2021 were monetized. In other words, the massive Covid-era spending blowout was financed with money that was effectively printed. Fortunately, the rising deficits we have seen in the past year have not been monetized, so there is no reason to worry about a resurgence of inflation fueled by excess M2 growth.
Chart #4


