Friday, January 28, 2022

M2 and Nominal GDP Update: still growing rapidly

I am fascinated by the fact that these days hardly anyone is talking about the very rapid growth in both M2 and nominal GDP. Both suggest that inflation is alive and well, and very likely to continue.

The big news this week was that the Fed is doing its best to avoid an aggressive tightening of monetary policy. Which makes it strange that the market sold off on the news that the Fed plans to accelerate (ever so slightly) its tapering of asset purchases while also planning to begin to lift short-term interest rates (in gingerly fashion) in about two months. As I've been arguing for awhile, the threat of tight money is a problem that still lies well into the future; it's certainly something to worry about, but not for now. Monetary policy today is still extremely accommodative, and almost certainly the culprit behind our inflation problem. 

Today the Fed said that they plan to start raising short-term rates in early March. The bond market expects the Fed will ratchet up rates by 25 bps at a time until reaching a "terminal rate" for their Fed funds target of about 2.5% in about 3-4 years' time. In my book, that hardly rates as tight money. Actual tightening involves a significant rise in the real Fed funds rate (e.g., to at least 3%). It also involves a flattening or inversion of the Treasury yield curve, which is still moderately steep. We're not even close to those conditions, and the Fed has virtually assured us they are unlikely to slam on the monetary brakes anytime soon. 

Most observers these days argue that inflation is the result of too much demand (fueled by government stimulus payments) and not enough supply (e.g., Covid-related supply bottlenecks). Hardly anyone talks about the unprecedentedly rapid growth of money, aside from me and a handful of other economists (e.g., Steve Hanke, John Cochrane, Ed Yardeni, and Brian Wesbury). Moreover, I'd wager that the great majority of the population doesn't understand that supply and demand shocks can only affect the prices of some goods and services, but not the overall price level. If all, or nearly all prices rise, that is a clear-cut sign of an excess of money relative to the demand for it. That is how inflation works.

There are other reasons to think the recent stock market selloff is overdone, if not premature. Credit spreads—which measure actual stresses in the economy—are still relatively low. Swap spreads—which are a good indicator of liquidity—are very low. Together, these spreads tell us that liquidity is abundant, economic stresses are low, and the outlook for corporate profits—and by inference the economy—is healthy. Ironically, the main problem for now is that the Fed is not prepared—yet—to do anything that might slow the rate of inflation or threaten the economy for the foreseeable future. They'd rather lay the blame for inflation on Congress than take the heat themselves. And don't forget that Powell is up for renomination soon. 

Chart #1

Chart #1 shows the growth of currency in circulation, which represents about 10% of the M2 measure of money. After surging at 20% annualized rates in Q2/20, the growth of currency has slowed to about a 5% annualized rate, which is somewhat slower than its long-term trend growth of about 6.6% per year. As I've explained before, the supply of currency is always equal to the demand for currency, which means that currency growth is not contributing to our recent inflation problem. Currency growth was quite rapid last year because the demand for currency was very strong, fueled by all the uncertainties of the Covid threat. But the fact that currency growth has since slowed significantly since then suggests that precautionary demand has faded: this is arguably a good leading indicator that the demand for money balances in checking accounts and bank savings account is also softening or beginning to soften. In the absence of any slowing in the growth of M2, any reduction in the demand for money in the system is precisely what fuels a rise in the general price level. If the Fed does nothing in response, such as raising short-term interest rates and draining reserves from the banking system, inflation is very likely to continue

Chart #2

Chart #2 shows the growth of the M2 monetary aggregate. Here again we see explosive growth in Q2/20 and a subsequently slower—but still quite rapid—rate of growth which continues to this day. For the past year or so, M2 growth has been averaging about 12-13%. That is twice as fast as its long-term trend rate of growth, and it shows no sign of slowing, even though the Fed has been tapering its purchases of securities (to be fair, tapering does nothing to reduce inflation). This is good evidence that M2 is growing because banks are lending money by the bushel, which is the only way the money supply can expand. The public's apparent demand for loans is thus strong, and that is symptomatic of a decline in the demand for money. 
 
Chart #3

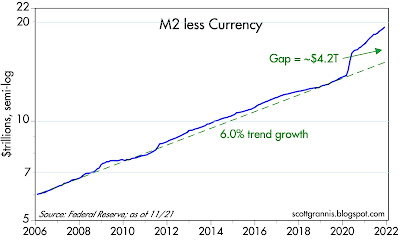
Chart #3 shows the growth of M2 less currency, which is equivalent to all the money that has been supplied by the banking system via lending operations. It's important to remember that the Fed cannot create money directly; the Fed only has the power to limit bank lending by limiting bank reserves, and to influence the public's demand for money via increasing or decreasing the overnight lending rate. Again we see the same pattern: explosive growth of M2 in Q2/20 followed by a slower (but still rapid) 13-14% pace since then that shows no signs of slowing (as of the recently-released data for December '21). The growth of money on deposit in our banks is growing at more than twice its historical rate, and that has been the case for the past 18 months. Needless to say, this is nothing short of extraordinary. And it is the stuff of which inflation is made.

Chart #4

Chart #4 shows that the M2 money supply is now equal to about 90% of the economy's nominal GDP. Since the latter is roughly equivalent to national income, this means that the average person or entity today is holding almost one year's worth of his annual income in a bank deposit of some sort. This is a level that was only exceeded in Q2/20, at the height of the Covid panic, and it is far above any level we have seen for many decades. People have effectively stockpiled an unprecedented amount of money in bank accounts and savings accounts that pay almost no interest! On its face, this would suggest that the demand for money (non-interest bearing money) has been intense. But will that demand remain strong? The fact that inflation has surged in the past year is good evidence that money demand is already declining: people are trying to get rid of unwanted money by spending it, and that is what is driving higher inflation.

Chart #5

Real GDP grew by a very healthy 5.5% in 2021, but about 70% of that growth came from inventory rebuilding—so we are very unlikely to see another such number. The general price level rose by 5.9%, which means that nominal GDP grew by a whopping 11.7%, which is not surprising since the M2 money supply rose by 13.1%. As Chart #5 shows, both M2 and nominal GDP have a strong tendency to grow by about the same rate over longer periods. When they diverge from this trend it's due to a change in the public's desire for money balances. Referring back to Chart #4, we see that money demand grew by about 1.6% last year, but most of that increase happened in Q1/21 when Covid uncertainty was still raging. Money demand has been steady for the past 9 months. If M2 continues to grow at a 13% annual rate, as it has for the past year, then nominal GDP growth is very likely to continue grow at double-digit rates. And since the economy is very unlikely to sustain a 5% growth rate for much longer, inflation is going to be at least 7-10% for as long as M2 growth remains at current levels. 

An important note: it is going to be many months before the Fed adopts policies (e.g., draining reserves and lifting the Fed funds rate to a level at least equal to inflation) that will slow the growth of money by increasing the public's desire to hold money. Banks have been the source of the explosion in M2 growth, and the only thing that will change this for the better are policies designed to make holding money more attractive; banks need to be less willing to lend to the public and the public needs to be less willing to borrow. Much higher short-term interest rates are thus the cure for our inflation blues. But we won't be seeing them for a long time.

Chart #6

Chart #6 shows how increases in housing prices tend to lead inflation by about 18 months. Housing prices have been rising at a 15-20% annual rate for the past year or so, and that is very likely to add substantially to consumer price inflation for at least the next year. Owner's equivalent rent comprises about 25% of the CPI.

Chart #7

Chart #7 compares the real yield on the Fed funds rate (blue line) to the slope of the Treasury yield curve (red line). Note that every recession (gray bars), with the exception of the last one, has been preceded by a significant increase in real yields and a flattening or inversion of the yield curve. Both of those conditions are highly indicative of "tight money." We won't see anything like that until at least next year, given the Fed's obvious desire to avoid shocking the bond market and/or risking another recession.

Chart #8

Chart #8 compares the growth of nominal GDP (blue line) with two different long-term trend lines. (Note that the chart uses a semi-log y-axis, which shows constant rates of growth as straight lines.) The economy grew by 3.1% per year[ on average from 1966 through 2007. Since 2009, it has grown by about 2.1% on average. Unless policies become more growth friendly, we are thus unlikely to see GDP exceed 2% on a sustained basis. That again highlights the fact that 13% M2 growth, if it continues, will likely result in sustained inflation of 10% or more this year.  

All eyes should be glued to the growth of M2, which is released around the end of the third week of every month.

Chart #9

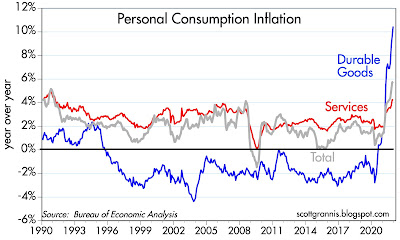
Chart #9 compares the growth of the personal consumption deflators for services and durable goods. Of interest is the explosive growth in durable goods prices. 

Chart #10

Chart #10 shows the behavior of the three main components of the PCE deflator since 1995. I chose that date because it marks the debut of China as a major source of cheap durable goods for the world. As the chart shows, all prices are now on the rise, with durables leading the way after decades of falling, and services prices (which are strongly correlated to wage and salary growth) now beginning to accelerate. 

This is the very definition of true inflation: when nearly all prices rise, not just a few.

Chart #11

Chart #12

Finally, Charts #11 and #12 recap the status of swap and credit spreads. They tell us that liquidity is abundant nearly everywhere, and that the outlook for corporate profits is healthy. We are very unlikely to be on the cusp of another recession. That's the good news.

The bad news is that sustained inflation of 7-10% will cause significant problems in the months and years to come. Inflation will be a boon to federal government finances, but it will be the bane of the rest of the economy, because inflation is essentially a hidden tax that all holders of money end up paying the government. Over time that will work to sap the economy of its energy, resulting in slower economic growth. 

Wednesday, January 12, 2022

The bond market is wrong about inflation


I've been making this point for quite some time now, so the purpose of this post is mainly to update the argument with the latest news. I would also like to recommend an article by Thomas Sargent and William Silber that appeared in today's WSJ: "The Market Is Too Serene About Inflation." They make essentially the same points I do, but they nicely add some historical context. In the 1980s, it took the bond market a long time to realize that the Fed had successfully brought inflation down from double- to single-digits. What we're seeing today is similar, only opposite: it's going to take the bond market a long time to realize that the Fed has allowed inflation to increase significantly. 

And by the way, I was an avid student of inflation and the bond market back in those crazy days of the early- to mid-1980s. I worked for John Rutledge at his consulting firm (the Claremont Economics Institute) during that time, and we were almost alone in our conviction that the combination of Volcker's monetary policy and Reagan's tax cuts would result in a huge decline in inflation and interest rates. It took a few years, but we were finally proven right. So I'm not totally surprised to see the bond market making another mistake, even if the circumstances are quite different this time around.

Chart #1

Chart #1 compares the yield on 10-yr Treasuries to the year over year change in the Consumer Price Index. We've never seen such a huge difference between the two, and I for one never thought something like this would or could ever happen. Where are the bond market vigilantes when we need them? Those vigilantes are supposed to ensure that interest rates are nearly always as high or higher than the rate of inflation. That's certainly NOT the case today.

Chart #2

As Chart #2 shows, oil prices have nothing to do with today's inflation problem. Ex-energy inflation is off the charts. And to judge by the huge difference between today's inflation and today's interest rates, the bond market has only just begun to be concerned. 

Chart #3

Chart #3 shows the ex-post real yield on 10-yr Treasuries (i.e., the difference between nominal yields and the rate of inflation according to the CPI). Real yields today are lower than at any time in my lifetime. The last time we saw anything like this was in the inflationary 1970s. 

This is crucially important: when real yields are hugely negative, as they are today, this provides fuel to the inflationary fires, because the returns on cash and cash equivalents are so miserable that it destroys the demand to hold cash. And as I've explained in many prior posts, it's the weak and falling demand for money that is driving today's inflation. Inflation won't end until the Fed corrects this problem, and unfortunately, it doesn't look like they will do that anytime soon. Just today, Powell promised that although the Fed is prepared to raise rates, they will be careful to do so in a fashion that won't rock the markets or the economy. Sorry, I don't think the bond market will take a lot of consolation from this sentiment. 

Chart #4

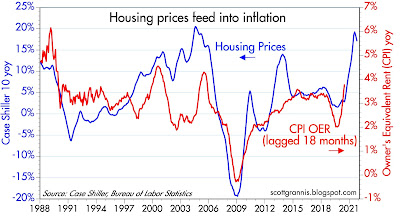
As Chart #4 shows, there is about an 18-month lag between rising rents (about 25% of the CPI is based on what homeowners think they would be paying to rent the house they own) and rising inflation. Given that rents are up only a little less than 4% in the past year, while housing prices nationwide are up about 20%, there is likely a lot of rent inflation that has yet to find its way into the CPI over the next year. 

Chart #5

And it's not just rent that is going up, as Chart #5 shows. Industrial commodity prices (hides, tallow, copper scrap, lead scrap, steel scrap, zinc, tin, burlap, cotton, print cloth, wool tops, rosin, and rubber) are up over 25% in the past 12 months, and they now stand at a new, all-time high.

Chart #6

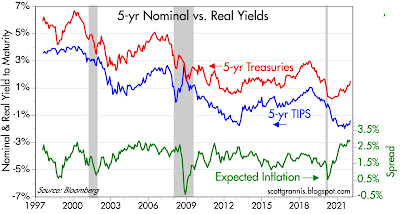
As Chart #6 shows, despite all the evidence of higher inflation, not to mention the runaway growth of the M2 money supply, as I illustrated in Chart #3 of last week's post, the bond market expects that the CPI will rise on average only about 2.8% per year for the next 5 years.

Keep your seatbelts fashioned, the next few years could be a wild ride.

COVID-19 recommended reading: This article comes from a leading Israeli virologist. The short summary: 1) respiratory viruses cannot be defeated, 2) mass testing is ineffective, 3) natural immunity trumps vaccines, 4) those vaccinated can be and are infectious, 5) Covid death risk is highly concentrated among the elderly and those with several co-morbidities, 6) vaccine side effects are not insignificant, 7) children and young adults should never have been isolated, and 8) masks and lockdowns are ineffective and counter-productive.

I can't pass up the opportunity to repeat my prediction of April/May 2020: "The shutdown of the US economy will prove to be the most expensive self-inflicted injury in the history of mankind.™"

UPDATE: links to articles should be fixed now.

Friday, January 7, 2022

Gold and the Fed


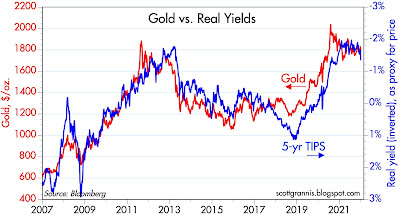
In response to a reader's comment regarding why gold prices these days are falling while inflation is rising, I offer two charts which may help. 

The bottom line is that gold prices do not react to changes in inflation, they anticipate changes in inflation. Markets are constantly trying to predict what will happen, oftentimes well in advance of the actual event. This is as it should be, of course. Otherwise it would be too easy.

Chart #1

Chart #1 compares gold prices to the real yield on 5-yr TIPS (inverted). The inverse fit between gold and TIPS yields is pretty impressive, but I caution that this fit does not apply so well to the years prior to what is shown in this chart. My interpretation of the chart begins with the observation that real yields as reflected in 5-yr TIPS are a proxy for how accommodative or tight the market expects the Fed to be in coming years. An accommodative Fed is one that will tend to push real yields lower (as happened during the period 2007 through 2011). A tight Fed does the opposite: it pushes real yields higher (as happened from 2012 through 2015). When the Fed is expected to be easy, gold prices rise in the expectation that an easy Fed today will deliver higher inflation tomorrow, and vice versa. Currently, real yields are beginning to rise from very low levels, and the gold market is weak in the expectation that a tighter Fed will deliver lower inflation in the future.

Chart #2

Chart #2 covers a shorter time frame (and I repeat my caution that these relationships do not always hold over every time period). The way to interpret the blue line is that it is a proxy for what the market expects the Fed funds rate to be in three years' time. The Fed was expected to be super-easy in late 2020 and early 2021, and that is why 3-yr forward interest rate expectations were super-low. As with Chart #1, the story here is that when the market expects the Fed to be in a tightening mode (as has been the case for the past year or so), then gold prices tend to decline because the market expects inflation risk to decline in the future. Once again, the gold market is anticipating changes in inflation conditions, not reacting to changing inflation. 

Interestingly, a strict interpretation of Chart #2 would lead one to surmise that gold prices are overdue for a decline. It will be interesting to see if this actually happens.

Thursday, January 6, 2022

The Fed is ignoring the demand for money


If, over the past 13 years that I have been publishing it, this blog has contributed anything to our collective understanding of monetary policy, it is a focus on the balance between money supply and money demand. I've simply been following in the footsteps of the great Milton Friedman, who famously said that "Inflation is always and everywhere a monetary phenomenon, in the sense that it cannot occur without a more rapid increase in the quantity of money than in output."

Curiously, this commonsense approach seems to have fallen by the wayside over the course of the past decade or so, probably because during that time the Fed engaged in unprecedented easing of monetary policy (aka "Quantitative Easing") without there being a subsequent increase in inflation. Until this year, that is, when both the money supply and inflation surged. How to explain this? In my view, it's all about supply and demand: the amount of money and the public's willingness to hold it.

Friedman described how inflation works with a simple formula: M*V = P*Y, where M is money supply, V is the velocity of money, P is the price level, Y is real gross domestic product, and P*Y is nominal gross domestic product. That's simple enough, but he also assumed (mistakenly) that the velocity of money was relatively constant, which led to his prediction that the inflation component of GDP would rise if M2 growth exceeded real output growth by some meaningful amount.

Rearranging and simplifying the first equation using the M2 version of the money supply (widely considered the best), we see that V = GDP/M2. In the past 3 decades, by this measure, the velocity of money has been anything but constant, and that apparently convinced many analysts that Friedman's theory was seriously flawed. But was it?

Chart #1

To be fair to Friedman, M2 velocity was fairly constant for a long time, as Chart #1 shows. From 1959 through the early 1990s, the velocity of M2 averaged about 1.75, which means that every dollar of M2 was spent on average about 1.75 times a year to support all the transactions that took place in the economy. That changed in the mid-1990s, however, as velocity soared and then proceeded to decline from 2001 through 2020. For most of the past 30 years, therefore, changes in the rate of growth of the money supply had little or no connection to the rate of inflation, which remained relatively low, around 2% or so. This led many observers to theorize that inflation was driven not by changes in the growth rate of money, but by other factors such as the rise of China, demographics, productivity, and/or government spending. Followers of Modern Monetary Theory went so far as to argue that the US government could borrow, print, and spend almost any amount of money without there being inflationary consequences.

My approach to making sense of all this began with realizing that the velocity of money (V) is simply the inverse of the demand for money: if you don't want all the money you have, you have to speed up your spending; conversely, if you want to accumulate money, you have to slow down your spending. Going back to Friedman's equation, I substitute D (money demand) for 1/V. This gives us D = M2/GDP. Since GDP is equivalent to national income, we can think of M2/GDP as a proxy for the amount of money (held in cash, money market funds, and various types of bank accounts) that the average person or entity wants to hold over time, expressed as a percentage of one's annual income. So instead of thinking about how fast or how slow money turns over, I prefer to think in terms of how much money people are comfortable holding in relation to their income. That can and does change, especially during times of great uncertainty when people's natural inclination is to accumulate money.

The Fed publishes the level of the M2 money supply once a month with about a 3-week lag. As of the end of November '21, M2 was $21.4 trillion, having risen by about $5.9 trillion since the end of February 2020, just before the Covid crisis blossomed. So in the space of 21 months the money supply increased by almost 38%. That's by far the most rapid growth in M2 in history, and by an order of magnitude. (Milton Friedman must be turning over in his grave!) Yet many observers, the market, and the Fed itself are declaring that the burst of inflation we've seen this year is being driven not by all the money that has been created by the banking system (remember, only banks can create money, and they do that by increasing their lending), but by supply chain disruptions in the wake of the Covid crisis. So it's just "transitory" inflation. (To be fair, the Fed of late has attempted to walk back its assertion that recent inflation is transitory, but they have yet to acknowledge that they have basically screwed up massively.)

Unfortunately, it's not easy to prove that money, not supply chain disruptions, is the inflation culprit. But common sense says that a big increase in money that is not followed by a burst of inflation implies a big increase in the public's demand for money. In the same vein, a big increase in money that is followed by a burst of inflation implies a weakening in the demand for money. Consider the price of apples. If there is an unexpectedly large harvest of apples, we would expect to see the price of apples decline. And if apples happened to be in short supply, their price would probably rise. Inflation is simply a decline in the value of the dollar, and it happens when the supply of dollars exceeds the public's demand for dollars. 

Since inflation failed to increase in the 2009-2020 period, we can infer with some confidence that the demand for money increased in line with the increase in the supply of money, and that velocity fell in inverse fashion to the increase in money supply. The same goes for the 4-5 months following the Covid crisis: money surged but inflation did not, so obviously money demand also surged. But since inflation this year has increased dramatically in the wake of the jump in money supply last year, then the demand for money over the past year must have either decreased or increased at a slower rate than the increase in money supply.

The easiest way to measure money demand is by looking at currency in circulation (which makes up about 10% of M2). Why? Because no one holds currency unless they want to hold it. If someone gave you a suitcase full of $100 dollar bills, would you simply stash it under your bed or in your closet? Of course not. Well, unless you were a drug dealer or a mafia courier. Most people would trot off to the bank and deposit the cash in their account. The bank, in turn, would most likely decide it didn't need to hold on to so much extra cash, so it would ship most or all of the money back to the Fed in exchange for bank reserves, which pay interest. Once in the custody of the Fed, those bills effectively cease to exist; they are no longer "in circulation." So whatever the amount of dollar currency in circulation there happens to be, we can safely assume that it is money that people want—for transactions, for an emergency, or, as is the case with the trillions of US cash that are held overseas, as a store of value.

Now, let's say that you wake up one day and discover that the world as you know it has suddenly changed: you no longer have a job, you can't travel, you can't go to restaurants, you can't even see your family for Thanksgiving. But politicians have been compassionate enough to realize that you still need money to live, and so they start sending you unemployment insurance checks and monthly allowances for your kids. Business owners learn that they can borrow money that won't need to be repaid as long as they don't close up shop. Would it be surprising to learn that a lot of people would end up wanting to hold extra cash in their pockets and in their bank accounts?

Chart #2

As Chart #2 shows, this is exactly what happened last year. After growing fairly steadily at 6-7% for decades, the amount of currency in circulation grew at an annualized rate of almost 23% from the end of February through the end of August '20. But after that, the growth of currency decelerated. Over the next six months, currency rose at a 10% annualized rate. And in the past three months, currency has grown at a mere 4% annualized rate. Conclusion: by this measure, the demand for money surged last year but has since declined significantly—which means the velocity of currency has picked up. And not surprisingly, inflation has also picked up. This lends support to my thesis that the demand for M2 has also failed to match the increase in M2, and that is why inflation has surged. 

Chart #3

Chart #3 shows the level of M2 less currency in circulation. Here too we see a surge in growth initially (relative to its long-term trend growth rate of about 6% per year), followed by a moderation in the pace of growth. Since August '20, however, the non-currency portion of M2 has been growing at about a 12-13% annualized rate; that's down sharply from a 43% annualized rate in the six months ended August '20 (the same period during which currency grew at a 23% annualized pace, as noted above). But it's substantially higher than its long-term trend growth rate. At the very least, this looks like the source of our latest inflation surge. And it's ongoing, which means there is very likely more inflation in out pipeline.

Let's recap what we know about M2. The currency portion of M2 has exhibited a significant decline in its growth rate over the previous year or so. This strongly suggests that money demand has weakened. The non-currency portion of M2 has also exhibited a decline in its growth rate over this same period, but its growth rate remains historically elevated. If money demand has weakened but inflation has picked up, we must conclude that the increase in M2 has exceeded the public's desire to hold M2, and inflation has been the inevitable result. 

So what is driving the growth of non-currency M2? The banking system is uniquely able to create this component of M2: not the Fed, and not Treasury. When banks lend money they do so by crediting a borrower's account with newly-minted "money." The amount they lend is a function of 1) the demand for loans and 2) banks' willingness and/or ability to lend. Given the ongoing rapid growth rate of M2, we know that the demand for loans is strong and banks these days are more willing to lend. Banks also face no constraints on their ability to lend, since the banking system has over $4 trillion in excess reserves (i.e., $4 trillion more in reserves than they need to support their current level of deposits).  

This leads to a very important point. Increased borrowing on the part of the public—and the additional money this creates—is best thought of as declining money demand, because when you borrow money you are "short" money, since you benefit if the value of the money you are borrowing declines (same goes for "short sales" of stock). Simply put: borrowing money is the opposite of holding money. If your demand for money goes down you want to reduce your holdings of money by spending more, and you can accelerate that process by borrowing. So the ongoing relatively rapid increase in non-currency M2 is actually a reflection of the public's declining demand for money

What's happening these days is a vicious circle of sorts: money demand has failed to keep with the growth in the money supply, and this has led to rising prices; rising prices, in turn, erode the demand for money, since the value of money is declining as prices rise, and all of this reinforces the public's desire to reduce money balances, borrow more, and increase spending.

This inflationary dynamic won't end until a) the Fed substantially reduces the supply of reserves to the banking system, b) the Fed substantially increases short-term interest rates (by enough to offset the erosion of money's value via inflation, c) the banking system becomes less willing to lend, and/or d) the public becomes less willing to borrow.

Having said all this, let's see how money demand is behaving:

 and Chart #4


As Chart #4 shows, money demand (M2/GDP) surged by almost 30% during the peak of the Covid crisis (first half of '20). It fell somewhat in the third quarter, and has changed little in the past year. By this measure, money demand appears to have stabilized. The world was anxious to build up its store of liquid cash in the wake of the Covid crisis, but now confidence has returned and stockpiling additional cash is not occurring.

However, this has important implications for inflation going forward, especially since M2 continues to grow at a decidedly above-average pace (about 12% annualized) and the economy's growth potential is declining now that a lot of the slack created by the Covid lockdowns has been taken up. If real growth stabilizes around 2% per year, then nominal GDP growth will have to be 12-13%% per year if the demand for money remains constant, and that further implies that inflation could be approaching 10% before too long, and thus uncomfortably high inflation could be with us for awhile. 

For example: If the demand for non-currency M2 were to return tomorrow to where it was pre-Covid, that would imply increase in the general price level of about 30%. This year's inflation could be simply a down payment on a lot more to come.


Chart #5

Chart #5 is a reminder of just how much bank reserves have grown since 2008. Prior to that, banks always held the bare minimum amount of reserves (as determined by their deposits) because reserves paid no interest. Now that reserves pay an interest rate that is determined by the Fed (currently about 0.15%), bank reserves have become T-bill substitutes—high quality, interest-bearing assets. If the Fed doesn't increase the rate it pays on reserves by enough to make holding reserves competitive, on a risk-adjusted basis, with lending to the public, banks are likely to expand their lending virtually without limits. And if short-term interest rates don't rise by enough to substantially offset the loss of the dollar's purchasing power (currently equal to inflation which is running almost 8%), then the public's desire to hold money balances will continue to decline.

So what does the market think about all this? It seems to me that the market is way too optimistic about the Fed's ability to keep things under control.

Chart #6

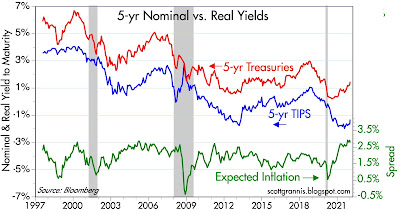
The green line in Chart #6 is what the bond market thinks the rate of consumer price inflation will average over the next 5 years: about 2.8%. This implies a rather high degree of confidence that the current inflation surge is transitory, and by inference, that the Fed will take the necessary steps to keep the supply and demand for money in balance. The blue line is the real yield on 5-yr TIPS, which is equivalent to what the bond market expects the real Fed funds rate will average over the next 5 years: -1.3%. Currently the real funds rate is roughly -4.5%, using the core PCE deflator (though it would be about -7% using the CPI). This implies a decidedly bleak view of the economy's growth potential, since real yields tend to track real growth. So the market thinks the Fed will pull the right levers, supply-chain bottlenecks will shortly disappear, and the economy will limp along for the next five years at a meager rate of growth. Not very exciting, but not very threatening either.

Chart #7

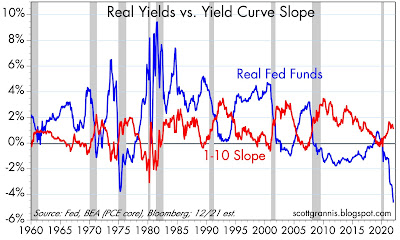
Chart #7 illustrates how monetary policy tightenings have preceded every recession in the past half century, with the exception of the Covid collapse of last year. The Fed tightens money policy by 1) raising the real Fed funds rate substantially (blue line) and 2) forcing short-term rates to rise relative to long-term rates (i.e., flattening or inverting the yield curve as shown by the red line). Higher interest rates on short-term cash balances make holding cash more attractive, thus bolstering the demand for money. 

The problem today is that short-term interest rates are essentially zero and inflation is relatively high. This means that holding cash and short-term assets is a very expensive proposition. I refer readers back to my description of how I first learned about inflation in Argentina. When you hold cash while prices rise, you are losing purchasing power, and the natural reaction of consumers in this situation is to try to minimize cash holdings by buying things now before their price rises. Money becomes like a hot potato. 

In contrast, the current stance of monetary policy is extremely accommodative, since real yields are very negative and the yield curve is not even close to flattening. In fact, monetary policy has never been so accommodative, even during the inflationary 1970s. Conclusion: if things follow this script, there is very little risk of a recession for the foreseeable future, and that helps explain why the stock market continues to rise. But there is a significant risk that inflation remains uncomfortably elevated.

Of course, both the Fed and the bond market are quite aware that tighter monetary policy could hurt the economy as it has throughout history. That explains why the Fed is only projecting that it will raise the funds rate 75 bps by the end of this year. Any more and markets might panic, they think, much as the market panicked when the Fed began tightening in late 2018. That cautious approach brightens the near-term growth outlook, but it does little or nothing to assuage inflation fears.

In the meantime, supply-chain bottlenecks do seem to be easing, so it would not be surprising to see inflationary pressures easing up a bit in the first half of this year. Any easing of inflation pressures would be taken as a thumbs-up for the Fed's currently projected policy trajectory, and thus good news for the market. But unless and until the Fed addresses the underlying causes of higher inflation—rapid money growth and declining money demand—uncomfortably high inflation will soon be back on center stage.

To be convincing to an inflation skeptic like me, the Fed needs to begin to raise real short-term interest rates by enough to make holding outsized cash balances more attractive; in short, the Fed needs to focus on doing things which increase the public's willingness to hold money. If it waits too long to do this, then they risk allowing a vicious inflationary psychology to set in. In recent weeks, especially this week, the market has begun to worry that inflation may not be transitory, and that means the Fed will have to raise rates by more than previously expected. The Fed is now expected to be a bit more aggressive than previously thought. But these are baby steps. Interest rates are still unsustainably far below the current rate of inflation. The Fed will inevitably have to do more, much more.

Eventually, higher rates will hurt the economy, but that won't happen anytime soon. The Fed is committed to a go-slow approach, and that will only prolong the problem, not solve it. The Fed needs to take money demand seriously, or else we will all pay a steep price in the form of higher inflation.

Investors need to understand this dynamic, and plan accordingly: plan for higher inflation, higher interest rates, and higher prices for things (e.g., real estate, commodities, services). Owning productive assets with ties to the real economy is not a bad place to start, and that could explain the continuing rise in equity prices.

Monday, January 3, 2022

Omicron strikes weakly


Recently we had 32 family members for our traditional Christmas Eve dinner. About two-thirds of us (my wife and I included) ended up testing positive for Covid, and I'm pretty sure we all got the Omicron variant.

Everyone thought they were healthy to begin with, and the index case was the only one of the group that was triple-vaxxed—surprises all around. Only 3 people were unvaxxed, and all 3 got it; 22 fully vaxxed individuals got Omicron, and virtually all of them had received two doses of the Moderna vaccine.  Three people had had Covid previously, but none of them caught Omicron. No one has even considered going to the hospital.

Nobody thought they were sick that evening, so we were all surprised by the ease with which the virus spread; it is indeed extremely contagious. The virus mainly attacks the muscles, the throat, and the sinuses. Very few of us developed a fever; I never did. I've had worse flues, but mainly because most of my flues were accompanied by fever and ended up with many days of coughing. I'm now six days into the infection, and my only compliant is a sore throat. I did feel very tired the first 2-3 days; muscle soreness was notable, even almost debilitating—but it quickly passed. Only a sore throat has lingered.

It was not easy to find a test kit, at least in our neighborhood. Yesterday the city offered free testing at a nearby school, and there was a line of people three blocks long waiting to be tested.

My takeaway: the MRNA vaccines don't protect you at all against Omicron. Omicron is similar to a flu. Above all, it is extremely contagious, so I won't be surprised if nearly everyone ends up getting it. A few weeks ago, I remember telling people that I wouldn't mind catching Omicron, if only because that would solidify my immunity to this crazy virus (I was fully vaxxed last February). Now that it's happened, I have no regrets. Sayonara, Covid!

We already know from the numbers that new Covid cases are skyrocketing, and I fully expect that to continue. I imagine that a significant fraction of the population will end up catching Omicron. With many millions at home sick for a week or so in coming weeks, that is bound to negatively impact the economy, but not permanently. It looks like the market agrees, since it reached a new high today. But I wouldn't be surprised if the news of millions of new daily cases doesn't shake people's confidence a some point in the near future.

And now for a quick look at some charts:

Chart #1

Chart #2

Today the market capitalization of Apple hit the $3 trillion milestone (Chart #1). I've loved this stock since the early 2000s and have featured it off and on through the years. I never thought it would come even close to this valuation, but I'm sure glad it did. 

Apple is not a complete outlier, as Chart #2 shows: its market cap is not greatly different from Microsoft's. Both have enjoyed spectacular gains over the years, and they've been jockeying for first place for more than a decade. Both are riding a technological wave of tremendous progress, and both are selling products and services to a market that now includes many billions of customers. Never before has any company enjoyed such a huge market. The other thing I like about this chart is the way it shows how Apple, once a David to Microsoft's Goliath, triumphed in the end.

P.S. I've been working on an update to my money supply/inflation thesis for the past few weeks, and hope to publish it soon.