Tuesday, September 27, 2022

Everything's down except inflation


And that means inflation has peaked and will be headed down in the months to come.

Inflation as measured by government indices (e.g., CPI, PCE Deflator) is a lagging indicator of true inflation. True inflation is defined as the loss of purchasing power of a currency. Right now that is just not the case: the dollar is soaring against nearly every currency in the world and virtually all commodity prices are collapsing.  Don't pay attention to inflation; pay attention to sensitive market-based prices—they tell you where inflation is headed.

The Fed was very slow to see the inflation problem which showed up in surging M2 growth in 2020, and they are being very slow to see that inflation fundamentals have improved dramatically this year.

Chairman Powell has it all wrong: the way to kill inflation is not to kneecap the economy, it's to reduce the supply of money and increase the demand for it by raising interest rates. The Fed has already succeeded in doing that! There's no reason at all that we need a recession to get inflation down. In fact, a growing economy can actually help to bring inflation down by increasing the supply of goods and services. I just don't see the Fed continuing on the inflation warpath for very much longer.

This bad Fed dream will be over soon. This is not the time to be cashing out of risk assets.

Chart #1

The dollar is very strong and rising against virtually every currency in the world (Chart #1). That means that most prices outside our borders are going down. Come to Argentina, where I am at the moment, and you won't believe how cheap things are. Great wine for  $3-5 per bottle. Steaks for $3. A 1-mile Uber ride for $1.  Tip a cabby with 1000 pesos (the largest-denomination bill, but worth only $3.33 US) and they will sing your praises. We have a 3-room suite in a nice hotel for only $70 a night. To worry about US inflation at a time like this is crazy.

Chart #2

The M2 money supply (Chart #2) has risen at a paltry 2.3% annualized rate over the past 9 months, and M2 has been flat for the past 6 months. If rapid M2 growth beginning in 2020 was the fuel for inflation (very likely), then the inflation fires are already dying down. The surge in M2 that began in 2020 was the spark that triggered rising inflation about a year later; the lack of M2 growth that began late last year will undoubtedly result in a decline in measured inflation before year end. 

Chart #3

The CRB Raw Industrials index (Chart #3) is down 18% since its early March high. Nearly every commodity has exhibited the same behavior, as the following charts show.

Chart #4

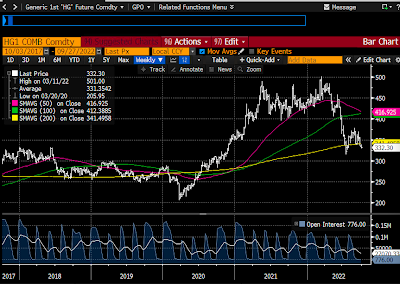
Chart #4 shows copper prices, which are down 35% since March. "Dr. Copper" is telling us that the Fed has no reason to worry. But maybe they should worry because they are threatening a whole lot more tightening when none is needed. This is what is called "closing the barn door after all the horses have left."

Chart #5

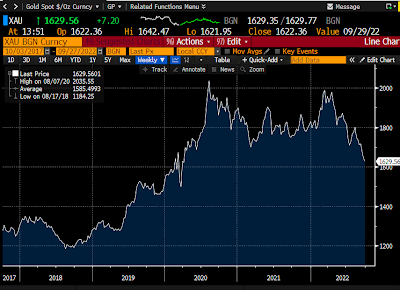
Chart #5 shows gold prices, which are down 22% from last March's high. Gold is traditionally very sensitive to changes in monetary policy. This is a strong signal that the Fed may have already tightened too much.

Chart #6

Chart #6 shows crude oil prices, which are down a whopping 35% since mid-June. This is a very significant decline that will have the effect of lowering the prices of all things that depend on energy.

Chart #7

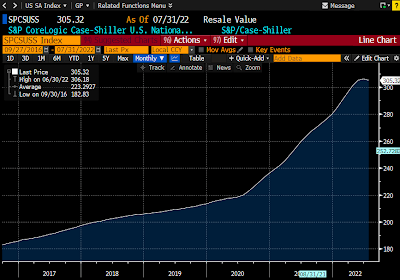
Chart #7 shows the best measure of US housing prices. Note that prices stopped rising a few months ago according to this measure. However, since the index is based on an average of prices over the previous three months, it's quite likely that the actual peak in housing prices happened some time in the March-April time frame. And it's not at all surprising that housing prices have peaked considering that mortgage rates have more than doubled so far this year (most recent quote is 6.7% for a 30-yr fixed conventional mortgage). This is how monetary policy impacts prices and inflation: higher rates increase the demand for money and reduce the demand for borrowed money; people become much less anxious to own things when interest rates are high. It's better to hold on to your money than spend it; better to rent than buy, which is why rents are increasing as housing prices soften. 

Chart #8

Finally, as Chart #8 shows, the market's expectation for what CPI inflation will average over the next 5 years has now fallen to 2.33% (the bottom half of the chart), thanks to a huge increase in market interest rates (top half, representing 5-yr Treasury yields and 5-yr TIPS yields. 

Markets these days are a lot more worried that the Fed will needlessly kill the economy than that inflation will do anything but decline. 

UPDATE: We've been in Argentina for a week now, and it's painful to see the sorry state of the economy and the abysmal level of prices. Food here costs about one-fourth what it does in the U.S., not because unemployment is high (which it is), but because no one earns enough to afford to spend more. Those pundits who argue that the Fed needs to tighten by enough to push unemployment higher so that inflation will come down should come to Argentina to see the results of high unemployment. Prices for basic things may be low, but the inflation rate here is about 100% a year. Anything produced outside of Argentina comes in at international prices, and sooner or later the prices of basic things will necessarily rise to international levels. Things are cheap here only temporarily. The lower and middle classes are being robbed of their purchasing power by inflationary monetary policy, and the only one benefiting from the theft is the government. That's called the inflation tax. The government prints money to pay its bills, and anyone who touches that money loses purchasing power on a daily basis, while on the other side of the coin the government gets to keep on spending. Bottom line: Argentine M2 is growing by leaps and bounds—70% a year at last count, whereas in the US, M2 is flat. The US is on the cusp of disinflation, while Argentina is on the cusp of hyperinflation.

If higher unemployment were necessary to bring inflation down, Argentina would be suffering from deflation by now.

Monday, September 19, 2022

More predictors of lower inflation


The whole point of tightening monetary policy is to increase the demand for money and/or decrease the supply of money at the expense of other things. Tighter monetary policy today serves to balance the supply of money with the demand for money, and that is what will deliver low and stable inflation. Higher interest rates increase the appeal of holding cash and cash equivalents, and at the same time they discourage the borrowing and spending of money (and thus tend to depress prices). Unfortunately, nobody knows (not even the Fed) how high interest rates have to rise in order to slow and ultimately reverse the recent rise in inflation.

So we (and the Fed) must instead rely on old-fashioned methods such as watching prices. Continuously rising prices are a clear sign that interest rates are too low and/or monetary policy is too easy. Falling prices, on the other hand—if sufficiently widespread—are a pretty good indicator that monetary policy is gaining traction and thus helping to bring inflation down.

Such is the case today. So far this year we have seen significant declines in a number of prices and markets, and here are just a few that are down significantly: stocks, commodities, foreign currencies (see Chart #1 in my last post), TIPS, bonds in general, and used cars, the latter of which have declined by 18% in real terms (see Chart #1). Though not down year to date, gasoline prices are down 27% since their peak last June. 

Chart #1

Since reliable measures of housing prices take months to show up, it's best to look at indicators that update more frequently, such as mortgage refinancings, which have plunged to levels not seen since 2000, and new applications for mortgages, which have dropped by 43% since the peak of early 2021. Both of these are symptomatic of what we would expect from higher interest rates: reduced demand for borrowed money. The rise in housing prices which began about 18 months ago coupled with sharply higher mortgage interest rates (Chart #2) has caused housing affordability to plunge to levels not seen in over 30 years (see Chart #3), and there is little doubt this has arrested the boom in the housing market, which can be seen in a sharp decline in applications for new mortgages (Chart #4). Home prices are almost certainly falling on the margin and we saw a hint of that in the August numbers. 

To be sure, even though the bloom is off the housing rose, and prices are weakening on the margin, rents have been slow to catch up to the rise in prices. I would expect to see rents rising for at least the next 9 months, and this will add to measured CPI inflation. But rents are a lagging, not a leading indicator (if for no other reason than that rents are infrequently adjusted as leases expire); the important thing is housing prices which change daily. Rents don't cause inflation, and neither do wages; only excess money causes inflation, and there seems to be a lot less of it recently, which is great news.

Chart #2

Chart #3

Chart #4

TIPS prices are down sharply because real yields are much higher, having risen from a low of -2% on 5-yr TIPS to now 1.2% (Chart #5). That's because TIPS are an inflation hedge, and in the presence of tight money the demand for inflation hedges should decline. This might be the best chart of all, because the "tightness" of monetary policy can be measured directly by the level of real yields. There is no question but that the Fed's policy stance has gained traction significantly and is thus affecting markets all over the world. Icing on the cake: Chart #5 also shows how inflation expectations have declined this year, from a high of 3.7% in early March '22 to now 2.5%.

Chart #5

Meanwhile, supply chain bottlenecks are clearing up rapidly, thus facilitating the supply of goods, and in turn tending to lower their prices. For example, the Baltic Dry Index (an index of shipping coasts in the eastern Pacific) has fallen by 72% since its peak last October. Where there used to be over a hundred container ships anchored off the coast between San Clemente and Palos Verdes waiting to unload, there are now just a handful.

In Chart #6, note how builder sentiment has fallen dramatically in recent months. This likely reflects decreased housing demand, soaring mortgage rates, and softer prices, and that further presages a slowdown in housing starts (and weaker demand for construction materials), some of which we have already seen.

Chart #6

A CPI report is old news by the time it's released. Indicators such as the above tell you where the CPI is headed.

Friday, September 16, 2022

The dollar's strength is telling Powell to chill


Here's my understanding of the current collective wisdom of the market:

  • Both inflation and the US economy are "running hot."
  • The Fed needs to boost rates dramatically to slow the economy and bring down inflation.
  • The US economy is very likely to suffer another recession as a result.
  • The outlook is not so terrible, however, since once it is clear that inflation is under control the Fed will be able to lower rates.
  • The Fed will hike the funds rate to a peak of 4.5% over the next 6-7 months, then cut rates to 3.75% by mid-2024.
  • Inflation, currently running about 8%, will fall back to 2% or so by the end of next year

As I've pointed out in previous posts, however, the Fed and the market are ignoring some very obvious signs which strongly suggest that the Fed's best course of action is to NOT follow this script: 1) the dollar is extremely strong, 2) commodity prices are falling, 3) the M2 money supply has not grown at all for the past 6 months because the federal government is no longer sending Covid stimulus checks to the public, 4) measured inflation is already declining, and 5) inflation expectations have declined significantly, down 120 bps since early March (inflation expectations peaked at 3.69% and are now 2.49%). Moreover, yesterday FedEx shocked the market by suggesting that demand has all but collapsed. All of this suggests money is already tight enough to impact the economy, and more could be destructive.

The market is telegraphing that what the Fed is planning to do is potentially destructive to the economy. Why does the Fed still think the only way to lower inflation is to undermine the economy? That's Phillips Curve thinking, and it has been debunked countless times. Growth doesn't cause inflation. Too much money is the culprit (i.e., money that exceeds the demand for it). What the Fed needs to do in cases like today's is to 1) bolster the demand for money by raising interest rates (they have accomplished that goal already!), and 2) reduce the unwanted supply of money (something that is well underway since the M2 money supply stopped growing long ago). 

If the Fed were to follow the market's script, we could see real problems develop. The US economy could weaken dramatically, creating a double whammy for the working class: rising unemployment on top of already-declining real wages. This is totally unnecessary.

I have to believe they won't follow through on their hiking hysteria. And that should prove very positive for the economy and the market.

A few charts to illustrate the situation with the dollar:

Chart #1

Chart #1 shows two measures of the trade-weighted, inflation-adjusted value of the dollar. Each uses a different basket of currencies: major currencies vs. most currencies. The dollar today is within inches of its all-time highs according to these measures. It's not healthy for the dollar to be this strong, because it is symptomatic of very restrictive monetary policy. Sure, European currencies are weak because their economies are at risk with the Ukraine-Russia conflict. It's logical that Europeans would rather hold dollars, and the Japanese too (the yen is plunging). That's fine, but the Fed should figure this into its calculations: increased demand for dollars with the dollar at all-time highs calls for looser, not more restrictive Fed policy.

Chart #2

Chart #2 compares the price of gold with the real yield on 5-yr TIPS. Real yields are a direct measure of the relative tightness or easiness of Fed policy. The Fed tightens by causing real yields to rise (shown here by a drop in the blue line), and tight monetary policy from the Fed makes gold less attractive since it yields nothing in comparison. Tight money has always caused gold prices to decline, while easy policy feeds into rising gold prices. 

Chart #3

Chart #3 compares real and nominal yields on 5-yr Treasuries, with the difference being the market's expectation for what CPI inflation will average over the next 5 years. Inflation expectations have averaged a very modest 2.5% for more than a year, despite the big increase in inflation we've lived through. This can only mean that the market realizes that the current inflation is a one-off phenomenon that is very likely to reverse in the near future. 

Note also that the last time TIPS yields were as high as they are today was in late 2018. Check out my posts from back then, here and here. This episode was reminiscent of today, in that both times the Fed was hell-bent on tightening policy at a time when the market was warning that a tightening was not needed—and stocks crashed both times. The Fed finally reversed course in early 2019, that unleashed the economy. We can only hope they will do this again!

Chart #4

Chart #4 compares the price of gold to the value of the dollar (inverted on the chart). A strong dollar has always been bad for gold, and a weak dollar good for gold. If the Fed hikes rates aggressively from here the outlook for gold and many other commodities looks quite bleak.

Chairman Powell, you need to take a chill pill, and the sooner the better. Please don't give us aggressive tightening rhetoric at next week's FOMC meeting. 

Wednesday, September 14, 2022

Inflation pressures are in fact cooling ...


... contrary to what you are hearing in the press, which loves to sensationalize things.

There is abundant evidence that inflation pressures are cooling: Non-energy commodity prices are soft (see my last post for lots of charts). Oil is down over 25% in the past four months. The dollar is very strong. Inflation expectations are relatively low and stable (averaging about 2.6% for the past 2 ½ months). Housing prices and new mortgage applications are falling because mortgage rates have doubled so far this year (this means Fed rate hikes are getting lots of traction). Rents are still on the rise, but they are a lagging indicator (rents rise about a year after prices rise, so they will likely begin to stabilize about 6-9 months from now, because prices started falling a few months ago).

Yes, on a year over year basis, it looks like consumer price inflation is still on the rise. But on a 6-mo. annualized basis, which is best for picking up changes on the margin, inflation is falling.

Above all, I can't emphasize enough that this inflation flare-up was not caused by a Fed policy error: it was caused by the federal government's attempt to soften the blow of Covid lockdowns with massive, deficit-financed transfer payments that inflated the money supply. That mistake ended over a year ago, and M2 money supply growth has since decelerated significantly. So the fundamental reason for our current inflation has long since begun to fade in importance.

I've been saying for months now that inflation pressures have peaked, and I still think that's the case. But I've also said that inflation would remain uncomfortably high, probably through year-end, because of all the inflation "in the pipeline" which takes awhile to work through the economy. So we need to be patient.

What this means is that the Fed is not going to have to tighten much more than it already has. A 75 bps hike at next week's FOMC meeting might be enough. That in turn implies that the market is overly-concerned about the downside risks to the economy. This is no time to panic. Are you listening, Chairman Powell?

Chart #1

Chart #1 is an update of a chart I featured some months ago. It is critically important because it shows that the huge increase in the M2 money supply coincided exactly with a huge increase in the federal budget deficit, which in turn was caused by multiple trillions of dollars of Covid-related transfer payments. This is no longer happening. 

Chart #2

As Chart #2 shows, the problem all this extra money created (inflation) is resolving itself as people spend down their extra (unwanted) money balances. Crushing the economy with tight money now is not the solution. What the Fed needs to do is to simply raise rates by enough to slow the decline in the demand for money. They have already done that, as evidenced by all the market prices that are softening everywhere. Higher interest rates work directly to increase the demand for money (and by inference to decrease the demand for borrowed money). This is the way monetary policy works in an era like today, which began in late 2009 when the Fed decided to pay interest on bank reserves. Before, the Fed had to raise interest rates indirectly by creating a scarcity of bank reserves, and while that worked to increase the demand for money it also created a shortage of liquidity, which can have many collateral and damaging effects in the financial markets.

If money balances (represented in the chart by the ratio of M2 to nominal GDP) don't decline dramatically, the economy can gradually absorb extra money as inflation declines moderately. And along the way, sudden attacks of panic like we saw yesterday work to increase the demand for money, thus minimizing the inflationary potential of extra M2. 

Chart #3

Chart #3 compares the 6-mo. annualized change in the CPI vs the 6-mo. annualized change in the Core CPI (ex-food and energy) through last month. By this measure, inflation in both series has peaked. 

Chart #4

Chart #4 compares the 6-mo annualized change in the CPI and the ex-energy version of the CPI. Energy prices are by far the most volatile component of the CPI, so using this version helps see through the noise. Again, by either measure inflation looks to have peaked a few months ago. 
 
Chart #5

Chart #5 shows the 6-mo. annualized change in the Producer Price Index vs the Core version of the same. Here again it looks like inflation has peaked. This is significant, because producer prices capture inflation earlier in the pipeline than the CPI. The same story is playing out in the commodity markets, where prices have been declining for months; sooner or later those declines will be passed through to the consumer in the form of more stable and possibly lower prices. 

Chart #6

Chart #6 shows the level of real and nominal 5-yr Treasury yields and the difference between the two, which is the bond market's expectation for what the CPI will average over the next 5 years. I note also that the blue line (the real yield on 5-yr TIPS, currently about 1%) is a proxy for the average inflation-adjusted level of the Fed funds rate over the next 5 years. We haven't seen such a high level for a long time. Real yields were much higher in the late 1990s and through much of the 2000s, but that was because the economy was a lot stronger than it is today—a sustained, high level of real yields requires a sustained, high level of real growth. It's tough to see real yields moving much higher than they are today given all the headwinds the economy currently faces: rising tax and regulatory burdens, expensive energy, geopolitical turmoil, and uncomfortably high inflation.

Of course, if the Fed were to aggressively tighten by pushing real yields to, say 2%, then that would likely cause a recession. Recall that all recessions in the past 50 years or so have been preceded by very high real interest rates which were the direct result of Fed tightening actions. Very high real yields accompanied by an inverted yield curve and very high credit spreads are the basic ingredients for a recession. Today we only have one of those ingredients present: an inverted yield curve. That's why I'm reluctant to say that the economy is in a recession. 

Chart #7

Meanwhile, 2-yr Swap Spreads remain my go-to guide for how much the economy is suffering as a result of stresses in the financial markets. As Chart #7 shows, these spreads are somewhat elevated, but not nearly as much as we have seen in past episodes of great financial and economic stress. Note how swap spreads tend to rise in advance of recessions and in advance of recoveries; they are great leading indicators. In a "normal" world, you would expect to see swap spreads range between 10 and 30 bps. (See my swap spread primer for more background.)