Monday, March 31, 2014

Key indicators still positive

Here's a quick update of some key indicators that I track regularly. All continue to point in a positive direction.


Swap spreads are a great coincident indicator of financial market health and an equally great leading indicator of the health of the economy. They have been trading at very low levels for more than a year. This indicates that financial markets are extremely liquid and that systemic risk is very low. This, in turn, is a good sign that the outlook for the economy is positive. If financial fundamentals are in very good shape, it is likely that the economy will also be in good shape in the months to come.


Swap spreads are relatively low in the Eurozone as well, though somewhat higher than in the U.S. That is not surprising given the ongoing problems in the peripheral countries of the Eurozone. Regardless, the level of Eurozone swap spreads suggests that financial markets have not been destabilized by the troubling situation in the Ukraine, and that is good news.


For over a year, the prices of gold and 5-yr TIPS have been reasonably well correlated. Both have been declining (the chart above shows the real yield of 2-yr TIPS—inverted—as a proxy for their price) since early last year. I take this to be a sign that the market's demand for safe assets has declined, and that in turn is a sign that confidence is returning, and market participants are becoming somewhat less risk averse. Risk aversion has been one of the major headwinds that the economy has been facing since 2008.


Initial weekly claims for unemployment are a good indicator of the health of the labor market and businesses' appetite for risk. Claims are quite low and continue to fall, which suggests that labor market conditions are healthy and businesses see little need to downsize or reduce their risk.


Gold and commodity prices have been well correlated for a long time, but gold prices appear to have overshot commodity prices beginning about four years ago. For the past three years, commodity prices have been relatively stable, while gold prices appear to be slowly "relinking" to commodity prices. Falling gold prices tell me that speculative fears are gradually diminishing, while stable commodity prices tell me that the global economy remains relatively strong. If the Chinese economy were collapsing, as many seem to fear, commodity prices would not likely be this strong. If the situation in Ukraine posed existential risks to the rest of the world, gold prices would be rising, not declining.


The Vix index is a good proxy for the market's level of fear and uncertainty. The Vix has been relatively low and stable for the past year, which in turn suggests that the outlook for the economy has become less uncertain. Reduced uncertainty is a precondition for greater risk-taking, so this bodes well for the future.


The difference between the nominal yield on Treasuries and the real yield on TIPS tells us a lot about the market's inflation expectations. As the chart above shows, inflation expectations today are very similar to what they have been in the past 14 years. Stable inflation expectations and rising yields therefore mean that the rise in yields that began about a year ago has been driven by a rise in real yields. Higher real yields, in turn, reflect the market's belief that the outlook for the economy has improved. (If real yields had not risen as much as nominal yields that would have suggested that rising inflation fears were driving yields higher.)


U.S. and Eurozone equity markets continue to be well correlated, with the U.S. market doing noticeably better than the Eurozone since the outbreak of the Eurozone sovereign debt crisis a few years ago. Both markets have been moving up in sync since mid-2012, which suggests a synchronized recovery is underway, although the Eurozone is lagging. 


Credit default swap spreads are highly liquid indicators of the market's perceived level of default risk in the economy. Investment grade and high-yield CDS spreads are very close to post-recession lows, but still somewhat higher than their pre-recession lows. This suggests some lingering risk aversion, which is consistent with my view that markets are become less risk averse and more prone to seeking out risk on the margin. The spread between high-yield and investment-grade CDS (second chart above) tells the same story. Overall, credit spreads tell us that the economic fundamentals are reasonably healthy and there has been no meaningful deterioration on the margin in recent months.

In the absence of any noticeable deterioration in these key indicators, and given that they all reflect healthy financial market and economic fundamentals, it is not surprising that the prices of risk assets continue to edge higher, especially since the yield on most risk assets is significantly higher than the yield on cash.

Thursday, March 27, 2014

Corporate profits continue to impress

With today's revision to fourth-quarter GDP statistics (which were not surprising and do not change the picture of modest growth and low inflation) comes our first look at corporate profits for the period. After-tax corporate profits, according to the National Income and Product Accounts' calculation, rose 8% last year to reach a new all-time high of $1.74 trillion. Based on this measure of profits, equities still look attractive.


As the chart above shows, after-tax corporate profits have grown substantially faster than nominal GDP since 1989.


After-tax corporate profits as a % of GDP (see chart above) are now at their highest level ever. One of the main arguments against buying corporate equities today is that profits relative to nominal GDP are likely a mean-reverting process—so they are very unlikely to continue growing at their recent pace, and could in fact decline significantly relative to GDP in the years to come. I've point that out for the past several years, but profits just continue to rise. Of course, this only gives more ammunition to the bears.


The chart above compares the two principle measures of after-tax corporate profits: one uses the NIPA method which attempts to measure true economic profits (using only data supplied to the IRS in corporate tax filings) and adjusts for capital consumption allowances and inventory valuation); the other is reported earnings per share. Both y-axes are adjusted to reflect a similar rate of growth. I've discussed why the two measures of profits diverged beginning in 1990 here. I think the NIPA measure of profits is superior (HT to Art Laffer, who has been preaching this for as long as I can remember); nevertheless they are both telling approximately the same story. Or are they?


The first of the two charts above shows the PE ratio of the S&P 500 using reported profits (with Bloomberg as my data source). This shows that PE ratios today are only a little above their long-term average. The second chart calculates the PE ratio for the S&P 500 using NIPA profits instead of reported profits. I've normalized this ratio so that the long-term average of the two charts is the same. The NIPA method reveals that PE ratios—which have risen significantly in recent years—are still substantially below their long-term average, which in turn suggests that equities today are attractively valued. (For a discussion of how this compares to Shiller's CAPE method, see here.)

Here's my main point: profits are at record levels by any measure, but PE ratios are average or below average. This is one of the key reasons I think that the market is still priced to very pessimistic assumptions about the future. Equities today are priced to stagnant or declining profits—they are not overly enthusiastic.


Let's go back to the issue of profits having reached all-time highs relative to GDP. Shouldn't we at least feel a little nervous about a mean-reversion process taking hold at some point? To answer that question, I put together the above chart, which shows how after-tax U.S. corporate profits compare to world GDP. Here we see that there is nothing unusual going on. Global profit margins haven't budged for over 10 years. What's happened is that world GDP has grown much faster than U.S. GDP, and U.S. corporations have cashed in on the boom. Today, a greater portion of corporate profits is coming from overseas, where markets and opportunities are much more dynamic than here at home. Apple can sell iPhones to billions of customers all over the world today, whereas it could only address a much more limited market in the past—primarily the developed countries. Seen from this perspective, there is much less reason to worry about stagnant or declining profits.

Wednesday, March 26, 2014

Growth outlook remains modest, and that's bullish

As we emerge from the bad winter weather in the Eastern part of the country (the West has enjoyed a very mild winter), some areas of the economy—construction, factory orders, employment—are likely to pick up. But the overall outlook for the economy remains modest; growth is likely to continue in the 2 -2.5% range that we have seen in recent years, though it might tick up a bit to 3%. In any event, 2-3% growth is hardly something to cheer about when the economy continues to carry the potential to be some 10% stronger. But that's not necessarily bad news.

Here are some charts with recent updates that continue to suggest we will see 2-3% growth for at least the next year.


New orders for capital goods (above chart) have been relatively flat for the past year. Even though they have managed to eke out a new high in nominal terms, capex orders are still about 20% below their inflation-adjusted high that was reached fully 14 years ago. Business investment has been unimpressive for quite some time, even though corporate profits have reached an all-time, and previously unimaginable high relative to GDP. It is this lack of investment (driven, as I have argued, by a lack of confidence and a general aversion to risk) that has given us lackluster gains in employment and in productivity. Without new investment in productivity-enhancing capital goods, worker productivity is going to continue to be lackluster, and this amounts to a fundamental headwind to stronger growth.


If productivity continues to plod along at the 1% annual pace of recent years (see chart above), and if the labor force manages to grow 1% per year (it has only grown at about half that pace in the past two years, but it averaged about 1% annual growth prior to 2009), then we shouldn't expect to see real growth do much better than 2-2.5%. (Add the growth rate in the labor force to the growth rate in the productivity of that workforce and you get a rough approximation of overall real growth.)  


The first of the above charts shows the Chemical Activity Barometer, which has been calculated and published by the American Chemistry Council since 1919. As Calculated Risk has pointed out, there's a pretty good relationship between this index and industrial production, with the CAB index tending to lead. As the second of the above charts shows, there is also a pretty good fit between growth in the CAB index and real GDP growth. The CAB index has grown about 2.5-3% over the past year, and that points to real GDP growth of about 2-3%. Steady but lackluster growth.


2% or even 3% GDP is nothing to get excited about. But it could be a lot more than what is priced into the market, and if so, then a continuation of modest growth could end up being good news for equities. The chart above compares real yields on 5-yr TIPS to the 2-yr annualized growth rate of GDP. It's reasonable to think that these two variables should follow a similar pattern over time. Strong and sustained GDP growth such as we saw in the late 1990s should result in relatively high risk-free real yields on TIPS (which are guaranteed by the U.S. government), whereas sluggish growth should correspond to low real yields on TIPS. And indeed, real GDP grew at a 4-5% rate in the late 1990s, while real yields on TIPS were just under 4%. As GDP growth has ratcheted down over the years we have seen real yields also fall. But today's level of real yields seems very low compared to the real growth of the economy. Why accept a guaranteed loss of your purchasing power by buying 5-yr TIPS with a real yield of -.5%, when you can expect to earn at least a 2-2.5 real yield by buying anything exposed to real economic growth?

I think the market is still priced to very pessimistic assumptions. If I'm right, then real growth of 2 or 3% should result in equity prices—and interest rates—moving higher.

Tuesday, March 25, 2014

Confidence slowly returns

This has been the weakest and most risk-averse recovery ever. But we are still in a recovery, and risk-aversion is slowly being replaced by risk-seeking, just as fear is subsiding and confidence is recovering from extremely low levels.


Today the Conference Board reported that its March survey of consumer confidence reached its highest level since the Great Recession. As the chart above shows, despite the substantial improvement in confidence, confidence is still at levels that were associated with recessions in the past. We've made a lot of progress, but this is hardly what you would call an enthusiastic or overly exuberant recovery. It will likely take years before confidence reaches levels that would be associated with optimism.


New single-family home sales, shown in the chart above, have increased about 50% from their lows of three years ago. That's a big gain, but sales are still abysmally low from an historical perspective. Still, it's a recovery, and we are likely still in the early stages of the housing market recovery.


The housing market hasn't made much progress in the past year, but builders remain reasonably confident in the future. Bad weather has held back a lot of activity, but that is passing and we should see more gains reported in the months to come.


The above chart shows how gold prices and real yields on TIPS have moved together over the past several years. I've inverted the real yield scale for TIPS in order to have a proxy for TIPS prices (rising real yields equate to falling TIPS prices). The price of gold and the price of TIPS have both declined significantly in the past year, and I think this is a good sign that the world's demand for safe assets is declining. This is equivalent to saying that the world is becoming somewhat less risk-averse. Risk aversion is giving way to risk-seeking, albeit slowly. We're still in the early stages of a recovery, still far from reaching the late, overly-optimistic stage. Consumer confidence, gold prices, and TIPS prices are all saying the same thing.


The PE ratio of the equity market says the same thing: things have improved in recent years, but pricing is still reasonable from an historical perspective. No signs yet of irrational exuberance.
In order for there to be real, substantial improvement in the economic outlook I think we need to see signs of important changes in fiscal policy, such as reduced regulatory burdens, tax reform, and lower marginal tax rates, particularly for businesses. Until then, the economy is quite likely to continue growing at an unremarkable, 2-3% pace. The economy has been doing so for a little more than 4 years now; growing and pushing ahead in spite of some significant headwinds in the form of monetary policy uncertainty, mounting regulatory burdens, and rising tax rates.

Many argue that the economy has been growing only because of massive monetary and fiscal policy "stimulus." I think that's just plain wrong. To begin with, monetary policy has no ability to create growth; growth only comes about when the existing factors of production are used more efficiently and more productively.

The Fed hasn't been stimulative at all—it's mainly worked overtime to convert notes and bonds into bank reserves (the functional equivalent of 3-mo. T-bills) to satisfy the world's tremendous appetite for safe assets. Meanwhile, the growing mountain of excess reserves in the banking system has created great uncertainty about the future: will the Fed be able to reverse QE in a timely fashion, or will the banking system use its excess reserves to create too much new money?


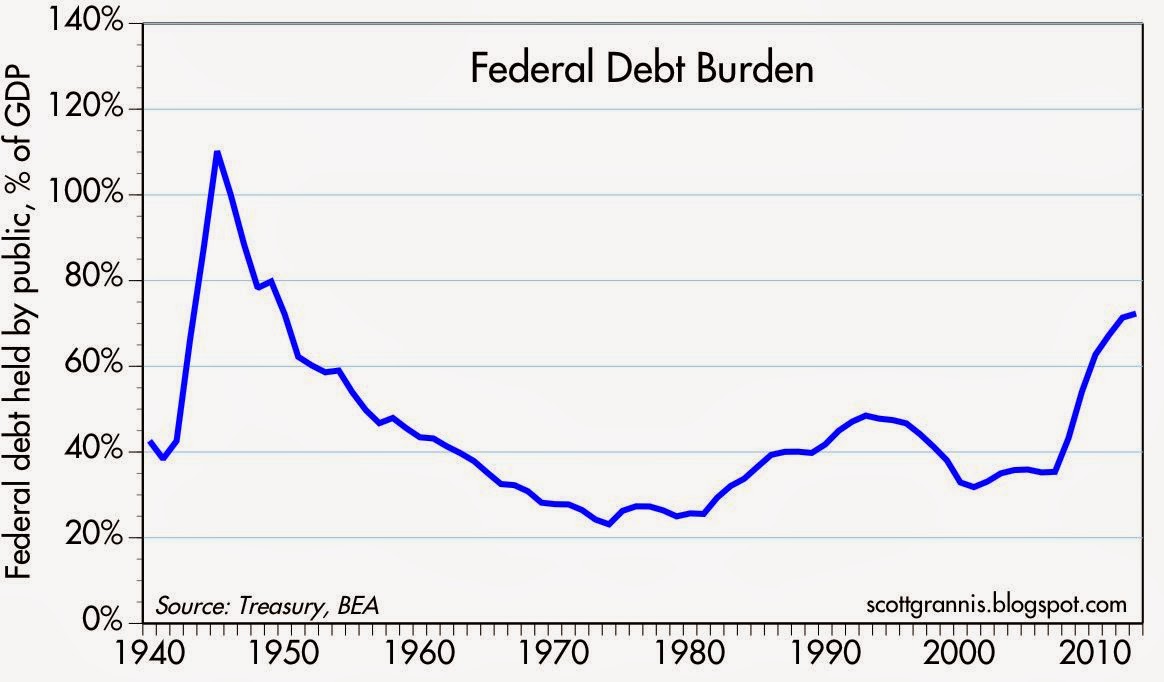
Fiscal "stimulus" hasn't been stimulative either, more than 75% of the ARRA stimulus spending was just transfer payments—taking money from one person and giving it to another. That can't possibly stimulate growth; in fact, it can hurt growth because it creates perverse incentives (i.e., penalizing the productive, rewarding the unproductive). What all the spending did do was create a huge increase in outstanding federal debt, and that in turn told the private sector that the expected burden of future taxes had increased significantly.

Monetary policy has kept fear and anxiety about the future alive, while fiscal policy has smothered the private sector with regulatory burdens (e.g., Dodd-Frank and Obamacare) and higher taxes. It's a testament to the inherent dynamism and vitality of the U.S. economy that the it has managed to grow as much as it has.

I'm an optimist mainly because I see so many things that are wrong today but that could be changed for the better in the future.


Just a few small changes could have huge, positive consequences. If we dropped the corporate tax rate to, say, 15%, corporations might repatriate many hundreds of billions (even trillions) of profits that they are holding offshore. One reason this has been a weak recovery is that business investment has been weak (which is why jobs growth has been weak) despite the fact that corporate profits have never been so strong (see chart above). Businesses with substantial overseas sales are loathe to pay 35% just for the privilege of repatriating their profits, on which they've already paid overseas taxes. A lower tax rate would instantly improve the competitiveness of U.S. businesses, boosting sales and eventually boosting jobs. It's silly to worry about what a cut in the corporate tax rate might "cost," since corporate tax receipts have been a mere $287 billion in the 12 months ended February—just 11% of total federal revenues. It's better to think of the benefits it would bring, in the form of new investment, new jobs, and rising incomes. You don't have to be a supply-sider to understand that a bigger economy and a bigger tax base could generate enough revenues to offset most or all of the revenue "lost" to a lower corporate tax rate.

One simple change to the tax code could have a transformative impact on the healthcare industry. All we need to do is allow everyone, not just employers, to deduct the cost of healthcare insurance. Another simple change with a huge impact would be to allow insurance companies to sell policies across state lines. Making it easier for individuals to buy their own policies would get rid of the "third party payer" problem, by introducing market-based incentives and competition to an industry that for the past 70 years has been overly regulated by the federal government and distorted by shielding consumers from seeing the true prices of the healthcare services they consume. Make it easy for individuals to buy their own policies and we would fix the portability problem and most likely end up with more people insured.

When fundamental change for the better is so easy, it doesn't make sense, in my view, to be pessimistic because the recovery continues to be disappointingly slow.

Friday, March 21, 2014

How much are yields going to rise?


The chart above shows Treasury yield curves past, present, and future, as calculated by Bloomberg. The date I chose for the past (April 30, 2013) marked the modern-day, all-time low for the 10-yr Treasury yield (1.6%). At the time, the Fed was half-way through its Operation Twist—buying 10-yr Treasuries and selling short- and intermediate-term Treasuries in an attempt to flatten the yield curve. QE3 wouldn't start until four more months or so. Economic growth had slowed meaningfully in the first half of last year, registering only 1.3% in the first quarter and 1.6% in the second quarter of 2013. The Eurozone was in a recession, the ISM index was disappointing, and retail sales were weak; the market didn't hold out much hope for the U.S. economy and so yields collapsed.

In the past year, the economic outlook has brightened, and yields have risen across the board. The Eurozone has come out of its recession, the Fed is winding down (tapering) QE3, there is no sign of recession, GDP growth has picked up, and stocks are 15% higher. 10-yr Treasury yields are up about 100 bps, even though QE3 has been in place throughout. Looking ahead, the bond market currently is pricing in a further increase of 60 bps in 10-yr yields over the next two years. Short-term rates, currently near zero (0.05% for 3-mo T-bills) are expected to jump to 3.3% in five years, at which time the yield curve is expected to be quite flat. In short, the market is pricing in at least 300 bps of Fed tightening over the next five years, and as much as 100-125 bps of tightening within the next two years.

The point of looking at future expected interest rates, which can be derived mathematically from today's yield curve, is to appreciate how much of an increase in future interest rates the market has priced in today. If future rates end up being equal to what they are expected to be, then it is impossible to make money by being either short or long. You can win a bet on interest rates only if they are higher or lower than what they are expected to be. Similarly, if you want to hedge against a rise in rates, then your hedge will only pay off if rates are higher than they are currently expected to be; if they aren't, your hedge will cost you money.

This is all very relevant for leveraged players and for those who make a living off the slope of the yield curve. The active players know very well that interest rates are expected to rise, so their strategies must be calibrated accordingly. Will the Fed raise rates faster or slower than is already anticipated? That is the question they must answer.

It is reasonable to think that a slower than expected economy and/or a lower than expected inflation rate would result in the Fed moving slower to raise rates, while a faster economy and/or a higher than expected inflation rate would result in the Fed moving faster.

In judging the risk of these two alternative scenarios, I'm inclined to favor the latter. I don't think it's possible for short-term interest rates to be 0-2% for the next two years when a) alternative asset classes offer substantially higher yields, b) a recession seems very unlikely, c) the public's demand for safe, short-term assets appears to be waning, d) banks appear to be relaxing their lending standards and have an almost unlimited capacity to lend, and e) businesses appear to be more inclined to borrow. These represent the stirrings-to-life of an economy that has been dragged down by risk aversion and is beginning to seek out risk. If short-term rates don't rise and become more competitive with riskier alternatives, speculative pressures could build and/or inflation could begin to rise, as money formerly socked away in risk-free places attempts to chase higher prices.

I've been worried about this sort of thing for a long time, and I've been premature as it turns out. But that's not a reason to stop worrying now. I don't think this risk poses a threat to growth, however. It's mainly relevant to those who are exposed to higher-than-expected increases in short-term interest rates and haven't taken steps to hedge that risk. For the rest of us, there's nothing necessarily wrong with higher interest rates. Indeed, they're already baked in the cake.

Wednesday, March 19, 2014

FOMC moves in the right direction

In a few weeks, according to the report following today's FOMC meeting, the Fed will have "tapered" its purchases of bonds by about one-third (from $85 billion per month in December to $55 billion a month). And lo and behold, the sky has not fallen, nor is it about to. Nevertheless, the market continues to fret that tapering is a form of tightening, since, as the theory goes, the economy has managed to grow only thanks to Fed "stimulus," and that without it, economic activity will grind to a halt.

Never in my many years of Fed watching has there been so much confusion about how Fed policy operates.


The myth persists that QE bond purchases are "stimulative" because it involves the printing of massive amounts of money and the artificial depressing of yields. But this is simply not the case. As the chart above shows, 10-yr yields today are actually higher than they were when the Fed launched its first QE bond purchases. Bond prices have actually fallen despite $3 trillion of bond purchases by the Fed. The chart also makes it clear that yields have actually risen during each episode of QE bond-buying. Operation Twist (OT) was ineffective as well, since 10-yr yields were essentially unchanged during the period in which the Fed was buying 10-yr bonds and selling short-term bonds. The main determinant of yields is not the marginal purchases by the Fed, but the market's willingness to hold the entire stock of bonds (Treasuries, MBS, corporate bonds, etc., totaling many tens of trillions of dollars), since all bonds are priced off of Treasuries. That willingness, in turn, is a function of the market's expectations for inflation and economic growth.


As I've explained before, the Fed is not "printing money" when it buys bonds. When the Fed buys bonds it must buy them from banks. The Fed pays for the bonds by crediting banks' reserve account at the Fed. Bank reserves are not money that can be spent anywhere. They only exist on the Fed's balance sheet. Banks use their reserves to collateralize their deposits and to increase their lending, but to date the growth of the money supply has not been unusually rapid, as the chart above shows—only slightly more than 6% per year for the past 20 years. This is not to say that all will be A-OK forever, since the $2 trillion of excess reserves currently in the system would allow banks to expand their lending—and the money supply—by several orders of magnitude if they so desired.

When the Fed buys bonds, they become part of the Fed's assets. The Fed incurs a corresponding liability in the form of bank reserves. In effect, the Fed buys bonds from banks by borrowing the money from the banks to buy the bonds. The Fed pays the banks interest on their reserves of 0.25%, so from the banks' perspective, they are lending money to the Fed for a modest rate of interest which is actually better than they could get by buying T-bills, which currently yield only 0.05%.


As the chart above shows, the Fed's purchases of $3 trillion of notes and bonds (assets) have been offset by an approximately equal increase in currency (about $0.4 trillion) and bank reserves (about $2.6 trillion).

In addition to saying they will continue to taper their bond purchases, the FOMC decided to drop its 6.5% unemployment rate threshold. They will now consider a range of economic variables when deciding to taper and when and by how much to raise short-term interest rates. It's unfortunate that they have backed off of a rules-based policy and now have more discretion—which creates uncertainty—but at the same time this could give them more flexibility to act more or less aggressively if conditions warrant. Meanwhile, continuing to taper is definitely a step in the right direction since, as I've noted in recent posts, there are signs that the demand for bank reserves is declining and banks' willingness to lend is increasing.

Tuesday, March 18, 2014

The end of deleveraging

In my post of yesterday, I noted the importance of the decline in the private sector's demand for safe, short-term assets (e.g., bank savings deposits). I think this is a sign that the risk pendulum has stopped swinging in the direction of risk-aversion and is beginning to reverse; it's a sign that the public will begin to embrace risk rather than shun it. This has very important implications for monetary policy, since the whole point of the Fed's QE efforts has been to satisfy the private sector's seemingly insatiable demand for safe assets. As I explained before

With its QE bond purchases, the Fed has simply "transmogrified" notes and bonds into T-bill equivalents in order to satisfy the world's risk aversion and the very strong demand for cash and cash equivalents. Weak confidence has created strong demand for money, and that has kept the Fed's "stimulus" from turning into inflation.

If the world's demand for safe assets has been sated; if the private sector's desire to de-risk and deleverage is at an end; then the world's demand for "money," cash, and cash equivalents is going to decline. I mentioned yesterday that bank savings deposits have not increased at all since early January. Today we have more evidence that points in the same direction: household's financial burdens have stopped declining.


The chart above contains data released today by the Fed through the end of 2013. Households' financial obligations (e.g., debt payments as a % of disposable income) reached a high in 2008, but have since declined significantly. Importantly, the decline appears to have ended last year. This means households have rebuilt their balance sheets and restructured their finances to the point where they no longer need to tighten their financial belts. Financial burdens today are as low as they have been at any time in the past three decades.


As the chart above shows, households' leverage—liabilities as a % of total assets—has declined significantly since hitting an all-time high in early 2009. Leverage is now back to levels not seen since 2000. In a sense, all of the excessive speculation that helped fuel the housing boom in the early- to mid-2000s has been reversed.


This same de-risking and de-leveraging shows up in credit card and consumer loan delinquency rates. As the chart above shows, delinquency rates for consumer loans are now at an all-time low. Households have bolstered their finances and tightened their financial belts in an impressive fashion, with some help, of course, from tighter bank lending standards. Banks are now sitting pretty, with the lowest consumer loan delinquency and chargeoff rates in decades. Lending standards are very likely to be relaxed going forward, and this will facilitate the expansion of credit and the decline in the demand for money.

If it isn't already, the financial pendulum could soon be swinging back toward re-risking and re-leveraging.

This is extremely important, since it means the public's appetite for debt is likely to increase, PE multiples are likely to rise, the demand for money is likely to decline, and nominal GDP growth is likely to increase. 

If the Fed doesn't take steps to tighten monetary policy in response to this important shift in the demand for money, there could be inflationary consequences.


We see a hint of this in the price of gold (see chart above), which has risen from $1200/oz. to almost $1400/oz. in the past several months. The rise in gold coincides with the surge in bank lending which I noted yesterday, and with the lack of growth of bank savings deposits, and with the dollar's 2% decline since mid-January. All are consistent with a decline in money demand which has not been offset by a tightening in the supply of money by the Fed. These are early warning signs of higher inflation in the months and years to come.

We've seen a version of this movie before, only in reverse, in the wake of the S.E. Asian currency crisis of 1997-98. As one currency after another collapsed vis a vis the dollar, this created intense demand for dollars. Yet the Fed at the time was busy tightening monetary policy, pushing real yields up to 4-5% in an effort to "cool" a supposedly "overheated" U.S. economy. Strong demand for dollars combined with the Fed's efforts to restrain the supply of dollars pushed the dollar up by almost 50% from 1995 to 2002, and that in turn pushed inflation to the lowest levels we had seen in decades and crushed the prices of commodities and gold. Deflation was a genuine risk in the late 1990s, as Alan Greenspan himself noted in 1998. Yet markets weren't worried about deflation back then. The predominant concern was that the economy was so strong (real growth was running 4-5% in the late 1990s) that it would push inflation higher.

Today it's pretty much the same, only opposite. Markets are worried that the persistently weak growth of the economy and the low rate of resource utilization (e.g., high unemployment) will lead to falling prices, even though monetary conditions are now conducive to rising prices. The confusion arises from the persistence of flawed Keynesian-Phillips-Curve thinking—the belief that inflation is caused by too much demand and deflation is caused by too little demand. Janet Yellen has been enamored of this way of thinking for years, so there's a real risk that she may make the same mistake that Greenspan made in the late 1990s, only in the opposite direction, with the result that inflation rises in the years to come. It wouldn't be the first time that markets have been blindsided by monetary policy.


Measured inflation is still quite low, as the chart above shows. Both core and headline inflation are running at a rate of about 1.5%, which is appreciably lower than the 2.3% annualized pace of the past 10 years. The lags between monetary policy shifts and their impact on prices and the economy can be long and variable, as Milton Friedman taught us. Today's low inflation is likely a lagged response to the Fed's slow response to the intense increase in the demand for money and safe assets that occurred in the wake of the financial crisis of 2008. If the Fed has erred by moving too slowly to taper in recent months that doesn't mean inflation is necessarily going to jump tomorrow or even in the next few months. There is still time to bring policy back into line with the changing demand for money, but the spotlight on the Fed is going to be intense as the year unfolds.

Stay tuned.

Monday, March 17, 2014

Saving, lending and tapering combine in a perfect storm

David Malpass' recent op-ed in the WSJ ("The Fed's Taper Is Already Paying Off") highlights what is arguably the biggest and most recent development in the U.S. economy: the sharp increase in bank lending to small and medium-sized businesses that began around the time the Fed started to taper its bond purchases in early January. I think there's more to the story than just tapering, and if I'm right it means that the Fed ought to accelerate its tapering, since that would probably work to the economy's benefit, in addition to lessening the risk of an unpleasant rise in inflation.


The first chart above shows the level of C&I Loans outstanding (the most recent available data being March 5th), while the second chart shows the 3-mo. annualized rate of C&I Loan growth. Loans didn't really start to pick up until the second half of January, and since then they have expanded at a blistering 36.2% annualized rate. We have rarely seen such rapid growth in C&I Loans, so we can be reasonably sure that something big is happening. As David suggests, it is likely no coincidence that banks began stepping up the pace of their lending to the private sector shortly after the Fed started borrowing less from the banking system in early January. But is that the whole story? I doubt it.

As David explains it, now that banks are lending less to the Fed each month they have more money available to lend to the private sector, and this is why loan volume is accelerating. But there's another possible explanation: banks are lending more because they want to, and because the private sector is now more eager and/or less reluctant to borrow. Both of these developments—more willingness to lend, plus more willingness to borrow—could be coming together in a perfect storm that could result in a significant decline in money demand and an increase in money supply. That's the stuff of which higher inflation is made.


All of the money that banks have been lending to the Fed since 2008 has come, on balance, from a strong net inflow of savings deposits (see charts above). Banks essentially functioned as intermediaries, funneling a flood of savings deposits to the Fed in exchange for bank reserves. As evidence, I note that bank reserves have increased by $2.62 trillion since September 2008, thanks to the Fed's bond purchases, while bank savings deposits have increased by $3.15 trillion. At the risk of over-simplying what happened, since 2008 banks have taken in trillions of savings deposits, used the money to buy bonds, and then sold those bonds to the Fed in exchange for bank reserves. There was nothing untoward about any of this, from a monetary perspective, because inflation has remained low and relatively stable for the past several years.

As I began explaining one year ago, the Fed has effectively been borrowing money from the banking system in exchange for newly-minted bank reserves, which (very importantly) are not money but rather short-term, T-bill equivalent assets. This, David argues, has resulted in a mis-allocation of credit (from banks to the federal government), and that has worked to slow the economy, since the government has not used that credit as productively as the private sector could have. So, he goes on, as less of this happens (i.e., as the Fed continues to taper) the economy will benefit. That makes sense to me.

But I see other things going on. By tapering its QE purchases, the Fed is reacting to a decline in the banking system's demand for bank reserves, because the growth of savings deposits has been decelerating for the past two years. In fact, in the past three months savings deposits at U.S. banks have only grown at a mere 1.4% annualized pace, and they have not grown at all since the Fed started tapering its QE purchases in early January. For most of the past several years, the Fed's QE bond purchases served mainly to accommodate the public's seemingly insatiable demand for safe, short-term savings deposits. That's changed significantly in the past few months, however. The private sector is no longer so risk-averse, and banks are apparently also less risk-averse; that would explain why loan volume is expanding and savings deposit inflows have come to a virtual halt. The slowdown in deposit growth and the increase in bank lending are both signs of a return of confidence. The return of confidence is the Fed's worst nightmare.

When confidence was low, and when households wanted to deleverage and boost their holdings of safe, short-term deposits, banks happily lent their deposit inflows to the Fed in exchange for bank reserves because they were averse to taking on the extra risk of lending to the private sector. But now, even though the Fed is buying $65 billion a month instead of the $85 billion per month it did beginning September, 2012, the Fed is beginning to compete with the private sector for credit: QE purchases are far in excess of savings deposit inflows. Until recently, banks had it easy—they simply lent their deposit inflows to the Fed. Now, in order to sell $65 billion of bonds to the Fed every month (though that is likely to soon fall to $55 billion per month, as the FOMC is likely to announce on March 19th), banks are going to have to scrounge up the money from other sources in order to buy the bonds the Fed wants to buy from them. Banks might even consider expanding their lending (actually, they already have), since they have enough reserves to back up an almost unlimited volume of loans. More lending equals more money creation (only banks can create "money") and more deposits, and those deposits can be used to buy bonds to sell to the Fed.

So there are more big things going on than simple tapering—which has only reduced the amount of bonds the Fed buys monthly from $85 billion to $65 billion. The big, unreported news is that the public's appetite for safe-haven assets and deposits has been diminishing at a much faster pace than the tapering of QE.

Until recently, banks have not been utilizing their bounty of bank reserves to fuel an explosion in lending because they have been very risk-averse. Since late 2008, they have preferred to lend their deposit inflows to the Fed, even though they pay only 0.25%. Not only have banks been reluctant to lend to the private sector, but the private sector has been very reluctant to borrow—households' leverage has declined significantly in the past four years, as the chart below shows. According to the Fed's Flow of Funds data, household liabilities haven't grown at all for the past several years, even as incomes and jobs have increased. And as one of the charts above shows, bank lending to small and medium-sized businesses has only recently increased from pre-recession levels.


Fed tapering is still relatively new news, but confidence has been slowly returning for quite some time, as evidenced by the fact that over the past few years the growth in savings deposits has been slowing, gold has fallen from $1900 to $1370/oz., bank lending has picked up, consumer confidence is slowly rising, demand for safe assets is declining, credit spreads are tightening, and PE multiples are expanding. The Fed is tapering at the same time banks are becoming less willing to lend to the Fed and more willing to lend to the private sector, but the Fed is in a reactive, rather than a proactive mode these days. If they don't step up the pace of tapering, they run the risk of creating a situation in which the demand for money falls faster (in the form or rising loan demand and slowing or falling savings deposit growth) than the Fed's willingness to supply money to the banking system (indirectly via the provision of bank reserves). And that would be like deja vu all over again, since that is what caused the rising inflation of the 1970s.

The Fed could avoid this problem or minimize this risk by increasing the pace of its tapering and/or increasing the interest rate it pays on bank reserves. Either development would be welcome, in my view.

Global industrial production continues to expand


As we enter the sixth year of the great equity bull market, it is understandable that many worry about the next bear market. Nothing goes on forever, to be sure. But as I see it, there is still no sign of impending recession. The Great Recession was devastating, and many parts of the world—particularly the developed nations of Europe—have yet to recover the losses they suffered. There is still plenty of idle capacity in the global economy, so we could still be due for at least several more years of recovery before there are any physical constraints on further growth.


The chart above includes data through December 2013. We know that the first few months of 2014 have been a bit on the slow side in most parts of the world, but a global expansion such as we have enjoyed for the past five years is not something that tends to collapse of its own weight—it takes some big shocks (e.g., very tight monetary and fiscal policy, spikes in energy prices) that we have yet to see.


Despite the worst winter weather in decades, February U.S. industrial production exceeded expectations (+0.6% vs. +0.2%) and posted a 2.1% gain over the previous 12 months, reaching a new all-time high. The Eurozone sovereign default crisis took a tremendous toll on its economy, but industrial production there has been recovering for the past year.


U.S. production of business equipment increased 2.8% in the past year, reaching a new all-time high. It's been a slow recovery, but the important thing is that conditions continue to improve on the margin.


German industrial production reached a new post-recession high in January, and has likely continued to expand.


Japanese industrial production is still more than 10% below its pre-recession highs, but it posted an impressive gain of 10.4% in the 12 months ending in January.

Global economic activity could be a lot better, but at least it is still improving on the margin.

Friday, March 7, 2014

The jobs picture improves a bit

The February growth in jobs was better than expected (175K vs. 149K), despite the persistence of very bad weather, so the market has raised its expectations for future growth modestly, as can be seen in the 15-20 bps rise in Treasury yields this week.  


The two charts above show the monthly change in private sector jobs and the six-month annualized rate of change in private sector jobs, respectively. Things have been a little soft so far this year, and the pace of jobs growth is likely to pick up as the weather warms up, so we could see 200K or so per month, or a 2% or slightly better pace going forward. If jobs grow at a 2% pace and productivity rises at the pace of the past two years (1%), that would give us real growth of about 3%. That would be an improvement from the 2-2.5% pace of recent years, but it's nothing to get very excited about. For things to really improve we'd need to see growth well in excess of 3% for at least several years.

Still, 3% growth is nothing to sneeze at, especially with the yield on cash still near zero and way below the yields available on risk assets. The longer the economy continues to expand, the more pressure there will be for short-term rates to rise (i.e., the Fed will not only have to continue to taper but perhaps accelerate its timetable for a reversal of QE) and for yields on risk assets to decline (i.e., for prices to rise).


As the chart above shows, the two surveys of jobs are tracking each other fairly well. The private sector has added 8-9 million jobs in the past four years, and private sector jobs are likely to reach a new all-time high within the next few months.


As the chart above shows, all of the gains in employment over the past two years have been in the private sector (public sector jobs have actually dropped by 89K in the past two years). This is encouraging, since the productivity of the private sector far exceeds the productivity of the public sector.


The unemployment rate ticked up to 6.7% mainly because the labor force has increased by almost 800K this year. That is probably due at least in part to the expiration of emergency unemployment benefits beginning January 1st. That affected about 1.3 million people, and it wouldn't be surprising if some portion of those have decided to more actively search for jobs. That's also encouraging.