


Here's hoping that next year is much better to all of us. Above all, I hope that Obama does a fantastic job. Here's what I think will happen to the economy and the markets:
Inflation: headline inflation has gone down, but core inflation hasn't; once oil prices bottom (which I think is happening), all measures of inflation will head higher; I don't see a hyperinflation yet, but I do see inflation that is significantly higher than what is priced into the bond market. The main driver of higher inflation will be the Fed's inability to withdraw its massive liquidity injections in a timely fashion; they will prefer to err on the side of inflation rather than risk a weaker economy.
Growth: the economy is going to recover sooner than the market expects, with the bottom in activity coming before mid-2009; the recovery will be sub-par however, due to the drag of increased fiscal spending and slowly rising inflation.
Housing: the bottom in construction activity has essentially arrived; whether construction drops another 10% or not is at this point immaterial; housing prices are rapidly approaching a bottom, which should come well before June '09; mortgage rates are now low enough to make a huge difference.
Interest rates: Treasury yields are essentially at their lows and will be significantly higher by the end of next year. TIPS yields will hold steady or fall as nominal yields rise.
Spreads: Spreads have seen their highs and will continue to narrow.
Equities: We have seen the lows in equity prices; equity prices will lag other risk asset prices, but they will be significantly higher by the end of next year.
Commodities: Prices are essentially at their lows; whether they drop another 10% is immaterial; prices are beginning a bottoming process; oil prices are unlikely to drop below $35; commodities may take awhile to move higher, but they will be higher within 2 years.
Dollar: The dollar is unlikely to make further gains against most major currencies, given the Fed's hyper-easy stance, and is likely to fall against emerging market currencies as commodity prices rise.
Wednesday, December 31, 2008
Tuesday, December 30, 2008
Swap spreads correctly forecast improvement in corporate bonds
 I've been writing for months about how the decline in swap spreads was a leading indicator of improvement in other areas of the market. Lower swap spreads are a good indicator that liquidity and confidence are returning to the fixed-income market, and this is a necessary step for improvement in other markets.
This chart shows that the concept has finally caught on. Swap spreads started declining in October, but now all spreads are declining, and yields are declining as well. Yields on high-yield (junk) bonds have dropped significantly in the past few weeks, producing handsome returns for holders of the bonds. Investment grade bond yields have also declined impressively.
This is, I think, a good example of the kind of improvement we can expect to see in the equity market before too long. VERY bullish.
Full disclosure: I am long high yield bonds and stocks (HYG and IVV) at the time of this writing.
Intrinsic value of gold
 It is said that gold is precious because it doesn't oxidize, it is relatively scarce, it is beautiful, and it is the only thing proven to hold its value over long periods. If gold is a good store of value, maintaining its purchasing power relative to other things over time (e.g., one ounce of gold buys about 20 barrels of oil on average), then it must have some intrinsic value around which its actual value fluctuates.
This chart is a crude attempt to find that intrinsic value, which I'm guessing is about $400/oz. give or take a bit. My rule of thumb for interpreting gold prices (which I don't try to predict) is that when gold trades above its intrinsic value, as it is now, that means that people are willing to pay a premium for its qualities. It's trading at a premium today because monetary policy is accommodative, and because geopolitical tensions (e.g., India/Pakistan, Israel/Hamas) are elevated. Gold tends to trade below its intrinsic value (e.g., in the 50s and 60s) when monetary policy is tight and inflation risk and geopolitical risk is relatively low.
So if you are considering buying gold these days, you need to keep in mind that it is somewhat expensive. That's not to say it can't pay off, but there is a hurdle that needs to be overcome (i.e., fears of rising inflation and geopolitical disasters need to be realized) before gold prices can move higher. In addition, there is the issue of timing: over the next 10-20 years I would predict that gold will tend to drift back to its intrinsic value, thus rendering it a very poor investment—and don't forget that gold is one of the very few things that doesn't offer any yield. But that doesn't rule out gold going to $1500 should the Fed fail to withdraw in a timely fashion the massive amount of money it has supplied to the market in recent months.
Something to think about.


The potential for a panic rally
 This chart lays out the potential for a powerful equity rally. Implied volatility in equity options has fallen rather dramatically (though it is still abnormally high), which means that fear is subsiding meaningfully. I expect that fear and uncertainty are slowing being replaced by greater confidence, and at some point that will bring buyers back into the market. I've been arguing for some time that the problems we face are not due to a shortage of money, but rather to a shortage of buyers. Buyers went into hiding and sellers panicked as fear rose beginning in late September.
There is plenty of money in the system, but fear (or call it a lack of confidence, whatever) has led people to hoard the money. With cash money essentially yielding zero, the next wave of panic could be people terrified of holding too much, not too little, cash, and seeking to put that cash back to work in assets that have positive return potential.
Housing prices continue to fall (2)
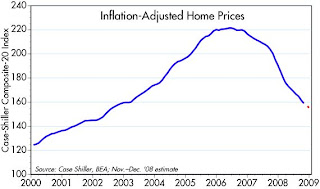 The Case Shiller home price index fell just over 2% from September to October, which is somewhat faster than the 18% annualized pace that we've seen for the past year. Projecting more of the same through year-end, real home prices according to this index will have fallen about 30% from their highs. That goes a long way to solving the housing affordability and attractiveness problem.
Real home prices are now back to where they were in 2002, which was just before the housing bubble started to take off. Since 2002, real disposable personal income is up just over 15%, and now mortgage rates are the lowest they have been in our lifetimes, and substantially lower than they were in 2002. So homes are clearly more affordable today than they were six years ago. As long as the economy doesn't fall down a black hole (and last time I checked, the freeways in Los Angeles were as jammed as ever), the combination of these forces (lower prices, lower borrowing costs, and rising incomes) should put a floor under housing prices before too long. And that would dramatically reduce the threat to our financial system.
The crisis is passing (4)
 The TED spread continues to narrow, and that's good. Most of the narrowing from the peak has been due to declining Libor rates, but this week comes a remarkable new development: yields on 3-mo. T-bills have risen. Well, they've only gone up from 1 bps to 9 bps (0.09%), but at least they are no longer hugging zero (or negative, as was the case briefly). I mentioned before that rising bill yields would be an excellent sign that this storm was passing, and now we have the beginnings of that. It's also interesting that bill yields should be rising as the year draws to a close. Year-end window dressing demand for bills is undoubtedly intense this month so perhaps the rise in bill yields is telling us that the demand has been satisfied; panic is subsiding.
If yields rise faster starting next year (Friday) we'll know that is indeed the case. And we should also see risky asset prices rising as well. 2009 could be a very nice year.
Monday, December 29, 2008
It's always darkest before dawn -- why a panic rally can't be ruled out
 Yields on 10-year Treasury bonds (currently 2.1%) have now fallen to almost the lowest levels ever recorded by the Fed. That's a remarkable statement, since the only time yields were lower was in 1941 (2.0%), just before the Japanese attacked Pearl Harbor. So you might say that not only are equities priced to a depression worse than we saw in the 1930s, and not only are corporate bonds priced to default rates worse than the worst of the 1930s, and not only are TIPS priced to years of outright deflation—all of which I've documented in earlier posts—but now Treasury yields are priced to conditions equivalent to the onset of a World War. That's an awful lot of pessimism out there.
Which means that in order to be bearish on the prospects for corporate bonds and stocks, you have to believe that what awaits us around the economic corner is at least as bad as a combination of the worst scenarios that modern man has ever witnessed: deflation, depression, and world war.
I can't rule out any one of these scenarios, I admit, but that they all occur together seems a bit of a stretch, to put it mildly. Especially when you observe the following:
Monetary policy has never been easier. The Fed has pulled out all the stops. All measures of money are at or near all-time highs. Bank lending is at or near all-time highs. All major central banks are in panic-easing mode.
Key inflation indicators are signaling inflation, rather than deflation. The dollar is below its average inflation-adjusted, trade-weighted value of the past 36 years. Gold is trading at $880, twice its average value, in inflation-adjusted terms, over the past 100 years. Crude oil is trading 25% above its average value, in inflation-adjusted terms, over the past 50 years. Non-energy commodity prices are trading 25% above their lowest level, in inflation-adjusted terms, over the past 50 years.
Housing prices have fallen more than 30% from their recent highs, in inflation-adjusted terms, yet sales activity is brisk and financing costs are lower than they have been in generations.
Key financial indicators such as swap spreads, agency spreads, and implied volatility are all significantly better than they were at the height of the panic a month or so ago.
The world has never been so interdependent on global commerce. U.S. exports are now over three times larger, relative to the size of our economy, than they were in 1970. Trade as a percent of GDP is at its highest level ever for all major economies.
The U.S. employment situation is not materially worse today than it was in the 2001 recession, which was the mildest in recent memory.
In short, deflation is unlikely because monetary policy has never been so easy; depression is unlikely because none of the conditions that led to the Great Depression (e.g., extremely tight money, rapidly rising taxes, massive government intervention in the economy, and a global trade war) exists today; and world war is unlikely because no economy today could afford a significant disruption in world trade. To be sure, Obama might give us massive government intervention, but that remains to be seen, he has cooled his anti-trade rhetoric, and he has apparently ruled out higher taxes for at least the time being.
If the year 2008 will be remembered for anything besides the election of Barack Obama, it will be the panic selloff which drove global equity markets down by 50%. Investors panicked at the possibility of a deadly combination of deflation and depression, triggered by the collapse of housing prices and a massive, forced unwinding of leverage, all amplified by a sudden drop in demand as consumers retrenched almost overnight. In their panic, investors were so desperate for safe havens that yields on cash fell to zero, and yields on Treasury bonds fell to levels below those which prevailed during the Great Depression. Credit spreads rose to their highest levels ever, as investors anticipated a massive wave of bankruptcies exceeding the worst that occurred in the Depression.
So what happens next?
Those who sold and are hanging out in cash and gold can take little comfort from the fact that they are earning no yield on their investment. What positive returns they may eventually realize would come only from a general deflation which drives down the prices of everything, thus boosting the purchasing power of their cash and gold holdings. In the meantime, those who still own equities are likely to receive dividend income of at least 3%, and those who own corporate bonds are likely to receive coupon interest of 6-20%. Those yields could be offset by a sharp rise in bankruptcies, or a further sharp deterioration in the economic outlook, but for the past month or so, equity prices have been relatively stable, and corporate bond prices have been increasing. Even commodity prices appear to be stabilizing. If prices don't fall, equity and corporate bond yields offer compelling values.
If a global deflation, depression and trade war fail to materialize (and surely we aren't on the verge of a world war, are we?), there is going to be a gigantic gap between the returns on cash and just about every other financial asset in the world. Financial markets abhor such gaps, otherwise known as arbitrage opportunities, and the opportunities could spur rapid increases in prices for stocks and corporate bonds.
It is extremely regrettable that world financial markets are in roller-coaster mode, and a good deal of the blame lies with erratic monetary policy and massive government intervention in housing markets (i.e., Freddie and Fannie). But just because financial asset prices have been in free-fall this past year does not mean that the global economy is going to collapse. We’ve seen a sudden panic selloff, so we might soon see a sudden panic rally, especially if today's problems are financial in nature and the financial markets are healing themselves rapidly. The financial meltdown of the past year could be followed by a "melt up" next year. Even if it's not a panic rally which ensues, at the very least I think it pays to be optimistic given the extreme degree of pessimism evident in today's markets.
Calafia Beach morning
 It's one of those impossibly beautiful days at the beach. Temperatures of just under 70º. Bright blue sky, not a cloud to be seen. And just a handful of people walking on the beach. A touch of haze on the horizon, but other than that, breathtaking.
No household debt crisis
 As readers of this blog know, I'm a fan of keeping things in perspective. With everyone obsessed by the current debt crisis, deleveraging, and collapsing demand, I've noted that there is no shortage of money out there; that there is more money and bank lending today than ever before; and that the big deleveraging play has likely maxed out. Although big money players were undoubtedly over-leveraged, this chart shows that households on average did not take on excessive levels of debt or financial obligations in recent years. (The most recent datapoint is the end of September '08.)
Household debt and financial burdens (measured by using monthly payments as a percent of disposable income) today are about the same as they were in 2002, before the financial system began devouring mountains of subprime mortgage-backed securities, and before speculators pigged out on commodities, gold, and foreign currencies.
What this means is that once the financial system finishes writing down the value that has been lost to plunging housing values and collapsing commodity prices, we will discover that the basic economy (the consumer) is still in reasonably good shape.
Wednesday, December 24, 2008
Another refinancing boom
 People respond to changing incentives, and there is a lot of that going on these days. Mortgage rates have dropped to all-time record lows, and refinancing activity, not surprisingly, has exploded. New applications for mortgages are starting to pick up as well, but so far most of the activity is centered around refinancing. For all of those homeowners who have enough equity in their home to qualify for refinancing, which I assume must be the majority, refinancing now can result in locking in historically low mortgage rates and reducing monthly payments by a meaningful amount. Even those with negative equity in their homes might consider using some of their cash or liquidating other assets in order to reduce their loan amount and thus refinance.
My nephew who deals with foreclosed properties in the Inland Empire (about 40 miles west of Los Angeles) tells me that buying interest is strong and prices appear to have stabilized in the past month or so. And it makes sense, since mortgage rates are exceptionally low and prices in many of the previous high-flying areas have dropped 50%. Homes are now reasonable again. Buyers can even finance the purchase of a property and then rent it out for a positive cash flow.
It's taken about three years, but the market seems to have found a new equilibrium. To be sure, there are lots of foreclosed properties yet to hit the market, and many more in the pipeline, but there does not appear to be any shortage of buyers, and financing costs are extremely attractive. I find all of this news extremely encouraging.
Look back at the chart. The last time we had such a massive refinancing boom as is now underway was in the first half of 2003. As you might recall, that was a time when economic gloom was pervasive. The Fed was "pushing on a string;" interest rates had collapsed because demand had collapsed; it was a "jobless recovery" that threatened to morphy into a global deflation/recession. The entire world was thus astonished when the U.S. economy surged ahead in the second half of 2003. Bush's tax cuts undoubtedly had a lot to do with the recovery, but who's to say that Obama won't cut any taxes early next year? This is no time to despair.
Tuesday, December 23, 2008
The crisis is passing (3)
 This chart zooms in on the action in 2-year swap spreads (using daily data), and I think it gives a pretty good idea of just how well swap spreads have been leading indicators of improvement in other areas. This chart suggests that there is some tremendous improvement in store for high-yield bonds in general.
The crisis is passing (2)
 Just thought I would post this updated chart, as swap spreads continue to narrow (i.e., improve) across the board. Even though more improvement is needed before we can say things have returned to normal, what we've seen in recent months is very good news indeed.
Bonds beat stocks (3)
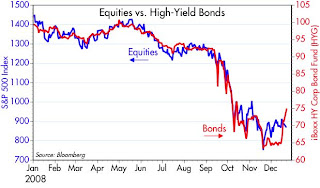 This chart compares the price performance of the S&P 500 Index to that of the iShares iBoxx High Yield Corporate Bond Fund (HYG). Both were tracking pretty closely until recently, but then the prices of corporate bonds started to soar while equity indices languished. I think this another one of those cases where the bond market is leading the way for the equity market. First, we had swap spreads decline. Now, we are seeing spreads on corporate bonds decline. Eventually we will see equity prices picking up.
Full disclosure: I am long HYG and IVV at the time of writing.
Monday, December 22, 2008
Government spending is not stimulative (2)
Greg Mankiw's blog has a very interesting note from a government bureaucrat who points out the extreme difficulty of ramping up government spending.
Two thoughts flow from this: 1) perhaps Obama doesn't really care about stimulating the economy, and is simply using the current crisis as cover for promoting a massive environmental and union-friendly agenda, and/or 2) as his team drills down to the specifics of what they are proposing, they will realize that since stimulus by government spending is extremely difficult and time-consuming, it would be best to kick things off with something that has a high probability of success and can be implemented very quickly: tax cuts.
I work for the DoD and when the Department of Homeland Security was established,we helped them with many things, not the least of which was contracting. To make a long story short, you cannot juice up a government agency's budget by tens of billions (or in the case of the stimulus package, hundreds of billions) and expect them to be able to process the paperwork to contract it out, much less oversee the projects or even choose them with any kind of hope for success. It's like trying to feed a Pomeranian a 25 lb turkey. It's madness.In short, you can argue about what sort of stimulus spending is best, but in the end it is going to be nearly impossible for the Obama administration to ramp up government spending by any significant fraction next year. It would probably take at least several years before any meaningful increase in spending on infrastructure and alternative energy projects actually occurs. Government already spends a gargantuan sum of our money, but the logistics of spending even more of it are incredibly complicated and time-consuming.
Two thoughts flow from this: 1) perhaps Obama doesn't really care about stimulating the economy, and is simply using the current crisis as cover for promoting a massive environmental and union-friendly agenda, and/or 2) as his team drills down to the specifics of what they are proposing, they will realize that since stimulus by government spending is extremely difficult and time-consuming, it would be best to kick things off with something that has a high probability of success and can be implemented very quickly: tax cuts.
The crisis is passing


 These four charts represent different measures of the degree of fear that is driving markets these days. All show that fear has declined, and in some cases significantly. The VIX/10-yr ratio remains the highest, but mainly because the yield on 10-yr Treasuries has been driven to exceedingly low levels in part because of the Fed's recent vows to keep yields low for "some time" and to purchase Treasury bonds in order to drive down borrowing costs, neither of which has much to do with fear. (The other part of the reason for very low Treasury yields being the fear—or the expectation—of deflation.)
As fear subsides, liquidity is slowing picking up, and these are essential first steps towards recovery. All of this reinforces my belief that we are seeing a bottoming process in the equity and corporate bond markets.
Friday, December 19, 2008
Bonds beat stocks (2)
 Further to my previous post, here is a chart comparing the average yield on high-yield (junk) bonds. Very interesting how yields almost double beginning last September. Investment grade yields are declining but junk yields are not yet declining. This is at odds with the strong performance of some junk bond funds (e.g., HYG) lately, but that could be due to the fact that the Lehman data cover all bonds and not all bonds trade every day, whereas the ones in the HYG fund represent very large and liquid issues. In any event, there is PLENTY of room for junk yields to come down.
Bonds beat stocks
 From the end of October (when yields on corporate bonds peaked) through yesterday, an investment in investment grade corporate bonds did far better than an investment in stocks: 10.1% vs. -8.2%. This is due to the relatively high yields on bonds coupled with a decline in the yield to maturity of bonds over that period.
Several things are driving this recovery, which comes after a long period of dismal performance for corporate bonds. More aggressive easing on the part of the Fed is reducing deflation risk, and that in turn reduces default risk, which is ultimately the nemesis of any corporate bond investor. At an extreme, inflationary monetary policy reduces default risk by making the burden of debt disappear, allowing borrowers to repay debt with dollars that are very easy to acquire. But another important factor is that the very high yields and yield spreads that we saw recently can only persist if the economic outlook continues to deteriorate, thus pushing default expectations higher. I think the market was priced to a catastrophic scenario, and the news has just not been that bad. As a result, the market is now pricing in a less-terrible scenario, and that means that default expectations are falling.
The best explanation for why bonds are outperforming stocks of late is that these two factors—easy money and an economic outlook that is "less worse" than expected—make debt look more attractive by reducing default expectations but fail to convince equity investors that the outlook for profits will improve.
Thursday, December 18, 2008
No shortage of money (5)
 And so continues the saga of the greatest monetary expansion in the history of modern, industrialized nations. Through massive purchases of all kinds of assets, the Fed has almost doubled the size of the monetary base since early September. Put another way, they have created more high-powered money in the past three months than in the entire history of the Fed.
This hasn't been inflationary yet, because the demand for money has been extraordinarily strong—fueled by outright panic, a flight to safety, deleveraging, commodity price plunges, and the reversal of "carry trades." But surely it's safe to say that there is no shortage of dollars in the world at a time when the world desperately wants them. Indeed, recent weakness in the value of the dollar and strength in gold suggests that the Fed may have finally added enough liquidity to the system to satisfy the market's thirst. That gives us great comfort, since it eliminates entirely one of the major causes of the Great Depression (i.e., a collapse in the money supply and a subsequent deflation).
This expansion of the monetary base has been made possible by the Fed's shift to quantitative easing, something I highlighted about two months ago, but the Fed only admitted to recently. Now that it's official, and the Fed has promised to remain super-accommodative, the next phase of this process will be to see how much and how fast the abundance of base money gets turned into new spendable money. The base has risen by $800 billion since early September, but M2 (the best measure of money in my view) has only risen by $397 billion. Of that, currency accounts for $32 billion, and some portion of the balance can be attributed to a three-fold increase in mortgage refinancing activity. The potential for further money creation is enormous, nevertheless, since each dollar of base money can potentially support ten dollars of new bank deposits.
Further monetary expansion will be up to the public and the banks. Will people be encouraged by historically low mortgage rates to return to the housing market? Will institutional investors decide that taking on leverage—at a time when prices for many physical assets have collapsed and interest rates are relatively low—is not a bad idea at all? Stay tuned, it shouldn't take long before we find out.
High yield bonds rally
 High-yield bonds had a great day today. They have finally picked up the message that was being sent by swap spreads, which are down significantly from their highs, and more recently from the Fed, which has promised to make money plentiful. Less fear, more confidence, and plenty of money to grease the wheels of commerce add up to a powerful case for junk bonds, since at the very least this combination of forces all but ensures that defaults will not go to the catastrophic levels that were implied in yields of over 20%. Put simply: with cash yielding zero, investors are almost compelled to consider alternative assets. I would expect that the good feelings that boosted the junk bond market today will transfer to the equity market before too long. Excellent news.
Wednesday, December 17, 2008
Has the carry trade been unwound? (2) -- yes
 Sure looks like it has been unwound. Indeed, evidence is starting to accumulate that the carry trade is being put back on. This chart illustrates how tightly gold and the dollar have traded this year. Strength in gold mirrors weakness in the dollar, and weakness in gold tracks strength in the dollar. Gold is a good proxy for all things physical, so when it rises in value it generally reflects a weaker dollar and more expensive things. Gold has some unique qualities, one being that it is the most sensitive of physical things to respond to underlying changes in the fundamentals that determine the dollar's value.
The recent collapse in the dollar and resurgence in gold is thus good evidence that the Fed has succeeded in over-supplying dollars to the market via its new zero interest rate policy and its aggressive purchases of all sorts of assets. With money now virtually free, the market is willing to accept the Fed's offer of cheap dollars: the carry trade is being reborn. Borrow now, secure in the knowledge that borrowing costs will remain exceptionally low for quite "some time," and buy gold, buy homes, buy commodities, etc.
Thus begins a new reflationary cycle in the U.S. economy. Sadly, we've had one too many already, with the last one beginning in 2003 and ending preciptiously last July.
The importance of innovation
Bret Swanson has a wonderful article that reminds us of the huge technological advances that have been made in recent years thanks to innovation of all sorts. He makes a compelling case for not allowing a significant expansion of government into the areas of energy, finance, auto and healthcare. Some excerpts:
HT: Russell Redenbaugh
Today, an average consumer can buy a terabyte hard drive (1 million megabytes), on which she might store her family photos, videos and other digital documents for as little as $109.99. In 1992, a terabyte drive, if such a thing had existed, would have cost $5 million.
Apart from research scientists and a few early adopters of Compuserve and AOL, the Internet essentially didn't exist in 1992. Monthly Internet traffic was four terabytes. All the data traversing the global net in 1992 totaled 48 terabytes. Today, YouTube alone streams 48 terabytes of data every 21 seconds.
When the Human Genome Project began in the early 1990s, sequencing one DNA base pair cost about $10. Today sequencing one base pair costs a tenth of a cent, and by 2024 we'll sequence an entire human genome for $100.
In 1992 a tiny percentage of Chinese citizens had ever made a phone call, but today there are twice as many mobile-phone subscribers in China as there are people in the U.S. The entirety of U.S.-China trade in 1992 was $33 billion. This year it will approach $400 billion.
But innovation is by definition unexpected. We can't force it or compel it. Certainly not from Washington. If Washington had planned our future in 1992, we wouldn't be here.
When things look bleak, look back. You will see how bright tomorrow can be.
HT: Russell Redenbaugh
The coming cash conundrum and the return of the carry trade
The Fed has promised to keep the funds rate at or close to zero for "some time." That's reminiscent of a similar pledge in late 2003, when the Fed kept the funds rate pegged at 1% until June 2004. Exceptionally low interest rates back then helped fuel the housing bubble, helped drive gold and commodity prices up, and the dollar down. The carry trade was born.
This time around the yield on cash and cash-like securities (e.g., money market funds) is going to be even lower. Indeed, MMF yields could approach zero and force fund companies to slash their fees in an attempt to keep yields positive. And lots of money could flow out of MMFs and into bank CDs in search of better yields.
The larger issue, however, is the conundrum than those holding cash or cash equivalents for risk-reducing purposes will face: it only makes sense to hold zero-interest cash if the prices of alternative investments continue to decline. If other asset prices just stabilize, they will yield more (and in the case of high-yield bonds, for example, much more) than cash. And of course if other asset prices rise, their returns will be hugely more than cash.
In short, if the economy doesn't continue to deteriorate significantly, then cash will prove to be a major embarrassment. With the underlying fundamentals (e.g., swap spreads, agency spreads, implied volatility, liquidity) improving, the economy is not likely, in my view, to deteriorate enough to keep the prices of other assets declining. Thus, as time passes, investors will be compelled to trade in their cash (or increase their borrowings, since borrowing costs will be extraordinarily low) in exchange for riskier assets. And that in turn will set off a virtuous cycle to the upside which could be rather spectacular.
The Fed put us on a roller coaster ride beginning in the late 1990s, and the ride continues. Just as signs are emerging that the unwinding of "carry trades" is coming to an end, a new cycle will soon begin. Just as deleveraging and forced selling slowly exhaust themselves, a new wave of re-leveraging and buying will begin. Who can resist buying extremely cheap assets with money that is almost free?
Lots of things are getting better (2)
 Here's an update of a chart I've posted several times in the past. The VIX index, a measure of the implied volatility of equity options, is almost as low today as it's been since the panic phase of this crisis started a few months ago. As panic subsides, I've argued, then equity prices should rise. That appears to be the case, but so far equity prices are lagging. The market is still reluctant to accept the notion that the fundamentals are improving. Perhaps it's difficult for people to embrace the Fed's massive easing efforts as something that can have lasting positive benefits.
Government spending is not stimulative
Here's a great video by Dan Mitchell of the Cato Institute which explains in simple and straightforward terms why the economic "stimulus" plans of the incoming Obama administration don't make sense and won't stimulate the economy. Keynesian pump-priming has never worked, but politicians keep trying to do the impossible because they can't resist spending other people's money. I imagine that Obama will try to justify his big-spending boondoggle by using a lot of the money to fund pet programs and green projects. You can already hear the lobbyists sharpening their knives as they plot how to get a piece of this enormous spending pie.
Tuesday, December 16, 2008
Lots of things are getting better
 Spreads continue to tighten across the board, and today's FOMC announcement only accelerated the process. 2-year swap spreads, shown here in red, have improved dramatically since their peak in early October. They are still unusually wide, but at this rate are well on their way to returning to more normal levels. This is a clear sign that the inner workings of the fixed-income market are healing. Confidence is returning, fear is subsiding, and liquidity is improving.
The fixed-income market is telling the equity folks, "hey, come on in, the water's not that cold!" But the equity market is still in a once-burned-twice-shy mode.
Fed will do whatever it takes
The Fed's statement today essentially confirmed that it is engaged in quantitative easing and will be so for "some time." It will do whatever it takes to "support the functioning of financial markets and stimulate the economy." With this sort of commitment by the Fed, the one thing you can be sure of is that deflation is not going to happen. The only question is how much inflation we'll have as we eventually emerge from this crisis: a lot or a little?
TIPS prices rose on the news, which is logical, since the risk of deflation (which had been the major factor depressing TIPS prices of late) has dropped with this announcement. The dollar was weak going into the announcement and has fallen further, which is logical, since the Fed is going to try very hard to pump more dollars into the market than the market probably desires. Gold was strong and only got stronger, which is logical since the risk of inflation has increased. Equities have been moving sideways for awhile but got a boost with the announcement, and that is logical since the risk of deflation/depression (which has been the major factor depressing equity prices of late) has fallen.
This is one of those times when reading the market tealeaves is not hard at all, and the message is clear: things are definitely going to be getting better.
Deflating the deflation talk
 Here are three different looks at the consumer price inflation data. The blue line is the "headline" or main index; the green line is the CPI less food and energy; and the red line is the Cleveland Fed's measure of the change in the "median" item in the CPI basket, which results from excluding those prices that rise and fall the most. Both the median CPI and the Core CPI continue to rise, which suggests that there has been very little pass-through of falling energy prices to prices as a whole. Most prices, in other words, are still rising; inflation is not dead, and we are a long way from anything that might be termed a true deflation.
Fed funds rate is essentially irrelevant
 As I mentioned before the last FOMC meeting, it's really doesn't matter whether the Fed lowers its target for the funds rate today. The target doesn't mean much, in any event, since the actual funds rate has been trading well below its target since mid-September, which is when the Fed effectively shifted its operating procedure away from funds-rate targeting to quantitative easing. They haven't made any official announcement of the shift, so perhaps that will come today.
As this chart shows (assuming they cut the target funds rate to 0.5%), the inflation-adjusted funds rate is as low as it's ever been. Whether or not it drops by 50 bps today is not really that important. Borrowing costs are only onerous for people who are financing things (e.g., energy and commodities) that are falling in price. Most non-energy and non-commodity prices are at least stable or rising. Relative to the rate of core inflation, borrowing costs are negative.
The big thing that the Fed has done is to massively increase the amount of reserves in the banking system. This action alone could potentially dwarf any changes to the funds rate target. As fear of deflation subsides, more and more people will realize that there is very cheap money for the taking, and the process of re-leveraging will begin. This is the important next shoe to drop, not the Fed announcement today.
CPI plunges -- good news for TIPS
 The CPI fell 1.7% in November, which was more than the expected fall of 1.4%. The CPI has now fallen by 2.8% from its high last July. The bulk of the decline was due to falling energy prices; the CPI ex-energy rose by 0.45% over this same period, and core (ex-food and energy) prices are up 2% in the past year. As I noted before, the TIPS market has been extremely worried about deflation, yet TIPS prices today rose on the news that deflation was worse than expected. What gives? Simply put, the deflation that has worried investors is now old news, water under the bridge. More importantly, perhaps, we aren't seeing signs that deflation is spreading to any meaningful extent; it's largely confined to energy and commodities, and those prices are down hugely from recent highs. So TIPS are up because investors are now less worried about the prospects of more deflation.
As I noted here, the unadjusted CPI is always weak around this time of the year, and it is always strong in the early months of every year. So TIPS investors are now beginning to position themselves for the positive increases in the unadjusted CPI which will feed into TIPS portfolios beginning next March.
Housing starts plunge -- good news
 Housing starts in November were much lower than expected, and the lowest the data began to be recorded in 1959. This is one of those cases where bad news is actually good news, because starts are now so low that even if they fall further it won't make much of a difference to the economy. Starts have now fallen 73% from their early 2006 peak, and are now much less than the ongoing formation of new households, so the oversupply of housing is rapidly shrinking. Fewer homes for sale, more people needing a home, lower prices, and lower mortgage rates all add up to a bottom in housing that is rapidly approaching. No wonder the market is up on this horrible news.
Monday, December 15, 2008
Commodity price collapse may be ending
 I'm seeing signs that the huge collapse in commodity prices may be coming to an end. It's not too easy to see in this chart, but the JOC Metals index (steel, copper, aluminum, zinc, lead, tin, nickel) has been slowly rising for the past four weeks. This index is a key indicator of industrial activity, so any firming in prices is an excellent sign that the sharp slowdown in economic activity we've seen all over the world in recent months may prove to be an "air pocket;" a temporary drop in demand brought on by a sudden crisis of confidence.
Other encouraging signs in the past few weeks: a bottoming in the Baltic Freight Index, downturn in the dollar coupled with an upturn in gold, and a firming in some scrap metal prices. This is too tentative to take to the bank, but if we see more such signs it would be strong evidence that we will avoid the deflation and depression that the market is obsessed with, and that in turn would be a huge boost to confidence.
TED spread slowly shrinks
 After peaking at 470 bps on October 10th, the TED spread dropped to the low 200s in early November, then appeared unable to make further progress until about a week ago. The yield on 3-mo. T-bills is stuck at zero, but Libor is coming down. That tells us that confidence in the banking system is improving. Other spreads such as swap and agency spreads are also making slow but positive progress. That the markets continue to heal is good news.
Sunday, December 14, 2008
$1,000,000,000,000 of stimulus?
Obama's econ recovery experts are supposedly setting their sights higher with each passing day. Two weeks ago it was going to be a half-trillion of infrastructure projects over two years, now it could be as much as a full trillion or even more over two years.
Is this the best way for the government to help the economy? To put $1 trillion in context, consider that in FY 2008 the federal government received $1.146 trillion from personal income taxes, $304 billion from corporate income taxes, $900 billion from social security taxes, and $171 billion in excise taxes, customs duties, estate and misc. taxes.
I've argued here that tax cuts are a much more effective way to stimulate the economy. Just consider the difficulties involved in choosing, designing, approving, acquiring raw materials, and building and constructing infrastructure projects, and you have delays that could be measured in many months to years. In contrast, reducing income taxes has immediate effect, changing people's incentives to work, save and invest almost as soon as it appears that a change in the tax code is likely to happen. Instead of spending $1 trillion or more on infrastructure projects over several years, we could cut corporate income taxes by half for the next 7-10 years. Is it too hard to imagine that corporations might put all that extra money to better use than the federal government?
Not only do tax cuts take immediate effect, they also lead to a sorts of virtuous things because they change people's behavior. Cutting taxes increases the after-tax rewards to work, savings, and investment, so we would quickly see more of all the things that make the economy grow. Cutting corporate taxes would likely attract plenty of new foreign investment, by putting the U.S. economy in the lead when it comes to competing for the world's capital.
Greg Mankiw has a nice summary of Obama's economic team, in which he highlights their credentials and policy preferences. Christina Romer, soon-to-be chair of Obama's Council of Economic Advisors, has done impressive research showing that tax cuts are much more effective than government spending at stimulating the economy. Is she being consulted on these stimulus plans?
What if we consulted the American people: would they prefer a trillion dollars of infrastructure projects over the next several years, or would they prefer to eliminate the personal income tax entirely for a year? Or cut income taxes by half for the next two years? Unfortunately, since the majority of workers pay a minority of all taxes, the vote might come down in favor of infrastructure spending, but then again it might not. Was Obama elected with a mandate to make these sorts of decisions? I suspect not. We shall see what happens as details of these plans emerge.
On another front, Obama seems increasingly likely, given his recent appointments, to favor an aggressive plan to transform the way our economy uses energy. One proposal could be a big carbon tax. My hunch is that such a plan, which would significantly increase the cost of anything that uses hydrocarbon fuels, would face a wave of opposition across the board that would be reminiscent of the furor that erupted over HillaryCare when the details became know. Significantly higher energy costs up front, plus many hundreds of billions of new investment in developing alternative sources of energy which would likely cost more than fossil fuels, and for what purpose? To make a tiny dent in the world's carbon emissions, which might or might not make a measurable difference in the world's climate, which we wouldn't have any way of measuring for decades. That's a very tough sell, if you ask me.
I see the press trying to link Obama's stimulus plans to a some vague sense among the public that the future looks brighter. But meanwhile I see the markets still struggling in the depths of despair, and everyone I know is cutting back on nonessential spending. Corporate bonds are priced to the expectation that a significant fraction of the corporations existing today will be out of business in the next 5 years; equities are priced to the expectation that the next 5 years will be worse than the worst of the Great Depression; and Treasury bonds are priced to the expectation that deflation will ravage the economy for at least the next 5 years. I don't know anyone, outside of crazed Obamafans and environmental fanatics, who thinks that massive government spending and massive government intervention in our economy will make things significantly better in short order.
Memo to Obama: think twice about how you would like to spend a trillion dollars.
Friday, December 12, 2008
Producer Price Inflation not dead
 Producer prices fell by 2% in November, leaving the year over year change at a very modest 0.4%. But most of the decline in this measure of inflation was the result of collapsing oil prices. Leaving out food and energy prices, "core" PPI inflation was 0.1% for the month, and 4.2% for the past year.
As this chart shows, we've seen huge swings in inflation in recent years, all of which were driven by very volatile energy prices. Taking out energy, we see a consistent trend in core inflation, which has been slowly but steadily rising. Energy prices don't cause inflation, monetary policy does. Given their extreme volatility in recent years, it makes sense to focus on core inflation. And doing so tells us that inflation is still very much alive and well. And with the Fed being orders of magnitude more accommodative today than ever before, I think it's way too premature to pronounce inflation dead, as the bond market appears to be doing. Beware the very low yields on Treasuries, and be alert to the opportunities in TIPS.
Thursday, December 11, 2008
Mortgage rates are collapsing (2)
 Wow, interest rates just keep tumbling. Most importantly, mortgage rates are tumbling. The spread between current coupon FNMA MBS securities and 10-year Treasuries has very quickly come down to levels that are more in line with historic norms. They might go a bit lower, but we've most likely seen the bulk of the declines. With FNMA issues carrying a coupon of roughly 3.8%, you can expect to see rate on 30-year fixed-rate, conforming mortgages fall below 5% very soon, with 4.5% as a not-impossible target.
Since the end of October, mortgage rates have effectively fallen by about 2 percentage points. That translates into a reduction of about 20% in monthly mortgage payments. And that makes housing about 25% more affordable for most folks. Combine that with the 30% reduction in inflation-adjusted home prices as recorded by the Case-Shiller index since 2006 (at which time mortgage rates were almost as high as they were in October), and the bottom in housing prices is now approaching at a much faster rate. This is simply excellent news, because the survival of the banking industry will be a big source of uncertainty unless and until housing prices stop falling.
Press bias is egregious
 The press is just desperate to paint the story ugly. A Bloomberg story today greets the release of household balance sheet data for the third quarter thusly:
U.S. household wealth fell from July to September by the most on record as property values and stock prices tumbled, Federal Reserve figures showed. Net worth for households and non-profit groups decreased by $2.81 trillion, the most since records began in 1952, to $56.5 trillion, according to the Fed’s quarterly Flow of Funds report today. Real-estate-related assets declined by $646.9 billion, following a $217.1 billion loss. Combined with a loss of 1.9 million jobs so far this year, household balance sheets are in tatters, making it harder for Americans to borrow as banks restrict credit.The reporter neglected to mention several important facts. For one, the decline in net worth from July to September was almost entirely offset by a significant upward revision to prior data—net worth in September was about the same as net worth was reported to have been in July. Two, despite recent losses, real estate assets were worth more in September than they were worth in 2004. Three, despite recent losses, household net worth in September was still 38% higher than it was in the wake of the 2001 recession, and 8% higher than in 2004. Four, it's not easy to find "tatters" in the above chart. Over the past 11 years, net worth has risen 4.9% per year; financial assets 4.9%; real estate 7.5%; and debt 8.9%. Yes, there's been some deterioration in balance sheets, but it hardly qualifies as a disaster. Five, there is no evidence that banks are restricting credit; total bank credit at the end of November stood at $9.9 trillion, up 9% from a year ago, and down only marginally from an all-time high of $10.1 trillion a month earlier.
Memo to Obama -- Tax cuts work much better than spending
A recent post from Greg Mankiw pulls together a lot of recent economic research by serious people, and finds, even to his surprise, that a dollar's worth of tax cuts can be two to three times more effective than a dollar's worth of additional government spending. This directly challenges Keynesian orthodoxy, which holds that spending is the key to stimulating the economy.
With the power of the internet, it's possible that good economics can drive out bad economics. Despite his liberal tax-and-spend rhetoric, Obama's team economic team may discover that the doing the right thing is the best thing.
With the power of the internet, it's possible that good economics can drive out bad economics. Despite his liberal tax-and-spend rhetoric, Obama's team economic team may discover that the doing the right thing is the best thing.
Putting in a bottom (2)
 The markets continue to heal, albeit slowly. As this chart shows, the VIX has fallen significantly from the highs that coincided with equity market lows. Swap spreads have been working their way lower from their highs of early October. 2-year Agency spreads have fallen by half from their Nov. 20th high. The dollar is looking very toppy here, having fallen today back to levels not seen since Oct. 21st.
Lower volatility, lower spreads, a weaker dollar and stronger gold all suggest that the Fed's injections of liquidity and Treasury's interventions have made a difference; market confidence is returning, and dollars are becoming less scarce and more abundant. The equity market appears reluctant to buy into this story of improving fundamentals however, perhaps because the resolution of the Detroit crisis is still up in the air, and the news continues to highlight economic weakness all over the globe. Plus, T-bill yields remain at zero, so we know the market remains terrified of the unknown dangers that might show up around the next corner.
Nevertheless, tension builds—between improving fundamentals on the one hand, and market pricing that discounts just about the worst scenario anyone could imagine on the other. My enduring belief in the ability of the U.S. economy to surprise its skeptics remains firm, though, so I think we'll see a positive resolution to this before too long.
Wednesday, December 10, 2008
Free trade gets a false bum rap
This is the sort of headline that makes every free-market libertarian cringe: "World Bank's `Wrong Advice' on Free Trade Left Poor Countries' Silos Empty." Excerpts from the Bloomberg article:
What should be clear to most educated readers is that the problems detailed in the article were not due to a failure of free markets or mistaken free market principles. They were due to the World Bank mandating the course of a country's development. That is not a free market principle, it is exactly the kind of thinking that has destroyed every command-and-control socialist economy. Good grief.
About 40 million people joined the ranks of the undernourished this year, bringing the estimate of the world’s hungry to 963 million of its 6.8 billion people, the Rome-based United Nations Food and Agriculture Organization said yesterday. The growth didn’t come just from natural causes. A manmade recipe for famine included corrupt governments and companies that profited on misery. Another ingredient: The World Bank’s free- market policies, which over almost three decades brought poor nations like El Salvador into global grain markets, where prices surged.
“The World Bank made one basic blunder, which is to think that markets would solve problems of such severe circumstances,” said Jeffrey Sachs, director of the Earth Institute at Columbia University and a special adviser to UN Secretary-General Ban Ki- moon.
Created in 1944, the Washington-based World Bank Group spent much of its first 35 years dispensing low-interest loans, grants and development advice to poor countries with an eye toward promoting self-reliance. In 1980, the bank’s executives began attaching conditions to loans that required “structural adjustments” in the recipients’ national economies. The mandates were designed to have poor countries cut import tariffs, reduce government’s role in enterprises such as agriculture and promote cultivation of export crops to attract foreign currency.
The World Bank has “given consistently wrong advice,” said Jose Ramos-Horta, the president of East Timor in Asia and the 1996 Nobel Peace Prize winner. “It is their advice -- that buying externally is cheaper than producing -- that has resulted in this,” he said.
What should be clear to most educated readers is that the problems detailed in the article were not due to a failure of free markets or mistaken free market principles. They were due to the World Bank mandating the course of a country's development. That is not a free market principle, it is exactly the kind of thinking that has destroyed every command-and-control socialist economy. Good grief.
Modern experience with infrastructure spending is dismal
Obama's big-spending infrastructure proposals are like the New Deal deja vu—you hear that everywhere. But Amity Shlaes reminds us that Japan's attempt to escape from its deflation/recession quicksand in the 1990s with massive public works spending was a dismal failure:
Read the whole thing.
The projects were similar to some infrastructure plans under discussion here today. Bridges? Japan put up the longest suspension bridge in the world. Airports? Kansai International, yes, on an artificial island, but also local fields such as Ibaraki Airport near Mito. Roads? Japan built new streets and highways, including the famous New Tomei Expressway. For biotech and telecommunications, Japan poured out the subsidies.
In 1999, Japan announced a scheme to create 700,000 jobs, much as Obama recently announced a plan to create or save 2.5 million jobs. Between 1992 and 2000, the Japanese launched 10 stimulus packages that included public works. The Land of the Rising Sun became the Construction State.
"The construction state is in some respects akin to the military-industrial complex in cold-war America (or the Soviet Union), sucking in the country's wealth, consuming it inefficiently, growing like a cancer and bequeathing both fiscal crisis and environmental devastation," commented Gavan McCormack, a professor at the Australian National University.
Worst, though, was the failure on jobs. In Japan, the '90s were a lost decade: The unemployment rate more than doubled and surpassed the U.S. rate.

Federal budget update -- why not cut taxes?
 With the release today of November's budget figures, the federal deficit over the past 12 months now stands at about 4.75% of GDP. That is way up from a few years ago, but it is still less than the peak deficit of 5.8% recorded in 1983. As this chart shows, the cause of the deficit is primarily a surge in bailout-related spending, and secondarily a decline in revenues. Declining revenues are not unusual during recessions, but what strikes me about this one is how little revenues have declined compared to how much they declined in the wake of the 2001 recession.
One reason for this of course is that revenues were boosted prior to the 2001 recession by the huge rise in stock prices and associated capital gains realizations; the subsequent stock market collapse caused capgains realizations to fall dramatically. That wasn't a big factor this time. So revenue swings in the early 2000s were exaggerated by stock market swings, whereas the big story today is spending growth. Very different recessions, to be sure.
If bailout spending slows down, as I think it will given mounting public opposition, then the deficit shouldn't increase a whole lot more. I'm not a fan of deficits (the current 12-month deficit adds up to almost $700 billion), but relative to the size of the economy we are still far from being in dangerous territory. The extremely low interest rates on Treasury bills and bonds tells us that even with explosive growth in the deficit the world is clamoring for more.
It would be great to see the Obama administration back off a bit from its big-spending plans and focus instead on cutting taxes. Spending on infrastructure is not necessarily a great way to stimulate the economy, since it will take an awful lot of time to happen, and it's not clear that our current difficulties have much to do with deteriorating roads or a lack of computers in our schools or a bad mix of energy production. Cutting taxes improves incentives almost immediately, on the other hand, and coaxes more of the best out of what the private sector has to offer, which is almost certain to be more effective than what government bureaucrats can come up with. And as the chart also shows, cutting taxes doesn't necessarily make the deficit worse, particularly if lower taxes help jump-start the economy like they did in the latter half of 2003.
More signs of healing
 The spread between the yield on 5-year FNMA debt and 5-year Treasuries has narrowed significantly since its peak on Nov. 20th, which not coincidentally was the low point for the equity market. I think this is one more sign that the bond market is continuing to heal itself (with help from the Fed of course). Panic selling has subsided, as investors are feeling less worried about the possibility of Freddie and Fannie defaulting on their massive debts. There is still plenty of room for things to improve, of course, but this is very important progress on the margin. And as the bond market slowly heals itself, confidence is slowly returning to the equity market as well, with the S&P 500 trading 20% higher than its November lows, and all markets apparently able to shrug off bad news. That's very good news indeed.
Tuesday, December 9, 2008
T-bill yields are zero (2)
A friend recently asked why investors are willing to accept a zero yield on T-bills. Wouldn't that also imply a negative inflation-adjusted return?
My reply: If you have money to invest and you don't want risk, you have no choice but to invest in T-bills. That's not entirely true, actually, since you could convert your funds to currency and hold the currency under your mattress. Either way you would get a zero rate of return, but T-bills give you liquidity and portability, and if you're talking about serious sums of money, T-bills eliminate the hassle and risk of acquiring, storing and disposing of currency. As for the negative real return part of the question, that depends on future inflation. Inflation according to the CPI has averaged 3.6% over the past two years, whereas T-bill yields have averaged about 3%, so that means that risk-free cash has given you a negative real rate of return of about 0.6% a year. Looking forward is another story. Right now the bond market is obsessed with the prospect of negative inflation (deflation) for the next several years; you can see that in the very high negative breakeven spreads on TIPS (e.g., 5-7% on 1- and 2-year TIPS). So on an expectations basis, investors think that an investment in T-bills offers them a handsome positive real return in addition to liquidity and portability.
If you don't believe in deflation, however, then T-bills look like an awful investment, and TIPS would be your preferred risk-free asset.
This is not deflation

 The top chart shows the inflation-adjusted price of Arab Light crude oil (adjusted using the Personal Consumption Expenditures Deflator). Oil has plunged since July, as have most commodity prices, and this in turn has sparked much discussion about deflation. A true deflation, however, is when all prices decline, not just some, and we aren't seeing that at all; witness the continued positive increase in the ex-energy (core) measures of inflation. Moreover, although the decline in oil has been fairly spectacular, oil is still, in real terms, much higher than at any time from 1986-2005. That's another way of saying that energy prices have, even net of their recent declines, risen by more than the average price level have since 1985.
The second chart compares the price of oil to the price of gold. Since gold tends to hold its real value well over time and tends to foreshadow future changes in the price level, this may give us a better feel for what is really going on with the price of oil. Compared to gold, oil is trading very close to its long-term average price; it's neither expensive nor cheap, and that's roughly the same message of the top chart.
So the take-away I get from this is that the oil price bubble has popped, and oil is now trading at a much more reasonable level from an historical perspective and relative to other prices. As John Tamny writes, it can be very confusing when prices rise and fall dramatically as they have done in recent years. This contributes to the uncertainty and lack of confidence which is affecting the entire economy. It's good that oil is back to more reasonable levels, but it's bad that the price of oil has been so volatile. In the end, the message is that this is a story that has more to do with volatility and uncertainty than it does with deflation.
Monday, December 8, 2008
Has the carry trade been unwound?
 One of the fascinating features of the massive selloff of risky assets this year has been that it appears to have a lot to do with the unwinding of "carry trades" put on in the years prior. According to the "carry trade" theory, easy money and low interest rates encouraged investors all over the world to borrow or sell dollars and buy assets such as houses, other currencies, gold, commodities, equities, and oil. Eventually the prices of these things reached untenable levels and began to reverse, with the first bubble to pop being the U.S. housing market. Falling housing prices then triggered the collapse of subprime mortgage-backed securities, which in turn prompted the collapse of the banking system and eventually the sharpest decline in U.S. equities since the Depression. This year we have seen massive declines in equities, nondollar currencies, commodities and oil, suggesting that investors and/or speculators are unwinding their carry trades: i.e., selling risky assets and buying back dollars.
This chart puts some flesh on the theory, showing that there has been a strong negative correlation between changes in the dollar and equity prices (with a stronger dollar corresponding to falling equity prices). That the dollar appears to have topped out at the same time that equities appear to have bottomed suggests that the unwinding of the carry trade may have largely run its course.
Another way to see the significance of this chart is via the lens of monetary policy. With investors and speculators all over the globe rushing to reverse carry trades, the demand for dollars was intense. The Fed was slow to respond to increased dollar demand, apparently, because the dollar strengthened sigificantly as risky assets collapsed. But recently the Fed has gone into full quantitative easing mode, with the result that the Fed's balance sheet has expanded by orders of magnitude and the Fed is doing its best to supply all the dollars that anyone could possibly want. Meanwhile, frantic selling by hedge funds and investors has kept the demand for dollars strong.
Now that the supply of dollars has caught up (or perhaps surpassed) the world's demand for dollars (and distressed selling pressure appears to have abated), this corrects one of the most severe underlying problems the economy faced this year, since without this action by the Fed we could have found ourselves in the grips of a true monetary deflation deja vu. And that could have validated all the fears of another Great Depression that were built into equity and corporate bond prices.
So a weaker dollar (and stronger gold) could be prima facie evidence that the underlying fundamentals of the economy are improving. It's no wonder that the equity market is beginning to show signs of life again.
Putting in a bottom

 I've been highlighting signs of improvement in the underlying fundamentals for several weeks now, and the equity market seems to be catching on, finally. Short-maturity swap spreads peaked in early October, and have since fallen significantly. The implied volatility of equity options peaked in late October and again on November 20th, and has since fallen. The low in the S&P 500 to date was November 21st, and the equity market is now up over 20% from that low. There are no clear signs of a bottom, of course, but the evidence is slowly accumulating.
The newspaper headlines cite Obama's nominees for cabinet posts, his apparent willingness to forget about tax hikes, and his ambitious infrastructure proposals as probable causes for the rally, but who's to say it's not just a market that is finally figuring out how to cure itself? Hedge funds have undoubtedly completed the bulk of their deleveraging by now, and anyone who feared further losses in his or her portfolio must surely have read the calamitous headlines over the past several weeks and rushed to liquidate their holdings. Whatever the reason for the recent rebound, it's nevertheless true that prices had fallen to levels that were consistent with economic destruction exceeding the depths of the Great Depression; and as long as the reality proves to be less dire than the end of civilization as we know it, prices have to rise.
If indeed we have seen the bottom, and I think we have, nerves will still be on edge. Those who sought the shelter of cash (and there are plenty who have, since the value of cash and cash-like instruments stands today at an all-time high) will now suffer the embarassment of cash, as they compare their paltry returns going forward with double-digit gains on competing investments. Those who wished they had sought the shelter of cash will now see every rally as a second and third chance at salvation. Those who suspect they may have underestimated the economy's ability to right itself (e.g., the Fed) will fear the consequences of their actions. And those who suspect that now is the time to get back into the market will wait for selloffs, only to find their fears returning as prices drop. In short, the market is going to be climbing terrifying walls of worry for a long time to come.
Subscribe to:
Posts (Atom)