Wednesday, August 28, 2019

Risk aversion is the big story, not the yield curve

This blog has discussed the importance of an inverted yield curve numerous times over the past decade. As I've noted, an inverted yield curve has preceded every recession in modern times, so it bears watching, but it's not the only thing to watch. The yield curve is inverted now, but there are other important indicators which at this time fail to confirm the yield curve signal. Market-based indicators suggest the economy and financial markets are still in reasonably healthy condition.

The most significant development is the extraordinarily low level of real and nominal interest rates in the US and in most major developed economies. I believe that very low interest rates are not necessarily a sign of an impending recession, but instead likely reflect widespread risk aversion among market participants. Moreover, widespread risk aversion lessens the chance of negative surprises.

Chart #1

As Chart #1 shows, yield curve inversions (when the red line becomes negative) have preceded every recession since the 1950s. But there is one other variable which has also preceded every recession, and that is a real Fed funds rate (blue line) that is high and rising (e.g., at least 3-4%). Currently, the real funds rate is barely positive, which means that monetary policy is far from being so tight as to strangle the economy or to starve the market of much-needed liquidity.

Only one of these two classic recession indicators is flashing red. That the other is not is due to the fact that monetary policy since 2009 has functioned in a very different way than it did prior to 2009. Prior to 2009 Fed tightening involved draining reserves (which at the time paid no interest) from the banking system, which in turn pushed up the Fed funds rate and made borrowing more expensive. It also restricted liquidity in the banking system, which often exacerbated problems stemming from rising real borrowing costs. Since late 2008, monetary policy tightening has only involved a decision by the Fed to increase the rate of interest it pays on bank reserves (something it never did before); meanwhile, bank reserves have remained abundant, and liquidity has generally remained plentiful.

Chart #2

As Chart #2 shows, the recent decline in real yields on 5-yr TIPS (from just over 1% prior to late 2018 to now zero) suggests that the market expects the economy to slow to a 2% pace going forward. As the chart further suggests, real yields on TIPS have a tendency to track the real growth trend of the economy. Today's low and negative real yields do not necessarily imply that the market is expecting a recession, more likely simply a slowdown in the pace of growth. And to date, that appears to be exactly what is happening, thanks in large part to the uncertainty and disruption caused by Trump's tariff war with China.

Chart #3


Chart #3 shows 2-yr swap spreads, which are not only excellent indicators of financial market liquidity conditions, but also excellent predictors of economic health. Swap spreads are very low these days, both in the US and in the Eurozone. This is a strong indication that liquidity remains plentiful—let's not forget the almost $1.5 trillion in excess bank reserves—and systemic risk remains low. All positive for future growth prospects.

Chart #4

Chart #4 shows that small business owners are quite optimistic about current and future business conditions. That's important, because they are the main engine of jobs growth. Optimism is up significantly since Trump's election, and Trump's efforts to slash regulatory and tax burdens get a good portion of the credit for this in my book.

Chart #5

Consumers in general are also quite confident these days, as Chart #5 shows. Trump's election helped spark a surge in consumer optimism. Healthy business and consumer optimism at the very least suggests the absence of any deterioration in the health of the economy.

Chart #6

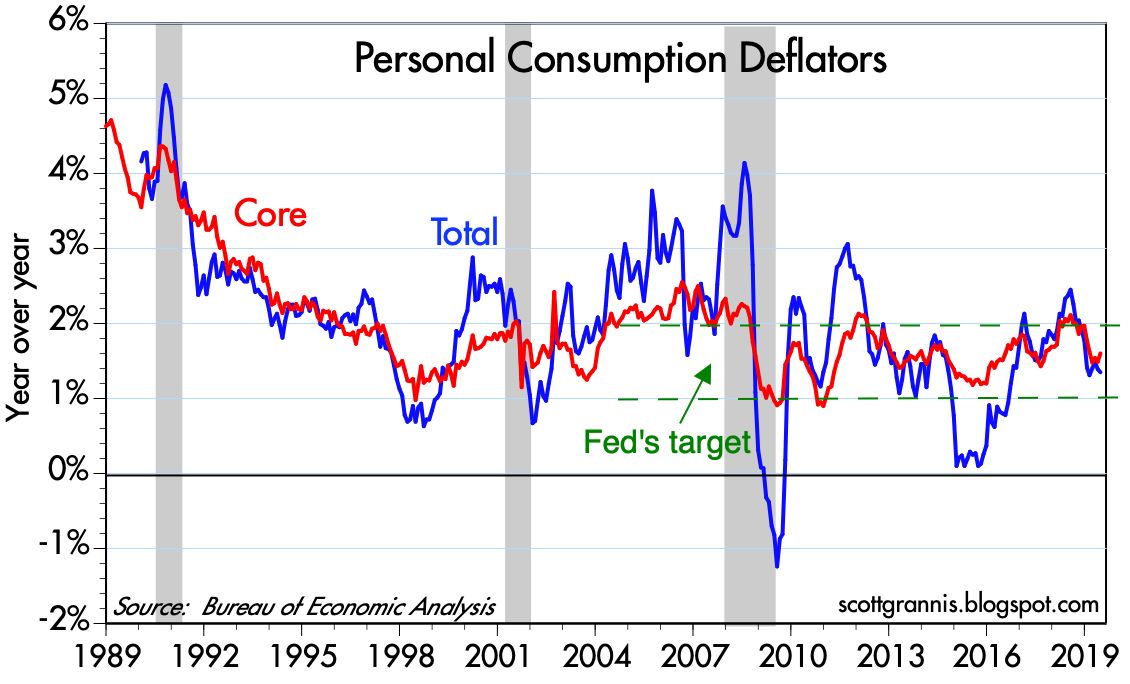
Chart #6 shows that rising inflation has typically preceded recessions. That makes perfect sense, since very tight monetary policy has been needed to bring inflation down, and as Chart #1 showed, tight monetary policy (marked by high real rates and an inverted curve) is the main reason recessions have occurred in the past. Today there is no problem at all with inflation, and thus no reason for the Fed to tighten. In fact, they are very likely to ease at the next FOMC meeting, if not before, as I argued earlier this month.

Chart #7

As Chart #7 shows, recessions have typically been preceded by rising unemployment claims. Claims are a high frequency statistic that is released with a lag of only a week or so, so they are timely indicators of the health of the labor market. Currently, claims are very low and show no sign of rising. Businesses are therefore quite happy with the size of their workforce. If anything, the main problem facing most businesses these days is the difficulty of finding new hires.

Chart 8

As Chart #8 shows, deteriorating financial conditions also precede recessions. So far there has been no significant deterioration in Bloomberg's measure of financial conditions, which is quite comprehensive.

Chart #9

Chart #10

As Charts #9 and #10 show, rising corporate credit spreads also precede recessions. Today, however, they are quite low. This means that financial market participants have little or no reason to fear a significant deterioration of corporate profitability. In fact, today's low credit spreads are a good indicator that the outlook for corporate profits (and, by inference, the economy in general) is healthy.

Chart #11

As Chart #11 shows, fixed-rate mortgages are about as cheap as they have ever been. That's one reason the housing market continues to hold up well. Consumers are not being squeezed by high rates.

Chart #12

Chart #12 is one measure of the shape of the yield curve that is looking just fine. The very long end of the curve is mostly immune to Fed policy and Fed policy expectations, unlike the front end of the curve, which is where all the inversion is happening. The long end is nicely positively-sloped, which means that the market's long-term expectations for the economy and the outlook for inflation remain healthy.

Chart #13

Chart #13 (a new chart making its first appearance on this blog) shows the 3-mo. annualized rate of growth of demand and savings deposits at U.S. banks. I consider this to be a proxy for money demand, since the interest rate paid on these deposits is very low. People hold them mainly because they want to keep their money safe. What stands out is the recent and significant increase in the amount of money being stashed in these safe havens. Not surprisingly, this coincides with the recent bout of nerves triggered by Trump's trade war with China. 

The big thing happening on the margin is a flight to quality/safety. (This shows up in the rising price of gold as well.) Strong money demand (and by inference strong risk aversion) is the driver behind the yield curve inversion, because the Fed has been slow to respond to an increased demand for money by reducing short-term interest rates. 

Chart #14

10-yr Treasury yields have plunged this year, and are now closing in on all-time lows. But it's a phenomenon that is happening all over the developed world. As Chart #14 shows, yields in Germany and Japan are much lower than ours. Strong foreign demand for Treasuries could well be one of the main drivers of lower yields, since our yields are still much higher than anything you can find in major overseas markets. In short, there is a lot of risk aversion globally, and that is creating exceptionally strong demand for government bonds.

Chart #15

Chart #15 highlights the behavior of 10-yr real yields in the U.S. and Germany (and by inference the entire Eurozone). Eurozone real yields are now at record lows, and far below their U.S. counterparts.

Chart #16

As Chart #16 suggests, the huge difference between real yields here and in overseas markets is being arbitraged by market forces. The spread between US and German real yields has been narrowing sharply so far this year, at the same time as the dollar has been rising against the Euro, because money is leaving Europe in search of higher returns in the US. 

Global risk aversion and a flight to safe havens is what's going on behind the scenes just about everywhere—not fears of recession. It shows up in very low and negative yields (because demand for sovereign bonds is extremely strong), and in rising gold prices. 

Chart #17

As Chart #17 shows, equity valuations are not out of line with the level of real yields. Both tend to move together. High real yields typically accompany strong economic growth and strong corporate profit growth, which drives PE ratios up. The equity market itself is displaying signs of risk aversion, even as PE ratios are above average; small caps are underperforming large caps, and that happens when people see slowing economic growth.

Risk aversion appears to be significant, but it's not necessarily something to worry about. A risk averse market is less prone to disappointments, and more able to withstand adverse shocks. 

Monday, August 26, 2019

The US has experienced very little warming since 2005

This post digresses from economics to dabble in the issue of "climate change." If, like me, you have read enough about the difficulties of measuring global temperatures to know that virtually all temperature datasets are and have been extensively "adjusted" after the fact to correct for a variety of factors, then you should welcome the news that our own NOAA (National Oceanic and Atmospheric Administration) has come up with a way to measure temperatures in the contiguous US that, beginning in 2005, generates data that require no adjustments, thanks to strategically placed and well thought-out monitoring stations. Here's a HT to James Taylor, who notes that:

In January 2005, NOAA began recording temperatures at its newly built U.S. Climate Reference Network (USCRN). USCRN includes 114 pristinely maintained temperature stations spaced relatively uniformly across the lower 48 states. NOAA selected locations that were far away from urban and land-development impacts that might artificially taint temperature readings. 
Prior to the USCRN going online, alarmists and skeptics sparred over the accuracy of reported temperature data. With most preexisting temperature stations located in or near urban settings that are subject to false temperature signals and create their own microclimates that change over time, government officials performed many often-controversial adjustments to the raw temperature data. Skeptics of an asserted climate crisis pointed out that most of the reported warming in the United States was non-existent in the raw temperature data, but was added to the record by government officials.

The USCRN has eliminated the need to rely on, and adjust the data from, outdated temperature stations.

What this new data show is that in the contiguous 48 states there has been a statistically insignificant amount of warming over the past 14 ½ years. Using NOAA's data, I created the following chart:

Chart #1

The green line is the best-fit trend line, and it shows that US temperatures have increased by about 0.6º F per decade, or roughly 0.06º per year. It's worth noting as well that US temperatures have been below average for most of the past year. This, at a time when headlines trumpet soaring global temperatures.

My intuition tells me that if US temperatures have barely increased at all over almost 15 years, then it is unlikely that global temperatures have increased by much more, if at all. After all, air does circulate around the globe. Climate skeptics have here one justification for being skeptical of those who warn that man-made global warming is an existential threat.


Tuesday, August 20, 2019

Another look at Truck Tonnage

Long-time readers will recall numerous posts on Truck Tonnage over the years. It's a good proxy for the physical size of the US economy, since it represents "70.2% of the tonnage carried by all modes of domestic freight transportation, including manufactured and retail goods," according to the American Trucking Association. It's been unusually volatile this year, but that could be explained at least in part by the disruptions caused by Trump's tariffs. In any event, the latest reading (July '19) shows tonnage to be still in a rising trend.

Chart #1

Chart #1 shows the Truck Tonnage Index, which is up 7.3% in the 12 months ending July '19, and up 23% since the Nov. '16 election. Using a four-month moving average to smooth out the recent volatility, the index is up almost 5% in the past year, which is a bit more than nominal GDP growth (4%) for the 12 months ending June '19. Nice.

Chart #2

Chart #2 shows the path of Retail Sales through July '19. Sales experienced a slump in late 2018 and early 2019, but now appear to have resumed a decent rate of growth (~5% over the past year). This has all the hallmarks of tariff- and uncertainty-induced disruptions which have since been absorbed.

Chart #3

Chart #3 compares Truck Tonnage to equity prices over the past 16 years. It's a pretty nice fit, and paints a bullish picture for equity prices today.

Chart #4

Chart #4 compares Truck Tonnage to the inflation-adjusted level of equity prices over the past 46 years. That they track so closely adds weight to the view that Truck Tonnage is a good proxy for the size and health of the economy. This fit supports the current level of equity prices.

Chart #5

So as not to be accused of cherry-picking the data, Chart #5 compares the much broader Dept. of Transportation's Freight Index to the nominal level of equity prices over the past 27 years (which is as far back as the Freight Index goes). Here again we see a remarkable correlation between the two over the years.

Chart #6

A closer look at the Freight Index (see Chart #6) shows that it is not as bullish as the Truck Tonnage chart (Chart #1), since it's been relatively flat for the 8 months ending in June '19. Still, it does show a rebound from the late-2018, early-2019 slump, just as truck tonnage does. I suspect the July reading will be up, considering the strong July reading for truck tonnage. Stay tuned.

UPDATE (9/13/19): The July reading for the Freight Index was indeed up, as I expected:


Monday, August 5, 2019

Round 3 of the tariff wars

The stock market hit an air pocket today, buffeted late last week by news that Trump had threatened to unleash a new round of tariffs on Chinese imports, and news today that the Chinese yuan had fallen below 7 to the dollar. For good measure, the Chinese government also announced it would retaliate by restricting imports of US agricultural products.

Yikes, thought the market, maybe this is going to turn into a full-fledged tariff war after all! Better sell now before the sh*t hits the fan!

I've mentioned before that if Trump's tariffs are going to have their intended effect, namely forcing China to lower its trade barriers and respect intellectual property rights, then the Chinese are going to have to be very worried that bad things are going to happen to their economy if they don't make a deal with Trump. It's also true that for the Chinese to take Trump seriously, just about everyone needs to be worried that Trump is out of control and the global economy is headed for a fall. If we aren't scared, the Chinese never will be.

Well, it's looking like we're getting closer to that point.

Chart #1

Chart #1 compares the level of China's forex reserves to the value of the yuan vis a vis the dollar. What this says is that the huge rise in the yuan's value leading up to 2014 was largely due to a huge influx of capital. The Bank of China was actively trying to suppress the yuan's value, since if it hadn't bought more dollars and sold more yuan, the yuan would have risen even further. But from mid-2014 to mid-2017, capital began to flee China. This forced the Bank of China to sell its forex reserves and buy yuan, otherwise the yuan would have depreciated even more against the dollar. Until recently, it seems that the Bank of China has been targeting a fixed level of reserves, and allowing the yuan to fluctuate with the winds of capital flows. The recent drop in the yuan virtually guarantees that capital is desperate to abandon China. At the same time, China's economy has been slowing. China is far more dependent on trade with the US than the US is with China. Trade disruptions are disrupting China's economy meaningfully, and that is putting increasing pressure on Chinas' leadership to make a deal. Further declines in the yuan's value will put tremendous pressure on China to make a deal, otherwise their economy could be crippled.

Chart #2

Chart #2 shows that the market's level of fear, uncertainty and doubt (as proxied by the ratio of the Vix Index to the 10-yr Treasury yield) is today as high as it has been in many years. We are in Panic Territory. Yet I note that the selloff in stocks has not been very deep so far. This could mean that the market is not really terrified, because the market realizes that although things look really bad today, they can be fixed with a simple Trump tweet or a Chinese capitulation. In any event, it's worth noting that FUD is high but stocks have not really suffered very much. But does that imply the market is over-confident? Not necessarily.

Chart #3

Chart #3 shows that the real yield curve today has inverted even more. The market is expecting the Fed to be forced into deep cuts, since otherwise an escalating trade war with China could cause serious damage to the Chinese economy, and that would inevitably be felt here at home as well. In any event, the market is sending a strong signal to the Fed that monetary conditions are too tight right now. That in turn is due to a sharp rise in risk aversion and a sharp increase in the demand for money and other safe havens, both of which have not been alleviated by offsetting Fed actions (e.g., lower rates, which have the effect of making cash and money less attractive).

Chart #4

Chart #4 shows the implied rate on Fed funds futures contracts that mature next June. The market fully expects the funds rate at that time to trade at around 1.6%, which would further imply three more 25 bps cuts to the current funds rate of 2.25%. That in turn means the market thinks the economy is going to be sucking pondwater pretty soon.

Correction: (9;28 pm PST) I need better reading glasses. This chart says that the market expects the funds rate to be 1.2% by next summer, not 1.6%. That implies four more 25 bps cuts to the current funds rate. HT: Mike Churchill

Chart #5

Chart #5 compares the price of gold to the price of 5-yr TIPS (proxied here by the inverse of their real yield). Both tend to rise in periods of uncertainty. Moreover, the recent rise could be attributed to the market thinking that the Fed has fallen so far "behind the curve" that in the end it will be forced to ease too much, and that will ignite an unwelcome rise in future inflation (gold and TIPS both promise protection from rising inflation). The market is getting pretty worried about the future, it's safe to say.

Chart #6

Chart #6 shows the spread between 10- and 30-yr Treasury bond yields. The long end of the Treasury curve has been steepening, even as the front end has been inverting. This reinforces the view that eventually the Fed is going to be forced to "reflate," and that would be bad for long-dated bond prices.

Chart #7

Chart #7 shows the yield on 10-yr Treasury bonds. Late last year it looked like bond yields had broken out of their long-term downtrend. Now it looks like that downtrend is still intact. I'm not a technical chart devotee, but there are a lot them out there, and this chart has gotten their attention, you can be sure. That US yields have fallen this low implies 1) great demand for equity hedges (which in turn implies a lot of bearish sentiment), 2 very low inflation expectations, and/or 3) a belief that the Fed is at risk of making a deflationary mistake.

Chart #8

Yet despite all the doom and gloom priced into the Treasury market, Chart #8 shows that the corporate market is only a tiny bit concerned about the outlook for corporate profits. Spreads on generic 5-yr Credit Default Swaps have only risen modestly from very low levels. Similarly, I note that swap spreads are extremely low (2-yr swap spreads have fallen to -7 bps), both here and in the Eurozone. This suggests both a dearth of safe-haven assets, and strong liquidity conditions. Investors are buying swap spreads instead of other high-quality bonds because they are trying to hedge their exposure to stocks and other risk assets—not because they are afraid the economy will collapse. As I argued in my last post, the low level of real yields and the abundance of bank reserves imply that financial conditions in the US are not deteriorating; money is not hard to come by, and therefore the economy is not at great risk of a Fed mistake.

This further suggests that the carnage being priced into assets today is still in the minds of investors, and is not yet to be found in the physical world.

Chart #9

With the rush to safe-haven assets, the PE ratio on the S&P 500 has fallen to 18.6, which gives the stock market an earnings yield of 5.4%, which is a whopping 370 bps above the yield on 10-yr Treasuries (see Chart #9). You have to go back to the scary days of the late 1970s to find an equity risk premium that high. One thing this chart says for sure: the market is quite pessimistic about the risks that the future holds.

If Trump and China figure out how to make a face-saving deal, the upside potential out there could be very impressive indeed.

Thursday, August 1, 2019

A non-fatal Fed mistake

Yesterday the FOMC decided to reduce its short-term interest rate target by 25 bps. It was a move in the right direction (as I suggested in late May), but as today's market action demonstrated, it was an overly cautious move, particularly in light of escalating global trade tensions (i.e., Trump's tariffs, which today he threatened to ratchet higher). The US economy, as well as most major global economies, are facing headwinds, uncertainties, and slower growth, all of which have increased risk-aversion and the demand for money equivalents. A 25 bps cut to short-term interest rates helps offset the world's increased demand for money (by making money and money-equivalents less attractive), but only partially.

A bigger cut would have been better, but this was not a fatal mistake. Why? Because the level of real interest rates remains relatively low, and liquidity conditions—thanks to the still-abundant supply of excess bank reserves and the low level of 2-yr swap spreads—are still quite healthy. The market is likely to be on edge for awhile, but there is still time for the Fed to correct this mistake and/or for trade tensions to dissipate and risk-aversion to recede.

Chart #1

Chart #2

Chart #1 shows 5-yr real and nominal interest rates, and the difference between the two (green line), which is the market's expectation for what the CPI will average over the next 5 years. Interest rates have declined significantly so far this year, but inflation expectations have only subsided slightly. That's because the most important decline in interest rates has been in real yields, which are a proxy for the market's expectation for future economic growth rates, as Chart #2 suggests. Real yields are down because the market is losing confidence in future economic growth prospects. Inflation expectations have also subsided somewhat, which further suggests that the market thinks monetary policy is a bit too tight.

Chart #3

Chart #3 compares the real yield on 5-yr TIPS (the best measure of market-based real yields that is readily available) with the real Fed funds rate (which is the current Fed target rate minus the rate of core PCE inflation over the past year). Bond market math dictates that the red line is what the market expects the blue line to average over the next 5 years. The market is expecting further Fed rate cuts—about 2-3 more at the present time—over the next year. This is the market's way of telegraphing to the Fed that monetary policy is too tight and that lower interest rates are needed. Note also that the blue line marks the very front end off the real yield curve, while the red line marks the intermediate area of the real yield curve. When the blue line exceeds the red line, the real yield curve is inverted (as it is now), and that is a good indication that the economy is likely to slow down. Inverted yield curves are almost always a sign of slower growth to come.

Chart #4

But the shape of the yield curve is not the whole story. The other important part of the story is the level of real yields, which is shown by the blue line in Chart #4. In the past, every recession has been preceded by high real yields and a flat or inverted yield curve. Today we have only one of those indicators: the shape of the yield curve, which is slightly inverted. Real yields remain historically low. thus, a recession is far from inevitable.

Chart #5

Prior to the Great Recession, the Fed had only one way to tighten monetary policy, and that was to reduce (or increase) the supply of bank reserves. That typically resulted in higher (or lower) short-term interest rates. Today, the Fed doesn't need to increase the supply of bank reserves in order to force short-term interest rates lower. It simply declares that it will pay a lower rate of interest on excess bank reserves, which, as Chart #5 shows, are abundant—to the tune of almost $1.5 trillion.

Chart #6

With bank reserves still abundant, swap spreads are still very low, as Chart #6 shows. This means that liquidity conditions in the financial market are very healthy. Nobody is being starved for money. Money in fact is now easier to get thanks to lower interest rates. This is a very important difference compared to prior episodes of monetary tightening or easing. Things are VERY different this time around.

It's a mistake to think that although it appears that today's monetary conditions are a bit tight (e.g, inverted yield curve, lower prices for risky assets), the economy is at risk. The Fed doesn't need to reduce interest rates in order to "bail out" the economy or to give it a shot of stimulus. The purpose of adjusting short-term interest rates lower under the current monetary regime of abundant excess reserves is not to "stimulate" the economy but rather to keep the supply of money in line with the demand for money. That, in turn, will keep financial markets healthy, avoid asset price bubbles and keep inflation low and relatively stable. Remember, monetary policy was never meant to stimulate or throttle growth. Growth is not created magically when the Fed lowers interest rates. Monetary policy is meant to keep the supply and demand for money in balance, and thus to deliver low and stable inflation, which in turn is conducive to growth.

The Powell Fed was too cautious in its decision yesterday, but it was not a fatal mistake.