Thursday, October 29, 2015

GDP from 30,000 feet

Quarterly GDP readings are notoriously volatile, and they are subject to substantial revision after the fact, so it doesn't pay to read too much into any one quarter's number. Third quarter GDP, released today, was in line with expectations, but it was disappointingly slow: a mere 1.5% annualized rate. Did the economy really take a nose dive, considering it grew at a 3.9% rate in the second quarter? Most likely not.


Given the vagaries of the quarterly numbers (see the first chart above), I've found it makes more sense to look at the rolling 2-yr annualized rate of growth of GDP, as shown in the second chart. Think of it as looking down on the economy from 30,000 feet, getting the big picture rather than the street-level map. It's clear this is a weak recovery, but notice how the pace of growth has actually picked up somewhat over the past year or so.


I'm not alone in making this observation: the bond market has figured it out too. The real yield on 5-yr TIPS has been trending higher over the past two years, tracking the rising trend in growth. The market senses that the economy is on somewhat firmer footing—even though growth is still sub-par—and thus the market is coming to accept the fact that the Fed is getting ready to raise short-term real interest rates.


In another sign that the economy is on firmer footing, weekly unemployment claims have fallen to their lowest level since 1973, and to the lowest level relative to total jobs on record (which goes back to 1967).


As the chart above suggests, the REAL big picture is one of an economy that has been growing at a sub-par pace (2.15% annualized) since the recovery began in mid-2009). If the economy had bounced back as it always did in the past, real GDP would be about 15% bigger: that translates into $2.6 trillion in "lost" income this year alone. That's arguably the measure of the cost of increased regulatory burdens, marginal tax rates that are too high, and years of Keynesian-inspired "stimulus" spending. This chart should make it painfully obvious that our highest priority should be to bend fiscal, tax, and regulatory policy in a more growth-friendly direction.

Wednesday, October 28, 2015

Who's afraid of a December rate hike?

Earlier today the FOMC temporarily rattled markets by signaling an increased likelihood that they would raise short-term rates by 25 bps at their next meeting, December 16th.(Bloomberg's implied probability of a rate hike by the December meeting rose from 35% this morning to 48% by the close.

In my view this is good news, if only because it shows that the Fed is somewhat less concerned about the economic outlook. Optimism has been in short supply for a long time now, so it's good to see less pessimism. A more-confident Fed can easily lead to more-confident markets, even if it means higher interest rates. (To be more specific: even if it means that interest rates will be less extremely low.)

In the meantime, the economy continues to grow, albeit relatively slowly, corporate profits continue to be relatively strong, markets continue to enjoy abundant liquidity, and key indicators of systemic risk remain unusually low. Moreover, it's hard (at least for me) to find evidence of irrational exuberance; on the contrary, I see lots of evidence that suggests the market is still cautious.

Arguably, it doesn't matter much whether the December FOMC meeting results in a rate hike or not. Regardless of whether the interest the Fed pays on reserves is 0.25% or 0.5%, short-term rates will be very low and monetary policy will most likely not pose a threat to economic growth for quite some time. The only thing likely to make a big difference to the outlook is the expectation of a pro-growth shift in fiscal policy, and that won't come until we get closer to next year's elections.


The equity market continues to shed its fear and uncertainty, as reflected in the decline in the ratio of the Vix index to the 10-yr Treasury yield. As fears of a China and oil patch meltdown recede, equity prices have risen.


The prices of gold and 5-yr TIPS (here proxied by the inverse of their real yield) have been slowly declining for the past several years. I have interpreted this to mean that pessimism and fear have been slowly replaced by optimism, because both gold and TIPS are assets that protect you from uncertainty. Even at current levels, gold is still trading at a substantial premium to its long-term average price in constant dollars, which I estimate to be around $500-600/oz. At today's 0.28%, real yields on 5-yr TIPS are still very low from an historical perspective, suggesting the market's expectations for real economic growth are still relatively anemic.


The real yield curve is still positively sloped (i.e., the difference between 5-year real yields and real overnight yields, shown here as the blue and red lines, respectively, is positive), which suggests that the market fully expects the Fed to be "tightening" policy in the years to come. This is to be expected in the early and middle stages of an economic expansion. If the market were really worried about a Fed tightening, and if the economy were really vulnerable to higher rates, the real yield curve would be flat or inverted, as happened prior to the past two recessions.


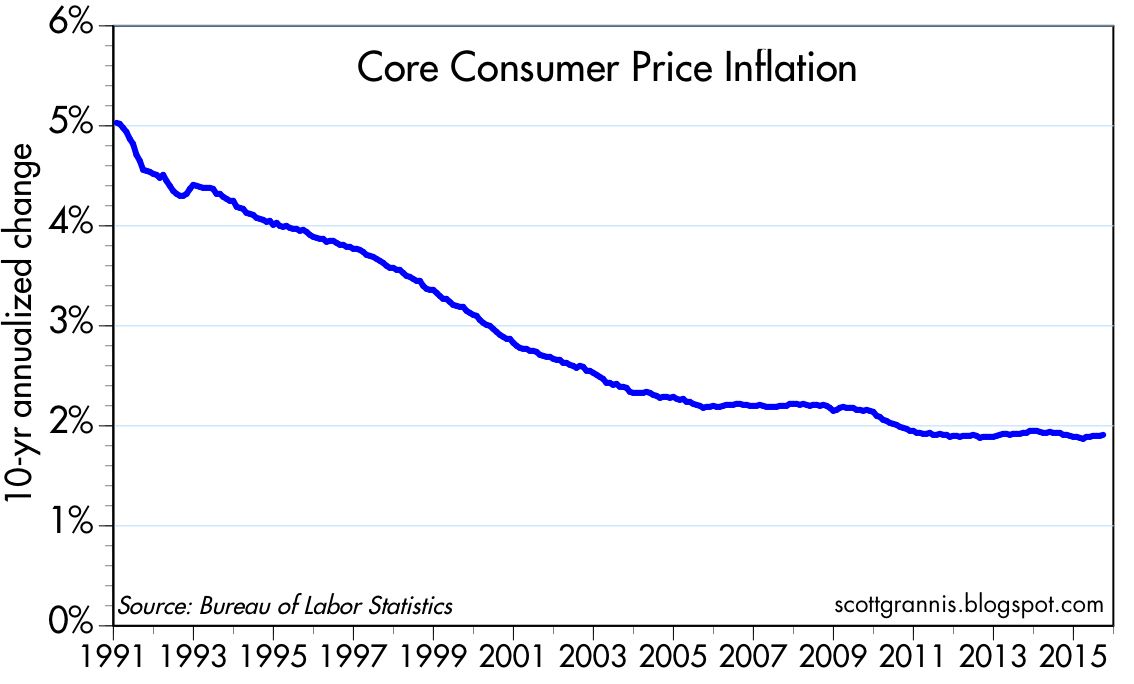
Inflation expectations (the blue line in the chart above shows the market's expectation for the average annual increase in the CPI over the next five years) are relatively low, but I think this is mainly the result of the significant decline in oil prices (red line) over the past year, as the chart suggests. As I've argued previously, the core and non-energy versions of the CPI have been running right around 2% for many years, and are likely to continue that pace. Today's low inflation expectations do not necessarily reflect monetary policy that is too tight.


The link between significant changes in real oil prices and inflation expectations holds up over long periods, as the chart above suggests.


2-yr swap spreads, shown in the chart above, are about as low as they get. If the economy and/or financial markets were really in trouble, swap spreads would be much higher. Current levels suggests that liquidity is abundant and systemic risk is very low. This is one of the healthiest indicators to be found anywhere, and it has gone largely unnoticed for years. Swap spreads are not only good coincident indicators, but also good leading indicators, and today they are telling us that economic conditions are likely to improve over the next year or so.


The S&P 500 closed today with a PE ratio of 18.5, according to Bloomberg. From an historical perspective, this is only modestly above average. Considering that corporate profits relative to GDP are at or near record levels (10% now vs. a long-term average of 6.5%), today's slightly-above-average PE ratios reflect a degree of caution and restraint.


I also find caution and restraint in the pricing of AAPL. As the chart above shows, Apple's PE ratio today of 13 is not only much lower than the market's PE, but also near the lower end of its historical range. This, despite the fact that Apple's earnings have surged over 40% in the past year, and the company is sitting on a mountain of cash—which makes its effective PE ratio more like 10. This means that the market is pricing in the expectation that Apple's earnings are likely to be flat or down for the foreseeable future. This is not unusual, since it has happened before: Apple's PE ratio was just above 10 in the first half of 2013, despite years of very strong double-digit earnings growth. That proved prescient, since Apple's earnings were subsequently flat to down for the next year. I would note, however, that while Apple's stock price averaged just over $60 in the first half of 2013, today it closed at nearly twice that.

It's fine to be cautious, but it may be premature to be bearish.

Monday, October 26, 2015

A good approach to growth-oriented policies

John Cochrane (Senior Fellow at Stanford's Hoover Institution) is one of my favorite economists. Not surprisingly, I agree with most of his positions, but more importantly, I like the way he explains why some policies are better than others. He recently wrote an essay on why economic growth is so important and what we could do to foster stronger growth. He recognizes up front that government cannot target growth, but it can pursue policies that create fertile ground for growth. The essay is long, however, with over 10,000 words. Here are some excerpts totaling just over 1,300 words that I think summarize his important points. I hope they pique your interest, and that you go on to read the whole thing.

Sclerotic growth is the overriding economic issue of our time. Looking forward, solving almost all our problems hinges on reestablishing robust economic growth. Over long periods of time, economic growth comes from one source: productivity, the value of goods and services each worker can produce in a unit of time. In turn, productivity comes from new ways of doing things. Higher productivity typically comes from new companies, which displace old companies — and displace the profits of their owners, and the healthy pay and settled lives of their managers and workers. 
More people working, and working longer hours, can improve income a bit, but soon runs in to an upper limit. Saving, investment and capital formation can improve income a bit, but its benefit is limited as well. Only new ideas, new products, new technologies, new organizations, and new skills produce such huge increases in prosperity. 
In this context, the decline of US GDP growth coincides with more worrying changes. Productivity growth is declining. New business formation is sharply down. Mobility of people from job to job has declined. 
Our economy is like a garden, but the garden is choked with weeds. Rather than look for some great new fertilizer to throw on it, why don’t we get down on our knees and pull up the weeds? 
It is tempting to cast the question before us as growth vs. redistribution, or growth vs. inequality, as the rhetoric of redistribution and inequality pervades the arguments from those who want to continue the policies that are strangling growth. 
But giving in to that rhetoric is a mistake. The US, in fact, has one of the most progressive tax systems in the world. And the relatively minor costs of government assistance to truly poor, needy, mentally ill or disabled people are not major impediments to growth. The weeds choking the economy represent cronyist redistribution to wealthy people, well-connected industries, and other powerful groups such as public employee unions, and large transfers among middle income people (social security and medicare).
When the average person (voter) expresses concern over inequality, what they really mean is that they are concerned that average people are not getting ahead economically. If the average person were getting ahead, whether some big shot CEOs fly on private jets or not would make little difference.  
The golden rule of economic policy is: Do not transfer incomes by distorting prices or slowing competition and innovation. 
The purpose of most economic regulation is to transfer money to a specific group of people, companies, or industry. It does so by slowing down new entrants, impeding competition, mandating uneconomic actions or cross-subsidies, slowing innovation, turning off price signals, distorting incentives, and encouraging waste. 
The overwhelming cost of regulation is the economic dislocation: companies not started, products not produced, innovations not innovated, people not hired, costs not slashed, prices too high. And growth too slow.

The popular debate is about “more” vs. “less” regulation. Regulation is not more or less, regulation is effective or ineffective, smarter or dumber, full of unintended consequences or well-designed, captured by industry or effective, based on rules or based on regulator whim, accountable or arbitrary, evaluated by rigorous cost benefit standards or by political winds, distorting economic activity or supporting it, and so forth.  
Like much else in America, our government works to cross purposes. It subsidizes debt with tax deductibility, deposit insurance, too big to fail guarantees, regulatory preference for holding short-term assets, liquidity rules, credit guarantees, Fannie and Freddie, the home mortgage interest deduction, community reinvestment act, student loan programs and so forth. And then it tries to regulate against using debt with bank asset regulation, stress tests, consumer financial protection, macro-prudential policy, and so on. 
The central problem of preexisting conditions was an artifact of regulation. In the ideal form of health insurance, you buy cheap catastrophic insurance when young, but the insurance policy can follow you as you age, change jobs, and move from state to state, and does not radially increase premiums if you get sick. Why don’t we have that ideal insurance? Because previous rounds of regulation outlawed it. 
We need to allow simple, portable, largely catastrophic, lifelong, guaranteed-renewable health insurance to emerge. Right now it’s illegal. To the extent that the government wishes to subsidize health insurance — and it should — then it should give straightforward vouchers, which people can use to buy insurance, or to fund health savings accounts. Such vouchers should take the place of Obamacare, Medicaid, and Medicare. 
Environmental policy at a minimum needs a far more frequent application of cost-benefit analysis! 
Practically everyone agrees on the basic structure of a growth-oriented tax reform: Lower marginal rates — the extra amount of taxes you pay on an extra dollar of income determines the disincentive to earning that income. To raise revenue at lower marginal rates, broaden the base, i.e. remove exemptions and loopholes. And massively simplify the code. 
The right corporate tax rate is zero. Corporations never pay taxes. Every dollar of taxes that a corporation pays comes from higher prices of their products, lower wages to their workers, or lower returns to their owners. 
A growth-oriented tax system taxes consumption, not income. When we tax income that is saved, or the investment income that results from past saving, we reduce the incentive to save, invest, start companies and build them, vs. enjoy consumption immediately. 
The estate tax is a particularly distorting tax on saving and investment. One may sympathize with the moral judgment that rich kids don’t “deserve” inherited wealth. But the point is on the incentives of the giver. The tax code should not give strong incentives to middle-age people to stop building their businesses, investing their money, spend their money on round the world cruises and their time with tax lawyers. Nor should it force the breakup of privately held businesses to pay taxes. Maybe the kids don’t deserve it, but if people cannot provide better lives for their children, we remove one of the strongest and oldest human incentives for economic activity. 
When we say broaden the base by removing deductions and credits, we should be serious about that. Thus, even the holy trinity of mortgage interest deduction, charitable donation deduction, and employer provided health insurance deduction should be scrapped. The extra revenue could finance a large reduction in marginal rates. 
Americans remain generous. Even without a tax incentive, Americans will give to worthy causes, as they give now to political campaigns.

A simple code makes its incentives transparent. A simple code vastly reduces compliance costs. And most of all, a simple code is much more clearly fair. Americans now look at the tax code and suspect — often rightly — that rich smart people with clever lawyers are getting away with things. Our voluntary tax code depends vitally on removing this suspicion. 
Zero is zero. If you don’t kill a tax completely, it keeps coming back like zombies in a science fiction movie. If you don’t kill a tax completely, you do nothing to simplification of the tax code. 
Indexing social security to price inflation rather than wage inflation takes care of much of the social security problem. 
Social programs are so expensive because most of them are middle class subsidies, not help for the truly poor and desperate. 
America needs a vast deregulation of its labor market. I want to work for you, you want to pay me? Good enough. 
We can end illegal immigration overnight: Make it legal. The question is, on what terms should we allow legal immigration. The immigration debate is about who is allowed to work in this country, and, later, who is allowed to become a citizen. Our Federal government has a massive program in place to stop people from working. That is immigration law.

Allowing free migration is, by many estimates the single policy change that would raise world GDP the most. If you believe in free trade in goods, and free investment, then you have to believe that free movement of people has the same benefits.

Thursday, October 22, 2015

Scaling the wall of worry


In a post two months ago I featured the chart above, noting that

Falling oil prices and Chinese growth concerns have come together in perfect-storm fashion to send global financial markets into crisis mode. As I mentioned last week, what's going on seems to have more to do with fears than with any deterioration of the economic fundamentals. It's one more in a series of "walls of worry" that the market struggles to overcome—only this time it's an oil-slick wall of worry which makes the climbing more difficult.

I've noted repeatedly since then that very low swap spreads sent a strong signal that the economic and financial fundamentals were on solid ground, despite the fears that weakness in China and in the oil patch would spread to other areas. Healthy financial markets and abundant liquidity, I argued, would allow the market to digest the problems in China and in the oil patch. Indeed, that appears to be happening.


Oil prices appear to have stabilized around $45/barrel, after dipping as low $38 in late August, and the dollar appears to have stabilized as well, trading today right around its average price over the past eight months. 

Similarly, the Chinese yuan appears to have stabilized after its mini-devaluation in early August, and the Chinese stock market also appears to have stabilized after losing one-fourth of its value in late August.


The world is not in a deflationary free-fall. As the chart above shows, the decline in commodity prices in recent years has been exaggerated by the dollar's strength (the dollar was near its all-time lows in early 2011, and is now trading around its long-term average). Measured in dollars, the CRB Raw Industrials index has fallen about 32% from its 2011 high, but measured in euros, it has fallen only 17%. Commodity prices, whether measured in euros or dollars, are still significantly higher today than they were in the early 2000s.

When the market worries that the world is on the brink of collapse, all it takes for equity prices to rally is a failure to collapse. Put another way, avoiding recession is all that matters these days.

Monday, October 19, 2015

Surprisingly strong charts

We all know this is the weakest recovery ever. Real GDP has only managed to grow by an annualized rate of 2.2% since mid-2009, and by my estimates, the economy is missing out on some $3 trillion in annual income thanks to a series of bad policy choices. Even Democrats seeking the presidency bemoan the miserable state of the economy.

We also know that there is a laundry list of problems out there in the world: slow-growing Europe is being overrun by millions fleeing the chaos in the Middle East; rogue nations either have The Bomb or will shortly; the Chinese economy has slowed from a 10% growth rate five years ago to just under 7% today; industrial commodity prices are down by a third from their 2011 highs; oil prices have plunged almost 60% since mid-2014, sending HY energy-related credit spreads to over 1000 bps and reducing the number of active drilling rigs in the U.S. by 63% from last year's highs; business investment is anemic, despite record-setting profits; the world's major central banks seem powerless to boost growth, despite years of trillions of quantitative easing and near-zero interest rates.

I could go on, but you get the point: there is absolutely no shortage of bad news and things to worry about. However, there is a real shortage of good things to cheer. What follows are some charts that highlight surprisingly strong things that are occurring in U.S. economy:


Housing starts have doubled in the past five years, and today's stronger-than-expected release of builder sentiment suggests that starts are likely to continue growing at double-digit rates. The level of starts may be disappointing in an historical context, but it is the change at the margin that is important, and that change is huge. As of last August, residential and nonresidential construction spending was up almost 14% from the previous year.


Car sales have doubled since their 2009 lows, and are up 10% in the past year. The level of sales is now quite impressive from an historical perspective.


Bank lending to small and medium-sized businesses (aka Commercial & Industrial Loans) has been growing at double-digit rates for five years, and is up over 11% in the past 12 months. Bank Credit, now $11.5 trillion, has increased over 7% in the past 12 months. Lending growth towers over the 4% nominal GDP growth of recent years.


Household balance sheets are in great shape. Credit card delinquency rates have never been so low. Real per capita net worth is at record levels. Household financial obligations are at historically low levels relative to disposable income. Households' leverage position (liabilities as a percent of total assets) has dropped by almost one third since its peak in early 2009.


The commercial real estate market is on fire. Commercial real estate prices have been growing at double-digit rates for years, and they rose 11-12% in the 12 months ended last August.


Federal revenues have been rising at a 11.3% annualized rate for the past five years, and in the past 12 months they have increased at twice the rate of nominal GDP growth. Individual income tax receipts grew 10.5% in the past 12 months. Taxes don't lie, and they don't grow like this if the economy is sick. Soaring tax receipts at the very least say that there are a lot of things going right in the economy.

The purpose of this post is not to paint an optimistic picture of the current or future U.S. economy. My point here is simply to say that there is enough good stuff going on to at least rule out another recession. And that happens to be good news, considering how worried markets are today.


Thursday, October 15, 2015

Inflation is a solid 2%

The big news today was not the 0.2% decline in the the September CPI. It was this:

Some 65 million retired and disabled Americans are about to be hit with a double whammy -- the Social Security Administration announced Thursday there will be no annual cost-of-living benefits increase in 2016 but there may be an increase in Medicare costs.

This happened because the year over year change in the CPI in the 12 months ended September was zero. But the real news is even worse, because inflation next year is very likely to be 2%. Why? Because it's averaged about 2% per year for the past 1, 5, 10 and 13 years, if you exclude energy prices from the calculation. Oil prices have fallen by more than half since mid-2014, and that is the primary factor driving CPI inflation to zero over the past year. Barring another big decline in oil prices—which looks unlikely given the 62% decline in active oil drilling rigs in the U.S. over the past year—the CPI is likely to continue growing at its long-term trend rate next year. If for no other reason than that the Fed wants the CPI to increase by at least 2%.


As the chart above shows, food and energy prices have contributed a tremendous amount of volatility to the CPI over the past decade or so, compared to the more stable "core" CPI.


The chart above plots the CPI ex-energy on a semi-log scale from early 2003 to the present. With the exception of a few years prior to and just after the Great Recession, prices by this measure have increased about 2% every year.


Going back to the core CPI, and calculating its annualized rate of increase over rolling 10-yr periods, we find that by this measure inflation stopped falling several years ago and is now averaging just about 2% a year. It may be premature to say this—especially since it goes strongly against the grain of current inflation expectations—but it's possible that the big secular decline in inflation that began in the early 1980s has run its course.


One reason the CPI is almost surely going to rise next year is the past behavior of housing prices. As the chart above suggests, the BLS' calculation of Owners' Equivalent Rent (which makes up about 25% of the CPI) tends to follow the rise in housing prices (as tracked by the Case Shiller index) with a lag of about one and a half years. The fact that housing prices are up 4-5% over the past year thus suggests that the OER will make a substantial and positive contribution to the overall CPI for most of next year.

So for those who depend on social security and disability payments for the bulk of their incomes—in addition to those who live on the near-zero interest rates on cash—2016 is very likley going to be a tough year, since their spending power is going to decline by about 2%.

Memo to Fed: it looks like you've been doing a pretty good job of targeting 2% inflation. No need to worry about raising rates whenever you feel like it. After all, savers could use some relief.

Wednesday, October 14, 2015

Still stuck in slow-growth mode

Not much to cheer about these days. The economy is still underperforming, with a lot of unused (human) capacity. But at least it is still growing—and simply avoiding a recession is a great thing, since it means that risky investments with attractive yields are likely to beat cash.


September retail sales were disappointing, but mainly because of falling energy prices. Strip out autos and gas stations and you find that sales rose 3.75% in the past year, exactly the same as their annualized growth over the past four years. The chart above shows that, as well as the potential magnitude of the general shortfall in growth (arguably as much as 15%) in the current business cycle expansion. We could be doing a lot better, to be sure, but continued growth is much better than another recession.


The August Producer Price Index suffered from the same energy-related impact. The overall index is down 4.1% in the past year, but after stripping out food and energy prices, we find that inflation at the wholesale level is running about 2%, very much in line with what we've seen for the past several years.

We're still living in a slow-growth, 2% inflation world.

That's actually remarkable, because sluggish growth and plenty of excess capacity should have resulted in years of very low or negative inflation, according to the popular but flawed Phillips Curve theory of inflation. Contrary to what many have feared, years of slow growth have not led to even slower growth or deflation. The analogy that says the economy is like an airplane approaching stall speed is not apt; neither is it instructive to worry that the U.S. may be following in the footsteps of the notoriously slow-growing Japanese economy. It takes a lot of effort (e.g., very tight monetary policy, as evidenced by high real interest rates, a flat or inverted yield curve, and soaring credit spreads, particularly swap spreads) to generate a recession in the dynamic U.S. economy.

Rather than worry that the economy is at risk of "slipping into recession and/or deflation," we should instead be talking about what needs to be done to allow the economy to grow faster. As I and most other supply-siders see it, the government basically needs to get out of the way and let the private sector do its customary magic. That boils down to cutting marginal tax rates (especially corporate tax rates!), simplifying the tax code, reducing regulatory burdens, and eliminating crony capitalism (e.g., the ex-im bank), among others. In essence, we need a Washington culture that trusts the market to fix things, instead of bureaucrats and agencies.

Thursday, October 8, 2015

Walls of worry update


The market continues to lose some of the fear and uncertainty that stems from the concern that plunging oil prices and a Chinese economic slowdown will prove contagious, bringing the global economy once again to its knees. I've argued for some time that these fears were overdone, since swap spreads have remained very low despite the sharp increase in corporate credit spreads. Very low swap spreads are evidence of abundant liquidity and healthy financial markets. They imply that big financial players (e.g., major banks and large institutional money managers) can trade amongst themselves with little or no fear of counterparty risk. This in turn reflects on the fact that systemic risk in the economy and the financial markets is very low. When financial markets are liquid and systemic risk is low, the global economy has a good chance to work through the dislocations caused by falling commodity prices.

Equities are up not because the market expects the economy to strengthen, but rather because the market is losing its fear of another recession. It was almost two years ago that I argued that avoiding recession is all that matters, and it is still valid today:

Cash and cash equivalents pay either nothing or next to nothing, while alternative investments yield much more. Cash yields are zero because the demand for money is extremely strong, and because risk aversion is very high. The Fed's QE program has been specifically designed to satisfy this extraordinary demand for money. The world eschews much higher-yielding investments in favor of accumulating record levels of cash because market participants are very afraid of an economic downturn that will reward the decision to hold cash.

We are still likely stuck in a disappointingly slow expansion for the foreseeable future. But that's a lot better than falling into another recession. This theme—that the future has turned out better than expected, despite the fact that it's been the weakest recovery ever—has appeared in numerous posts on this blog since 2009, and it's still the best explanation for why risky assets have done well. It's been a reluctant recovery and a risk-averse recovery for years, and it continues to be. When the market is priced to recession and instead we get continued growth, however weak, the prices of risk assets has to rise (i.e., the yield on risk assets has to move closer to the zero yield on cash). I don't see signs that this has gone too far. Indeed, yields on corporate bonds (especially of the high-yield variety) have become much more attractive of late.

Wednesday, October 7, 2015

Student loan bubble continues to inflate


Even as evidence mounts that households have undergone significant deleveraging in recent years, student loans continue to expand at strong double-digit rates (student loans are up almost 14% in the past year). As I wrote three years ago, the higher education bubble continues to inflate. Just as the housing crisis was fueled by government demands that banks make it easier for buyers to get a mortgage (e.g., no down payments, floating interest rates, interest-only mortgages, stated income), now we have the emerging student loan/higher education crisis that is being fueled by government demands that students have easier access to credit to finance their education.


In the chart above, we see that student loans started growing explosively in early 2009, after being essentially unchanged for the previous eight years. All of the increase in student loans since the end of 2008, almost $800 billion, was issued by the federal government, which has now essentially co-opted the entire student lending industry. The government has taken over and the mandate is to increase loans no matter what. Consumers in aggregate are deleveraging, but students are leveraging up, and many in a big way. As a percent of consumer credit, student loans are exploding skywards: up from 5.5% at the end of 2008 to almost 27% today.


This will inevitably end in tears for taxpayers, as well as for the students who have taken on onerous levels of debt. Colleges and universities will also suffer, since federal largesse in the form of a flood of new loans has enabled education costs to reach levels that are way out of line with the rest of the economy. Sooner or later, when the student loan plug is finally pulled, colleges and universities will find themselves forced to undergo the same painful restructuring and cost-cutting that devastated the residential construction sector some years ago. Meanwhile graduates are finding themselves burdened by huge levels of debt that many will not be able to service. Politicians are already greasing the wheels of a taxpayer bailout, rest assured. Debt forgiveness will take many guises, but in the end it will just be more "free stuff" that politicians promise in order to buy votes from the ignorant.


As of the end of Q2/15, households' financial burdens (debt and related obligations as a % of disposable income) were as low as they have been for over 30 years. To the extent this is a proxy for household leverage, then it's clear that households finished deleveraging almost three years ago (as I suspected). But since student debt is included in the consumer credit and household financial burden calculations, what has really happened is continued household deleveraging alongside a massive leveraging-up of students. This is what happens when the government takes over from the private sector: the lavishing of outrageous sums of credit on unsuspecting students and the unsustainable propping up of college costs.

New regulations squeeze mortgage lending

"The most terrifying words in the English language are: I'm from the government and I'm here to help." 

- Ronald Reagan

We don't often get the chance to see exactly how much harm is done by politicians and bureaucrats who "help" us by issuing burdensome new regulations that throw a wrench into the workings of the institutions (in this case banks) that make a living by actually helping us. Here's a chart which provides dramatic evidence that the Consumer Financial Protection Bureau's new, 1888-page TILA-RESPA rule (mandated by the notorious Dodd-Frank legislation), which went into effect October 1st, has had a huge impact on mortgage lending:


The chart above shows an index of new mortgage purchase applications (as distinct from refinance applications). Last week it jumped 25.5%—but that's hardly good news. What it means is that mortgage lenders were so terrified of the new paperwork, compliance burdens, and legal liabilities they faced as a result of this rule that they significantly accelerated the processing of new mortgage applications in order to get them in the pipeline before the date the new rule took effect. The rule is so burdensome and costly that many small banks and lenders may be forced to exit the business. Moreover, we're likely to see a huge decline in new purchase applications in the weeks to come, since any failure to comply with the new rules exposes lenders to liabilities of as much as $4,000 per borrower. Meanwhile, for the past year or so banks have been forced to hire expensive outside consultants to help them understand the new rules and revamp their systems and procedures. All of this just to "combine and simplify new mortgage disclosures."

This is just one example of how Dodd-Frank has burdened the financial industry, harming consumers in the process, all in the name of "protecting" consumers.

If you're interested in seeing how "hip" today's bureaucrats can be, take a look at how the CPFB whiz-kids attempt to explain in plain language what it is they're doing and why, here, and here. Sample: "'Why does it take so many pages to create something that’s supposed to be easy to use and understand?' This is a great question, one you’re not alone in asking — 1,099 is a lot of pages, as those of us who were involved in writing them can attest."


Monday, October 5, 2015

Service sector alive and well

One of the core fears that have been driving markets of late is the fear of contagion: that the collapse of oil prices would bankrupt the oil patch, and that in turn would spread to the rest of the economy; and that weakness overseas—particularly in China and in the Eurozone—would spread to the U.S economy. So far, there's very little evidence to support those fears. Today's ISM Service Sector report reaffirms the fact that the service sector—roughly 70% of the U.S. economy—is doing just fine. The Eurozone service sector is doing just fine too.


The ISM Service Sector Business Activity Index dropped last month, but remains relatively strong compared to the past two decades.


The employment subindex is very strong compare to the past two decades, suggesting that businesses in the service sector are optimistic enough about the future of their business that they are planning to ramp up the pace of hiring. The New Export Orders subindex fell to 69, but remains strong—just above its 18-yr average.


Conditions in the Eurozone service sector are not as strong as they are in the U.S., but they are as good as they have been for the past four years. The Markit PMI Service Sector Business Activity Index for China is near the low end of its three-year range, but is still still above 50, which suggests modest expansion.


It remains the case that although credit spreads are elevated, swap spreads are quite low. This suggests that market fears are not confirmed by the financial and economic fundamentals, which remain healthy. Swap spreads have typically been good leading indicators of the health of the overall economy, and they continue to suggest that conditions in the economy are more likely to improve than to worsen. Very low swap spreads are a sign of excellent liquidity conditions and a healthy financial sector. On balance, then, there is as yet no sign that weakness in the oil patch or overseas has "infected" the U.S. economy.


In response to the Fed's decision to delay liftoff, and the relatively strong service sector report, the market breathed another sigh of relief today. As fears fell, equity prices rose. We're not out of the woods yet, but we're making progress.

Friday, October 2, 2015

The Fed is powerless to boost jobs growth

September jobs growth was disappointingly slow, but there's a decent chance that all we're seeing is the typical month-to-month volatility that this series has displayed for many years. This is most likely a temporary statistical slump that will reverse in coming months. 


As the chart above shows, ADP's estimates of private sector jobs growth have been much less volatile than the BLS's establishment survey. Since the recovery began in mid-2009 through last month, the two surveys have registered almost identical total jobs growth: BLS 11.974 million, ADP 11.989 million. That's a difference of only 15K jobs, or a mere 12-13 bps. BLS numbers typically overshoot or undershoot the ADP numbers. If this pattern repeats, we should see stronger jobs numbers next month.


In any event, the chart above shows how the monthly swings in jobs growth have at times been significant. The September number was no outlier. 


But what we can't ignore is the significant shortfall in the labor force participation rate and the growth of the labor force. If past trends were still in place, we would have at least 10 million more people in the labor force today and many millions more jobs. For a variety of reasons, there are huge numbers of people who have simply "dropped out." Some reasons come quickly to mind: high marginal tax rates, huge regulatory burdens, ongoing growth in transfer payments, and generous welfare benefits. The retirement of the baby boomers is also a factor, but I have trouble believing that it was a coincidence that this kicked in right around the time that federal spending surged in early 2009. 


On a year over year basis, jobs growth today is about the same as it has been for the past five years. Earlier this year I thought that there was a chance things might be improving, but I've given up on that hope. We've been stuck in a disappointingly slow-growth economy for the past five years or so, and nothing much has changed of late.

Nevertheless, the fact that the equity market ended up on a positive note today suggests that the market has been priced to rather pessimistic growth assumptions, as I've long argued. Fears, doubts, and uncertainties have weighed heavily on investor sentiment. This is not a bubble market that is vulnerable to popping, this is a market characterized by caution. PE ratios, for example, are only about average, despite the fact that corporate profits are very close to all-time highs relative to GDP. What that tells me is that the market is priced to the expectation that economic growth and corporate profits will be very disappointing. From that perspective, today's jobs report was not a negative surprise.

I don't think it makes any difference whether the Fed postpones liftoff as a result of these numbers or not. (But I would love to see them adopt a more positive attitude and raise rates 25 bps, as that might make the rest of the country a little more optimistic as well.) Whether they launch another round of Quantitative Easing or not wouldn't make much difference either. It should be obvious by now that monetary policy is powerless to stimulate growth. How would another injection of, say, $500 billion in bank reserves (in an exchange for an equal amount of notes and bonds) make a difference to the private sector's willingness to take risk, start up a new company, hire more people, or invest in new productivity-enhancing plant and equipment, when banks are already loaded with $2.5 trillion of excess reserves? The Fed can't print money, only the banks can. And even if the Fed could print money, extra money doesn't necessarily translate into more jobs. More likely, it would just translate into higher prices.

No, the focus needs to shift away from the Fed. They've done all they needed to and all they can do. If we want a healthier economy and more jobs growth, the solution has to come from Washington. We need more growth-friendly polices that make it easier for people to create new businesses and hire more workers. We need lower marginal tax rates (especially on businesses) in order to enhance the after-tax rewards to taking risk and working harder. And we need to slash regulatory burdens to reduce the cost of doing business.

It's my hope that this will be the focus of next year's elections, and that the electorate will respond to the sensible solution—not the populist solution—to our economic woes.

UPDATE: Here's today's version of the "Wall of Worry" chart:


Thursday, October 1, 2015

Reasons to avoid panic


Markets are still very worried that the U.S. economy is going to succumb to all the nasty things going on in the world: a pronounced slowdown in the Chinese economy, the struggles of commodity-dependent economies (e.g., Brazil, Australia, Canada), the sudden reversal of fortune of the world's oil producers, and the recent heightened U.S.-Russian conflict in the Middle East. Is the world spinning out of control? Can the U.S. remain a bastion of strength in a weakened world? These are the questions that investors are struggling with as they decide whether to de-risk and seek out the safety of cash, even if that means giving up significant yield.


As the chart above suggests, fleeing corporate debt, emerging market debt, and equities implies giving up yields of 5-8% at a time when cash is yielding almost nothing.

The decision is not obvious, nor is it easy. Although it is unusual for the global economic tail to wag the huge U.S. economy dog, it's not impossible. What would be the consequences for the world if Russia effectively controls the better part of the Middle East? There's lots of uncharted water out there. Would a tiny hike in U.S. interest rates push too many fragile economies over the edge?

While pondering these uncertainties, it's important to remember that the vital signs of the U.S. economy are still reasonably healthy.


Weekly unemployment claims are within an inch of a multi-decade low. If the U.S. economy were fraying on the margin, claims would be rising, not falling.


Announced corporate layoffs have ticked up a bit in recent months, but the big rise was due to one-time troop reductions. On balance, layoff activity remains relatively muted, confirming the message of weekly claims. It's worth noting as well that only 1.87 million people in the U.S. currently are receiving jobless claims. That's a huge drop from the 2010 high of 11.65 million, and it is the lowest in almost 15 years.


This morning's ISM announcement was about as expected, but as the chart above shows, activity in the manufacturing sector has been slowing down of late. Nevertheless, the index is still well above levels that would signal an emerging recession in the overall economy.


Not surprisingly, weakness in the rest of the world has shown up in a softening of export orders to U.S. manufacturers.


As the charts above show, manufacturing activity in the Eurozone continues to expand, albeit slowly. The low level of Eurozone swap spreads reflects generally healthy financial conditions and thus points to continued growth.


Manufacturing activity may be on the soft side, but construction spending is rising at strong, double-digit growth rates. Residential construction activity is still far below the levels of a decade ago, and thus has lots of upside potential left.


Credit spreads are clearly elevated, but their message—that a weakened economy is increasing default risk—is still not yet at crisis levels. Importantly, swap spreads are quite low, which suggests that the economy still sits on strong financial bedrock. Fears are high, but systemic risks are low. Markets are very liquid, and that is a necessary if not sufficient condition for surviving the current turmoil.

UPDATE:


Car sales have doubled in the past six years, and September sales exceeded expectations. On a 3-mo. moving average basis (to filter out the monthly noise), sales are up over 6% in the past year. As the chart above shows, sales have rarely been this strong. But that's not surprising, since sales fell so much for so long that there has to be some catch-up. The U.S. auto fleet has aged meaningfully over the past six years, and it will most likely take several years of above-average growth to get back to what we previously considered "normal." So there's every reason to expect sales to continue to increase for at least the next year or so.