Showing posts sorted by relevance for query sub par recovery. Sort by date Show all posts

Tuesday, August 12, 2014

Taxes don't lie

As far as I can tell, the debate over the U.S. economy's health and growth—or lack thereof—still rages. I've argued since late 2008 that the recovery would be a sub-par recovery, mainly due to excessive government spending and inflationary/uncertain monetary policy. (See more references to a sub-par recovery here.) I've consistently argued that even though the economy would likely experience a disappointingly slow recovery, it would nevertheless be a better recovery than the market was expecting, and that would be good for equities. Both of those forecasts have been vindicated, even though I thought we'd see growth of 3-4%, and instead we've seen growth of only 2.1% since the recovery began about 5 years ago.


Meanwhile, there is no shortage of (mostly Keynesian) economists, notably Paul Krugman, arguing that the recovery has been weak because government spending stimulus was insufficient. Lately, there have been a growing number of economists arguing that the recovery has been weak because of a significant decline in government spending. To me the Keynesian arguments are weak, because they all cheered the passage of the ARRA in early 2009, one of the most significant expansions of federal spending in generations. Yet regardless of whether federal spending increased or declined relative to GDP, real growth has been pretty steady at about 2-2.5% on average for the past 5 years. You can see this in the graphs above: despite a gigantic increase in federal spending relative to GDP in 2009, and a huge, subsequent decline in spending relative to GDP, real economic growth since 2009 has been a pokey 2-2.5% throughout. We had a similar decline in spending relative to GDP in the 1990s (though it never went so high as it did in 2009), yet economic growth averaged a solid 4% per year the latter half of the 1990s, thanks in part to lower tax rates.

As a supply sider, I don't see the logic behind the theory that more government spending is stimulative and less is restrictive. How can taking money from those who are working and giving it to those who aren't create a bigger economic pie? It creates perverse incentives, for one thing. And it also channels the economy's scarce resources into the less-productive sectors of the economy. True economic growth only comes about when scarce resources are utilized in a more productive manner. I think the massive amounts of deficit-funded spending we've seen since 2008 are one of the main reasons the economy has been so weak. Bigger government is not better. With spending now having shrunk to historic norms relative to GDP, I'm tempted to say that growth has a chance of picking up.

Be that as it may, it still appears that the debate today centers around the question, Is the economy growing? I think the evidence of growth is significant, even though growth is sub-par. But one sure way to tell if we're growing and prospering is to look at tax receipts. Tax receipts don't lie: they are driven by incomes and profits and the number of people working.


As the graph above shows, federal revenues have been rising for over 4½ years. Annual federal revenues are up by almost $1 trillion from their recession lows. They are up $365 billion from their pre-recession high, for a gain of 13.7%. Most of the gain has come from individual income taxes (including capital gains taxes) and payroll taxes. That is powerful testimony to the fact that the economy is generating more jobs, higher incomes, and higher profits. Corporate taxes probably would have contributed a lot more if our corporate profits tax weren't so high, since more and more companies appear to be avoiding the repatriation of their foreign profits. These days the government is earning 35% on lots of nothing, when instead it could be earning, say, 10-15% on $500 billion or more (of repatriated profits) per year if we had the wisdom to reduce our corporate tax rate.


And in any event, as the graph above shows, federal revenues today as a % of GDP are almost exactly equal to their post-war average. Imagine how much higher they might be if this had been a robust recovery with lower and flatter tax rates!

It's the weakest recovery ever, but it is nevertheless a recovery. Taxes don't lie. And it could be a much stronger recovery if tax rates and transfer payments were reined in.

Monday, October 27, 2014

How I see things

A quick recap of how I see the current state of markets and the economy:

Inflation: Contrary to the expectations of many monetarists, including myself, inflation remains subdued. This can only mean that monetary policy has not, contrary to what most believe, been "stimulative." Inflation happens when the supply of money exceeds the demand for it; that we haven't seen higher inflation is proof that the Fed has not been printing money, as I've long argued. Quantitative Easing has been all about swapping bank reserves (T-bill substitutes) for notes and bonds. Demand for safe assets like T-bills and short-term notes has been intense, and the Fed has effectively accommodated the market's demand for safe assets. It's been a very risk-averse recovery, and had the Fed not engaged in QE, there would have been a severe shortage of the things the market has most wanted.

Growth: It's been a sub-par recovery, despite massive fiscal "stimulus." Actually, it's more correct to say that it's been a sub-par recovery because of too much government spending. Government spending, which has been dominated by transfer payments, wastes money and creates perverse incentives. It's also been a sub-par recovery because the world has been so risk-averse. Corporate profits have been abundant, but businesses have been reluctant to invest those profits due to persistent risk aversion. The U.S. economy has grown mainly because of its inherent dynamism and ability to overcome adversity, and because most people here naturally want to improve their lot in life by working harder, saving, investing, and taking risk.

The dollar: Until recently, the dollar has been very weak against virtually all currencies. This was the by-product of 1) the Fed's QE policy (which many thought would severely debase the dollar), 2) the government's massive deficit-financed spending (which increased expected tax burdens, thus depressing investment and growth), and 3) the huge increase in regulatory burdens (think Obamacare and Dodd-Frank) which have also depressed growth and investment. The dollar has improved of late because 1) the economy has done better than dismal expectations, 2) the U.S. economy is outperforming the Eurozone economy, and 3) the policy outlook is improving as elections approach and the Obama administration's agenda (which consists of a relentless effort to expand government's power and influence over the economy, which in turn dims the prospects for healthy growth) shrinks to near-nothingness.

Interest rates: It should now be abundantly clear that QE was not about lowering interest rates, and low interest rates do not stimulate growth. Interest rates have actually risen during each episode of QE. Monetary policy cannot fine-tune economic growth, and it cannot create growth out of thin air. Low interest rates may be good for borrowers, but not for lenders; in a sense, the Fed's attempts to manipulate interest rates proved to be a zero-sum game (at best). Today's low interest rates are symptomatic of the persistence of risk aversion: zero interest rates on high-quality risk-free securities reflect intense demand for those securities and that safety. In a booming economy, cash is a drag; in today's economy, cash is a refuge from uncertainty.

Equities: The stock market is not artificially inflated. Prices are up because the economy has consistently exceeded expectations, and because corporate profits are at near-record levels, both nominally and relative to GDP. The current level of PE ratios is only modestly higher than their long-term average. The earnings yield on stocks compares very favorably to the yield on corporate bonds, which is again symptomatic of a market that is risk averse.

Gold: Gold prices are still quite elevated relative to their long-term inflation-adjusted average, which I calculate to be roughly $600/oz. Gold rose because investors feared a host of potential calamities: a global financial collapse, a Middle East meltdown, and a QE-fueled explosion of inflation. Gold has fallen in recent years because those fears have been largely unrealized. Gold is still very expensive, however, because investors are still very risk averse, only somewhat less so than a few years ago. Commodity prices have tended to follow gold prices, but they are not as overextended as gold prices today.

The future: There are abundant signs that the U.S. economy continues to grow, albeit relatively slowly. This is likely to continue, and it is possible that growth could improve somewhat in the foreseeable future because: 1) government spending as a % of GDP has shrunk dramatically, thus reducing the drag of spending on growth, and 2) the policy outlook should improve in the wake of next week's elections, as policy is likely to become more business- and growth-friendly.

The Fed: Members of the FOMC are overly-impressed with their ability to "guide" the U.S. economy, and overly-concerned with the relatively low level of current inflation. Monetary policy was never meant to be an instrument for fine-tuning growth, much less creating or promoting growth. Monetary policy that is good and proper can facilitate growth, but it cannot create growth. Growth comes only from working harder, investing, and taking risk, and low interest rates do nothing in that regard. Massive changes in the way monetary policy is conducted only create uncertainty which depresses investment and growth. One key source of risk going forward is that, because of the Fed's hubris, FOMC members may fail to react in a timely fashion to signs of improving confidence and declining money demand: a failure to reverse QE in response to a decline in the demand for safe assets could result in an unwelcome abundance of money and higher inflation. At today's levels, Treasury yields offer hardly any cushion at all for this risk and are thus very unattractive. Deflation, contrary to widespread claims in the punditocracy, is not a threat to growth, and is not a black hole that captures and annihilates slow-growing economies.

All of these themes have appeared in my posts over the past 5-6 years. If anything has changed of late, it is that risk aversion appears to be on a slow decline, and the outlook for fiscal policy is improving, if only because the misguided policies of the past 5-6 years have failed so miserably. One long-enduring theme has been that the equities were likely to do well because the economy was likely to exceed expectations, which were dismal because of all the risk aversion, fears, and uncertainties that have existed.

The world doesn't change on a dime, and so many of these same themes are likely to survive for another few years at least.

Thursday, August 13, 2009

Weekly claims point to a sub-par recovery


The weight of the evidence continues to suggest that the recession has ended (probably in June) and the economy is again growing. There are some serious headwinds, however, which are likely to make this recovery less-than-satisfying. If the political winds were blowing in a more favorable direction (i.e., with true fiscal stimulus focused on increasing the incentives to work, invest, and take risk, rather than bulked-up spending, increased regulatory burdens, and tax rebates) we might expected a fairly dramatic V-shaped recovery, with growth in the range of 6-8% in the coming year. Growth of that magnitude would be a natural result of the degree to which the economy has slowed relative to its trend growth. Instead, it's looking like growth will be on the order of 3-4%, and that will leave the economy below trend and the recovery sub-par, because it will be a long time before firms need to build new capacity.

The progress of the labor market seems to be confirming this. The pace of firings has slowed, but we are still a long way from the point at which which firms begin adding jobs and firings fall to "normal" levels. Recessions can and do end when the pace of firings is still high, as this chart shows, but they don't really feel healthy and satisfying until the recovery sparks demand for new capacity and lots of new jobs. At this rate it could a few years before enough new jobs are added to relieve some of the pressures that still afflict many millions of families, even though the economy will be growing.

Tuesday, December 29, 2009

Predictions for 2010

Following the tradition I started one year ago, in which my predictions for 2009 proved amazingly accurate, here’s what I think will happen to the economy and the markets in 2010. Caveat: last year’s accuracy provides no assurance whatsoever that this year’s predictions will be accurate or profitable.

Inflation: Inflation hit a low ebb one year ago, and has been trending slowly higher since. I think inflation will continue to trend slowly higher, because all of the key leading indicators of inflation are still saying that monetary policy is accommodative: the dollar is weak, gold is strong, the yield curve is very steep, commodities are strong, breakeven inflation rates on TIPS are rising, and credit spreads are declining. I don’t see significant inflation on the horizon, but I do believe that inflation will exceed the breakeven expectations implied in the pricing of TIPS, which are currently in the neighborhood of 2-2.5%.

Growth: Thanks to a return to more normal financial market conditions, an abundance of signs that economic fundamentals are improving on the margin, and the growing pushback that is emerging against Obama’s hard-left agenda (an important development that has helped the market for most of this year), I believe the economy will grow 3-4% over the course of the year. While this represents an above-average growth rate from an historical perspective, it will be a distinctly sub-par recovery given the depth of the recession which ended about six months ago. I think the main reason for sub-par performance will be the misguided and bloated Keynesian stimulus policies enacted earlier this year, coupled with a significant increase in government regulatory burdens and government spending (mostly in the form of transfer payments), and huge federal borrowing requirements. (Not surprisingly, this puts me at odds with most Keynesian forecasters, who generally believe that the winding down of stimulus spending will cause the economy to slump in the second half of the year. Where they see slower stimulus spending hurting the economy, I see stimulus spending acting all along as a obstacle to recovery.) If the economy manages to exceed 3-4% growth, it will likely be due to the fact that corporations and individuals have a strong incentive to accelerate the receipt of income this coming year, in order to avoid the higher tax rates that are slated to take effect at the beginning of 2011.

Fed: The market currently expects the Fed to begin raising short-term interest rates in June, and the current year-end expected Fed Funds rate is approximately 1.0%. Given my relatively optimistic outlook for the economy, and my belief that inflation is likely to trend higher, I think the Fed will end up raising rates sooner and/or somewhat more aggressively than the market currently expects.

Housing: Residential construction activity is likely to slowly but gradually improve over the course of the year. Housing prices on average are likely to post modest gains as well, thanks to improving economic activity, rising incomes, relatively low interest rates, and accommodative monetary policy. Prices could dip briefly as a result of increased foreclosure activity in the first half, but this should prove to be only a temporary setback. Rising mortgage rates, since they will still be relatively low from an historical perspective, should do more to encourage a "buy it now" mentality than to discourage would-be buyers who will see that in many areas homes are more affordable than ever.

Interest rates: Interest rates on Treasury bills, notes and bonds should rise significantly over the course of the year, with 10-yr T-bond yields exceeding 4.5%. The impetus for higher rates will be a stronger-than-expected economy, and higher-than-expected inflation. Higher rates will not threaten the recovery, however, since they will occur largely as a result of the recovery. Moreover, even though I see the Fed tightening sooner than expected, I nevertheless expect them to be “behind the curve” throughout the year, much as occurred with monetary policy in the 1970s (i.e., the Fed will wait too long to raise rates and is unlikely to raise them by enough to quickly dampen inflation pressures). There is very little risk that Fed policy will be anywhere near tight enough next year to threaten the economy.

MBS spreads: Since the Fed plans to cease its purchases of MBS by March, this could push MBS spreads wider over the next few months. Regardless, MBS spreads are likely to widen over the course of the year. The main impetus for wider MBS spreads next year is likely to come from an across-the-board increase in the extension risk of MBS as Treasury yields rise.

Credit spreads: Credit spreads are likely to decline gradually over the course of the year. Easy money and a strengthening economy add up to a perfect environment for spread tightening. Easy money that leads to higher inflation and improved cash flows is a boon to borrowers, especially the most indebted ones, and that means lenders will be rewarded by lower than expected default rates. High-yield bonds and emerging market debt should be the biggest beneficiaries of tighter spreads.

Equities: Equity prices are likely to experience a few dips along the way, but they should be at least 10-20% higher by the end of the year. The onset of Fed tightening may provoke a temporary selloff, but in the end a Fed tightening is just what the economy and the markets really need to build confidence in the dollar and in the future of the economy. The main impetus to higher equity prices will be an improving economy and improving corporate profits.

Commodities: Commodity prices will continue to work their way higher over the course of the year, buoyed by an ongoing improvement in global growth conditions and accommodative monetary policy.

Gold: Gold prices are likely to spike one more time to a new high this coming year. Gold speculators will be encouraged to see that the Fed is “behind the curve” and reluctant to tighten boldly and aggressively. However, gold is a highly speculative investment at these levels, and not for the faint of heart. In the long run, gold's downside potential now greatly exceeds its upside potential.

Dollar:
The dollar is near enough to its all-time lows, both in nominal and in real terms, that it is likely to rise at least modestly against most major currencies, and it should be able to hold near its current levels against most emerging market and commodity currencies. The dollar will find support from Fed tightening, and from the growing realization that the economy is getting stronger despite all the concerns about the disturbing trends in fiscal policy and the ongoing defaults in the residential and commercial real estate markets.

Thursday, September 23, 2010

Weekly claims have been flat this year


As the top chart shows, weekly unemployment claims—abstracting from two periods in which seasonal adjustment factors proved faulty—have been essentially flat all year, averaging 465K, which also happens to be the latest weekly reading. No message here; this is entirely consistent with the sub-par recovery we've had so far.

As the second chart shows, however, the number of persons receiving unemployment compensation insurance is once again declining. In fact, the number has dropped by 1 million since the beginning of August. This could mean that more people are finding jobs, or it could mean that more people are sitting at home discouraged, or probably some of both. I think it's more of the former, and I note (again) in that regard that the household survey of private sector employment has recorded 1.8 million new jobs this year through August.

All this adds up to moderately positive news, consistent with a sub-par recovery. And again, not even a hint of a double-dip recession.

Wednesday, August 25, 2010

20 bullish charts

Pessimism is rampant, and most of the articles and commentaries I see have some doom-and-gloom flavor to them; indeed, many pundits are already claiming to see a double-dip recession either in progress or as imminent. I think the "conservative" bull case—that the economy is growing at a sub-par trend rate of 3-4%, which will leave the unemployment rate uncomfortably high for some time to come—is not getting its fair share of the news. So here is my attempt to balance the scales: a collection of charts that to me point to ongoing economic growth, however mild that might be, with not a hint of a double-dip recession. All charts contain the latest data available, and they are shown in no particular order. I've discussed all of these in recent posts, so for long-time readers this just a recap of how I see things today.


Capital spending has grown at an impressive rate since the end of the recession, with no signs yet (assuming the July numbers contained a faulty seasonal adjustment, as I detailed in an earlier post today) of any slowdown. Strong capex reflects at least some positive degree of confidence on the part of businesses, and that is a leading indicator of future growth in the economy.


Industrial production is increasing at a very fast rate, with no signs of any slowdown. Most global economies also are experiencing a rapid recovery in industrial production. This is a good indication that the cutback in production that occurred in the wake of the financial crisis was sufficient to allow a substantial inventory drawdown. Now, with demand and confidence slowly returning, production must ramp up to avoid continued inventory drawdowns. Rising production supports increased confidence, leading to a virtuous cycle that all but guarantees further gains.


Commodity prices are up across the board. This likely reflects strong growth in global demand and/or accommodative monetary policies worldwide. Whatever the case, rising commodity prices all but preclude the deflation that so many are worried about, and rule out the existence of a double-dip recession.


Global trade is rebounding strongly. Rising exports are adding to U.S. GDP growth, while strongly rising imports reflect a healthy rebound in consumer demand, which in turn likely reflects a consumer that is in better shape than most give him/her credit for.


Credit spreads have been reliable leading indicators of recessions in the past. While it's true that spreads haven't tightened on balance over the course of this year, there is no sign of any rise in spreads that might foreshadow a return to recession. In any event, it's not unusual at all for several years to pass, following a recession, before spreads return to more normal levels. The behavior of spreads today—especially swap spreads, which are currently somewhat lower than what we typically see during periods of healthy growth—is fully consistent with an ongoing, albeit relatively sub-par, recovery.


The slope of the yield curve has been an excellent leading indicator of recessions and recoveries for many decades. The curve typically flattens or inverts in advance of recessions, but today it is still very far from being flat or inverted. The curve is strongly upward-sloping, which reflects easy money and expectations that monetary policy will eventually need to tighten as the economy improves. We've never seen a recession develop when the curve was this steep and monetary policy was this easy.


The fact that the demand for temporary and part-time workers is steadily increasing may not guarantee a continued recovery, but I think it argues strongly against a double-dip recession being underway.


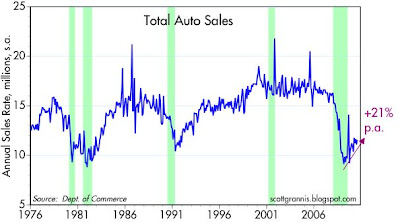
Car sales are up strongly over the past year, reflecting underlying improvement in confidence and in consumers' financial health. Car sales had fallen so much and for so long that this created pent-up demand that has the potential to be self-perpetuating. Bears focus on the fact that sales are still at abysmally low levels, but the correct way to see this is as very positive change on the margin.


Large corporate layoffs are essentially a thing of the past. It's very likely that corporations have done all or almost all of the cost-cutting that they need to do. A big decline in layoffs is almost a necessary precursor to a new wave of hiring, and that's what we're getting set up for.


China and almost all emerging market economies are growing like gangbusters, and global trade is recovering nicely. What's good for emerging market economies is good for everyone, since the more they produce the more they can buy from us.


Corporate profits typically decline in the years leading up to a recession, but for the past 18 months they have been growing strongly—which in turn is typical of the early years of a recovery. Strong profits are the fuel for future investments in new job creating ventures.


Although key indicators of financial health—most notably the Vix index, which at 27 is still significantly above its long-term average—are not in perfect shape, neither have they deteriorated enough to foreshadow any significant deterioration in the health of our financial markets.


Key indicators of shipping activity suggest that at the very least, there is no sign of any slowdown underway in global trade volumes or demand.


The Bloomberg index of the stocks of leading home builders hit a low almost 18 months ago and has more than doubled since. Prices of residential and commercial real estate have been flat to somewhat higher for more than a year. At the very least this tells us that the worst of the bad news from a housing and construction standpoint has passed. Residential construction is at an all-time low of about 2.5% of GDP, so even if things get worse, it would have only a modest impact on the overall economy.


It is arguable whether the Leading Indicators actually lead the economy, or whether they are just good coincident indicators of the economy. But in any case, they aren't even close to a level that would suggest that the economy has deteriorated to any meaningful extent. Indeed, they are at a level which strongly suggests continued growth.


Last but not least, I offer this chart which shows how the ISM manufacturing index has done a pretty good job of reflecting the underlying growth rate of the economy as a whole. Although the index doesn't match up exactly with each quarter's GDP growth rate, the recent level of the index strongly suggests that growth is still in positive territory, and that a 3-4% growth expectation for the current quarter is not unreasonable.

Thursday, April 7, 2016

The bad news is why I'm optimistic

In the seven and a half years that I've been doing this blog, I've been accused by many readers of being relentlessly and even dangerously optimistic (e.g., "do you ever seen any negatives?"). It's true that I have been reliably optimistic, even in the face of a series of selloffs and corrections. However, I've explained that my optimism is not optimism per se, but optimism relative to a market that has been generally pessimistic. Ever since early 2009 I've predicted that, while the economy was likely to grow, it would be a disappointingly sub-par recovery, mainly because of headwinds like high marginal tax rates, "stimulus" spending, increasing regulatory burdens, Obamacare, anti-business sentiment, and uncertainty surrounding the Fed's monetary policies. Even though I foresaw sub-par growth, I thought that it made sense to be bullish because the market expected even less (remember all the "double-dip recession" calls and ECRI's recession call in 2012?). So far, my optimism has been warranted.

Now, let me be specific about all the negatives I see out there, especially the relatively new ones. There are LOTS of negatives, but I'll try to be brief.


The biggest negative of them all is that the US economy is not nearly as large and as healthy as it could or should have been, had policies been better designed. This has been the weakest recovery in post-war history, and by a lot. If the economy had rebounded from the Great Recession with the same vigor it displayed in every post-war recovery, national income would be almost $3 trillion higher than it is today, as the chart above illustrates. Per capita income would be almost $9000 higher, and a family of four would be making $35K more every year. That's real money, and it explains why the electorate is so upset these days with the establishment.

As I noted some years ago, all the spending and borrowing that was supposed to "stimulate" the economy was essentially flushed down the toilet. Since 2009 we've conducted a laboratory experiment in the power of government spending to grow the economy by stimulating demand, and the result is proof that Keynesian theories are destructive, not stimulative. Neither government spending nor easy money has the power to create growth out of thin air, but politicians want to convince you that they do. The economy is weak today because we have wasted many trillions of dollars on transfer payments that only create perverse incentives to work less.

A few days ago, Treasury Secretary Jack Lew unleashed a regulatory broadside against large corporations seeking to become more competitive in an economy with an absurdly burdensome tax code. As Pfizer's Ian Read noted in today's WSJ:

This week’s Treasury action interprets the tax laws in ways never done before. This ad hoc and arbitrary attempt to single out and damage the growth opportunities of companies operating within the current law is unprecedented, unproductive and harmful to the U.S. economy. 
The action was accompanied by much unfortunate rhetoric about tax avoidance. No one was shirking their U.S. tax bills. In a merger with Allergan PLC, an Irish company, we would have continued to pay all federal, state and local taxes on our U.S. income. All that these new rules will do is create a permanent competitive advantage for foreign acquirers. Simply put, there will be more foreign acquisitions of U.S. companies resulting in fewer jobs for American workers.

If the rules can be changed arbitrarily and applied retroactively, how can any U.S. company engage in the long-term investment planning necessary to compete? The new “rules” show that there are no set rules. Political dogma is the only rule. 

Why punish our most successful companies, when it would be so much more reasonable to simply revise our tax code so that U.S. businesses are not double-taxed on their foreign income, and are not taxed at the highest rate in the developed world? If the objective is to have more money to redistribute to the "poor" it's doubly stupid, because income redistribution only creates perverse incentives. Unfortunately, we've been seeing a lot of stupid policies out of Washington, for about as long as I can remember.

Why tear down the rule of law upon which our country was built? As an aside: if Hillary escapes prosecution for what are almost certainly serial and willful violations of U.S. intelligence and secrecy laws, while the Clinton Foundation has every appearance of being massively corrupt, think of the example this sets. When rules are only for the little people, trust in government goes down the toilet almost as fast as government "stimulus" spending. Even Hillary acknowledged this when she said "There’s no daylight on the basic premise that there should be no bank too big to fail, and no individual too powerful to jail."

And then you have the problem that there is way too much ignorance of the fundamental laws of economics these days, especially among the political class. How else to explain Trump's vow to impose huge tariffs on Chinese imports? Or California's decision to raise the minimum wage to $15/hour? Or the $370 billion of M&A deals aborted on Obama's watch? These policies are virtually guaranteed to lead to perverse outcomes. It takes magical thinking to believe that a $15 minimum wage will do anything but shrink job opportunities for youth. At its worst, this exercise in hubris will lower living standards for all Californians, by sending jobs elsewhere and increasing poverty among the young. Raising the prices of Chinese imports will certainly be a negative for all consumers, but won't provide any guarantee of creating new domestic jobs.

And then you have the failure of our educational system, which has allowed a generation to grow up thinking that socialism is the wave of the future. How else to explain the huge popularity of Bernie Sanders?

I won't dwell on the Dept. of Labor's new rules which will place more onerous requirements on private sector financial advisors and push more people into government-run savings plans. (Who in their right mind would trust the government to invest your money?) Or the ongoing failure of Obamacare, which has only pushed up healthcare costs for everyone while restricting choice, all but ensuring that we will have a growing shortage of doctors in the future. Is it any wonder that the only two institutions that affect most everyone in the country and which provoke the most concern and frustrations—education and healthcare—are almost entirely under the control of government? If a private sector business delivered the miserable results that we find in education and healthcare it would have gone out of business a long time ago.

Then of course you have the problems of the slowdown in the Chinese economy and the collapse of oil prices, but these are problems which can presumably be solved if market forces are allowed to operate, as I've argued in numerous posts of late.


Now, of course none of this is a secret. The market is fully aware of all these problems, and anyone paying attention to quality news outlets and scouring the internet should not be surprised to hear it. There's lots of bad news out there, and that's why I think the market is still dominated by pessimism. The chart above makes my point: 5-yr real yields on TIPS are trading at levels which suggest that the market expects real GDP growth in the U.S. to be somewhere in the neighborhood of 1-2% per year for the foreseeable future. The market has been underestimating growth for years, and it continues to see weak growth ahead.

But it's not enough to be worried about the future, or to be optimistic. You have to match your knowledge and expectations against the expectations that are built into market prices. If you think the market is too pessimistic, as I do, then you should be optimistic, even though you don't expect real GDP growth to be more than 3% a year for the foreseeable future, and you fully expect the economy to be stuck in a slow-growth rut until policies change for the better.

I'm still optimistic, mainly because there are so many problems out there and because expectations are so dismal. But here's the kicker: if we could just fix a few things that are so easily fixable (e.g., the tax code, burdensome regulations), the potential for an upside growth surprise could be gigantic. How hard can it be to do the right thing?

Tuesday, November 17, 2020

More V-shaped signs

The latest economic data available continue to show signs of a strong recovery from very-depressed lockdown levels. Economists have known for a long time that, in general terms, the deeper the recession the stronger the recovery. This axiom was disproved, however, when the recovery following the Great Recession of 2008-09 proved to be quite sub-par. I've commented on that many times over the years.

Chart #1

Today's release of the November Homebuilders' Sentiment Index (red line in Chart #1) was almost literally off the charts. We've known for some time that the housing market was doing exceptionally well since mid-year, but this makes it clear. It also suggests that housing (and related industries) is going to be doing gangbusters in the months to come. Lots of upside potential in the housing market, helped to no small degree by super-low mortgage rates and an abundance of available credit. 

Chart #2

Industrial production in the US surged from its lows, but gains in recent months have been more tempered. But as Chart #2 shows, industrial production in the US has enjoyed a much stronger recovery than in the Eurozone. Still lots of room on the upside in both regions.

Chart #3

World trade, shown in Chart #3 (but with a regrettably long lag) has clearly rebounded strongly. This is critical for nearly every country, since global trade has been a very important engine for growth and prosperity. 

Chart #4

The outlook for China has been improving for most of the past year, as reflected in the strength of the Chinese currency (blue line in Chart #4). It's important to compare the yuan's strength and weakness to the level of China's foreign exchange reserves, since this can tell us what is driving the yuan's value. In this case we see that forex reserves have been relatively steady for about the last four years. Meanwhile, the yuan's value has fluctuated considerably. What this shows is the China's central bank has not been manipulating its currency. It's maintained a relatively neutral policy stance, allowing net capital flows to drive the currency higher or lower. In the past year, capital inflows have apparently been quite strong, and since the central bank was not trying to absorb these flows (by creating more yuan and thus expanding forex reserves), the inflows resulted in a stronger yuan. In other words, strong demand for the yuan coupled with a relatively fixed supply of yuan caused the value of the yuan to rise. This most likely means that people have been more inclined to invest in China and/or less inclined to disinvest in China. 

Chart #5

Capital inflows and increased confidence have also driven the value of Chinese equities higher, as we seen in Chart #5 (blue line). A Biden presidency is much more likely to be friendly and supportive of China than Trump's has been, and the market has picked up on that. Whether this is a positive long-term development for the US remains to be seen, but in general terms whatever is good for China is good for the world. At the very least this is yet another sign of the market's "risk-on" behavior of late.

With all this good news, it pays to keep an eye on what might go wrong. My #1 pick for a nasty surprise would be the Democrats gaining control of the Senate by capturing both of Georgia's Senate seats in an early January runoff election. That would strongly tilt the balance of power to the left, whereas the current state of affairs equates to a rather benign "divided government." Government is sometime best when it governs least, as the old saying goes.

I don't expect the Democrats to regain control of the Senate (hardly anyone does, it seems), so for the time being I remain an optimist. The Fed is not about to do anything that might harm the recovery, and the federal government is not going to try to implement a Green New Deal (which would be a futile and hugely expensive undertaking that would only harm US competitiveness while doing virtually nothing to address climate change). A divided government is quite likely to avoid economy-killing tax increases, but Biden will probably manage to reverse some of Trump's beneficial de-regulation policies. I think this paints a picture of an economy that will continue to flourish in the short-term (think V-shaped), but over the longer haul will follow the same sub-par growth path established during the Obama years.

Tuesday, July 14, 2009

Mid-year forecast review

At the end of last year I made a series of predictions. I meant to review those at mid-year, but missed by a few days. Too much sun and relaxation can do that to you, I suppose. Here's what I said back then, followed by a quick summary of where things stand now. Not too bad, I think.

Inflation: headline inflation has gone down, but core inflation hasn't; once oil prices bottom (which I think is happening), all measures of inflation will head higher; I don't see a hyperinflation yet, but I do see inflation that is significantly higher than what is priced into the bond market. The main driver of higher inflation will be the Fed's inability to withdraw its massive liquidity injections in a timely fashion; they will prefer to err on the side of inflation rather than risk a weaker economy.

Growth: the economy is going to recover sooner than the market expects, with the bottom in activity coming before mid-2009; the recovery will be sub-par however, due to the drag of increased fiscal spending and slowly rising inflation.

Housing: the bottom in construction activity has essentially arrived; whether construction drops another 10% or not is at this point immaterial; housing prices are rapidly approaching a bottom, which should come well before June '09; mortgage rates are now low enough to make a huge difference.

Interest rates: Treasury yields are essentially at their lows and will be significantly higher by the end of next year. TIPS yields will hold steady or fall as nominal yields rise.

Spreads: Spreads have seen their highs and will continue to narrow.

Equities: We have seen the lows in equity prices; equity prices will lag other risk asset prices, but they will be significantly higher by the end of next year.

Commodities: Prices are essentially at their lows; whether they drop another 10% is immaterial; prices are beginning a bottoming process; oil prices are unlikely to drop below $35; commodities may take awhile to move higher, but they will be higher within 2 years.

Dollar: The dollar is unlikely to make further gains against most major currencies, given the Fed's hyper-easy stance, and is likely to fall against emerging market currencies as commodity prices rise.
Inflation has definitely come in above expectations, as detailed in my previous post. The economy has probably bottomed recently, and is on track for a sub-par recovery. Housing looks very close to a bottom. Treasury yields are up significantly. TIPS yields are relatively unchanged. Spreads have come down signficantly. Equities are about unchanged, but have recovered significantly from the lows of early March (lows that I didn't expect). Commodities are up across the board. The dollar is slightly weaker overall, and significantly weaker relative to emerging market currencies.

Friday, January 29, 2010

Another V-sign: Chicago Purchasing Managers' Index


I don't ordinarily pay much attention to the regional components of the Purchasing Manager's index (published by the Institute for Supply Management on the first day of each month), but the Chicago index published today was such a great example of how dramatically things have changed over the past year that I couldn't resist adding it to the list of V-shaped recovery signs. It's not surprising at all that GDP grew at a 5.7% annualized pace in the fourth quarter. The recession is definitely over, and the only issue going forward is how strong the recovery will be. I'm in the camp that says we'll see 3-4% on average this year and next, but the consensus (the "new normal") seems to be calling for 2-2.5%. I think the consensus is too pessimistic; even my 3-4% represents a fairly anemic recovery, given the depth of the downturn we've just lived through.

I'm calling for a sub-par recovery because of all the wasteful government spending that is going to drain productive resources from the economy. You can't just take money from the bond market and hand it out to people in the form of subsidies and expect that to stimulate the economy. Economies grow only when people are working harder and/or producing more. True real growth thus requires hard work and investment, not just handing out money and putting people to work on projects that the private sector has already decided aren't very productive. If we want a truly impressive recovery, we'll need to cancel the stimulus spending, restructure and reduce entitlement programs, shrink government programs in general, and lower tax rates across the board.

Wednesday, November 11, 2015

The message of TIPS, gold, and PE ratios

Starting from the premise that the world's capital markets are intimately bound together—that the expectations driving stock prices are the same ones driving bond yields, for example—it should be possible to infer from the prices of different assets the market's implied economic outlook and risk preference. In other words, there ought to be one "story" that explains the market prices we observe.

This post focuses on TIPS prices, gold prices, and PE ratios, and attempts to deduce what they tell us about the assumptions embedded in the market.


The chart above compares real yields on 5-yr TIPS with the real Fed funds rate. For one, this tells us that the real yield curve today is positively sloped (i.e., short-term real rates are lower than medium-term real rates), and that, in turn, means that the market expects the Fed to tighten monetary policy going forward. Real yields on 5-yr TIPS today (0.4%) can be thought of as the market's expectation for the average real yield on Fed funds (currently about -1%) over the next 5 years. This condition must hold in a market equilibrium, leaving investors indifferent between investing overnight or for 5 years.


The chart above compares the real yield on Fed funds to the slope of the nominal yield curve. Note that the yield curve is typically positively sloped in the early stages of a business cycle recovery, but that it becomes negatively sloped in the latter stages. Why? Because inflation has typically picked up as the business cycle matures, and the Fed typically uses tighter money policy (which takes the form of higher real yields) in order to "cool off" the expansion and suppress inflation pressures. Every recession in the past 50 years has been preceded by a significant rise in real short-term yields. The shape of the yield curve today and the low level of real yields tell us that we are probably years away from another recession, because the market doesn't expect any aggressive tightening from the Fed for many years.


The chart above compares the inverse of real yields on 5-yr TIPS (using that as a proxy for their price) to the price of gold. It's rather remarkable that the two have tracked each other so well for the past 8 years, since these two assets share almost nothing in common. The one thing they do share, however, is that they are both considered to be safe-haven assets. Gold is the favored port in any economic or financial storm, while 5-yr TIPS are not only risk-free but also inflation-protected. So the fact that they are moving together suggests that what is acting on these two prices is the market's degree of risk aversion. Risk aversion was high—and demand for TIPS and golds was strong—a few years ago, when gold hit $1900/oz. and real yields fell to close to -2%. Today we see less risk aversion, because the prices of gold and TIPS have fallen. But both are still well above their long-term averages. 

The market thus seems to be transitioning from a period of high risk-aversion to lower risk aversion. As a corollary we could say that optimism was in very short supply a few years ago and is now beginning to return. But we are still far from a market which is "irrationally exuberant." With the benefit of hindsight, the market was excessively confident when gold approached $250/oz and TIPS yields were 4%, in the 2000-2001 period. 


The chart above compares real yields on 5-yr TIPS to the PE ratio of the S&P 500 (as calculated by Bloomberg). Here again we see an interesting correlation, with the exception of the 2004-2007 period. This period was one in which the Fed was aggressively tightening monetary policy, which involves forcing real short-term interest rates higher. When the Fed is not forcibly intervening in the market, real yields show a strong tendency to track PE ratios.

What does this tell us? We know that rising PE ratios tend to correlate to a rising tolerance for risk and increased optimism about the future of the economy. Investors are willing to pay more for a dollar's worth of earnings when they believe the economy—and profits—are likely to improve. Today, PE ratios of 18-19 are only slightly above their long-term average. This confirms the message of gold and TIPS, which is that the market is transitioning from being very afraid to becoming cautiously confident. Valuations, in other words are somewhere between cheap and expensive.

The economy is growing at a sub-par 2-3% rate, the market is cautiously optimistic, and the Fed is about to begin raising short-term rates in a very gradual fashion. There's nothing big to worry or get excited about, and valuations are neither cheap nor particularly expensive. We've been in a sub-par recovery for years now, thanks mainly to very high marginal tax rates, excessive regulatory burdens, and policy uncertainty, and the market seems to have fully priced this in.

So: buy stocks if you think the policy environment is going to improve, and sell stocks if you think the policy environment is going to get worse. These choices are going to become easier to make as we approach the November 2016 elections.


Monday, August 31, 2009

Thoughts on the market's huge rally


The S&P 500 is up 50% from its low on March 9th of this year. I detect a wave of sentiment that says it's time for a correction, that prices may have gone too far, too fast, that the news isn't good enough to support such high prices. But as I said in an earlier post, the market is not exactly priced to good news or even to a recovery. I showed a chart of credit spreads to illustrate my point: credit spreads are still higher than they were at the peak of the 2002 financial crisis, which at the time was the worst period for corporate bonds since the Depression. If the market is still priced to a rather grim future, I question whether or why a significant correction is in order.

The first chart makes the same case but from a different perspective. It shows Bloomberg's Financial Conditions Index, which is "the number of standard deviations that current financial conditions lie above or below the average of the 1992-June 2008 period." Financial conditions are still about one standard deviation below the levels that might correspond to "average." They are today about the same as they were during the 2001 recession and the 2002 corporate bond market collapse. In other words, current financial conditions are still far from below what might be called "healthy."

The second chart shows the history of 10-year Treasury yields. Currently at 3.42%, 10-year Treasuries are still at very low levels from an historical perspective. They've only been lower during periods of deflation and/or depression. Given the Fed's incredibly expansive policy actions, buying Treasury bonds at today's yield levels only makes sense if you think the economy is incapable of mounting a meaningful recovery, while the risk of another (or an extended) recession remains high. (I don't share this view of course.) In short, this rally has not been driven by optimism, but rather by a reduction of pessimism. The market was priced to Armageddon in March, and now it's priced to a recession.

My thesis since November of last year has been basically unchanged: I have thought that the market was overly pessimistic about the economy's future, and valuations were therefore very attractive. I have seen numerous signs, beginning last October, that leading financial market indicators, such as swap spreads, were pointing to improvement, yet the market was priced to continuing disaster. The encouraging signs I began to identify in October and November turned into "green shoots" that are now appearing almost everywhere: declining credit spreads, declining implied volatility, rising commodity prices, rising shipping rates, rising confidence, rising home sales, a bottoming in residential construction, improving manufacturing conditions, rising capital spending, declining unemployment claims, etc.

Like the market, I was blindsided by the dreadful selloff that occurred from mid-February to through early March. I think that selling climax was the market's way of expressing its horror at the degree to which fiscal policies had suddenly shifted to the left: a massive increase in so-called "stimulus spending" threatened a similarly massive increase in future tax burdens, not to mention a gargantuan increase in the public debt.

Since then, my thesis has reasserted itself. From the vantage of politics, the rally has been driven by a lessening of the horror of big government, and that in turn has been largely a function of Obama's policy prescriptions being rejected by the electorate and bogged down in Congress. Things are not turning out as badly as the market once thought. That's not to say that the future looks bright, simply that the future looks less ugly.

So my thesis is still this: the outlook for the economy that is implied by current market pricing (e.g., the level of Treasury yields, implied volatility, credit spreads and P/E ratios) appears to me to be worse than what the economy seems likely to deliver. I think we're in a recovery, but the recovery is going to be sub-par; we are likely to see growth of 3-4% per year for the next several years, but this will not be enough to get the economy back on the track that it was on for the past few decades. It's going to feel like a jobless recovery, a tepid recovery, and a frustrating recovery, but it will still be a recovery. The market expects a lot less than that, however, so it still pays to be optimistic.

Friday, August 7, 2009

Used car market looks very strong


Mark Perry has some color commentary on this, but I'll add the observation that used car prices have rebounded to pre-recession levels in a very short time frame: just 22 months. Looking back at the 2001 recession, it took 54 months for prices to recover to pre-recession levels.

That's amazing, since the 2001 recession was far milder and shorter than the recent recession. But it highlights another important fact, which is that the 2001 recession was a classic, monetary-induced recession, whereas the recent recession was a financial-crisis-induced recession. Going into the 2001 recession, Fed policy had been extraordinarily tight for several years: real interest rates were unusually high, commodity prices and gold prices were falling, the dollar was very strong, and inflation was relatively low. The recession we have just come out of was quite different, since the Fed had not been very tight: real interest rates were relatively low, commodity prices and gold prices were quite high, the dollar was very weak, and inflation was rising. Plus, the Fed has been extraordinarily accommodative during the last half of the recent recession, displaying a rare, aggressively proactive stance.

Even though the economy has suffered through a deep recession lasting some 18 months, leaving a so-called "output gap" that is unusually large (i.e., lots of excess capacity), prices for many things (e.g., commodities, used cars) are rebounding in an impressive manner. This suggests that the Phillips Curve/Output Gap theory of inflation is on increasingly shaky ground, whereas the monetary theory of inflation is doing a much better job of explaining the facts. (More on this in an earlier post here.) It also suggests that the Fed, a long-time believer in the former theory, is likely to underestimate the need for tighter monetary policy, thus moving slowly to tighten policy and increasing the risk of rising inflation in the years to come.

The rapid recovery of used car prices also suggests that the economic recovery could be a lot stronger than the consensus view, which calls for a very slow and painful recovery. I've been feeling quite uncomfortable calling for a sub-par recovery, since that leaves me smack-dab in the middle of the consensus. Maybe I should be more optimistic.

Tuesday, May 27, 2014

Onward and upward

This is still the weakest recovery ever, but the economy continues to grow and conditions continue to improve. It's a sub-par recovery, as I've been predicting for the past 5 years, mainly because the private sector has been smothered by too much government spending and too many new regulatory burdens. Things could be a whole lot better, but that is no reason to be pessimistic about the future. Indeed, there are so many things that could be fixed for the better (e.g., major reform of the tax code, the reversal of Obamacare) that the case for optimism is still compelling. As I've said many times in recent years, the economy is growing in spite of all the "help" it has received from "stimulative" fiscal and monetary policy. Pessimists see it the other way around, of course, believing that if it weren't for all the government-sponsored stimulus the economy would be a total wreck.

What follows is a series of charts which make some important points about the ongoing improvement in the economy and the financial markets.


Capital goods orders have been lackluster for over a year, but today's release of April data contained some significant upward revisions to past data. A month ago, orders appeared to be essentially flat over the past year, but they now have a modest upward tilt. As the chart above shows, orders in real terms are still substantially below their 2000 high, but they are now at a new high in nominal terms. It's still the case that businesses are very reluctant to invest—despite record-setting profits—but at least we can say that investment in productivity-enhancing capital goods is expanding, albeit slowly. As an optimist, I look at this as a glass half-full: imagine how much stronger new investment could be if taxes on capital and regulatory burdens could be reduced. The November elections hold great promise for the future if they can tip the balance of policies in a more growth- and capital-favorable direction.


According to the Case Shiller data, housing prices have recovered almost half of what they lost from their pre-recession highs. The same goes for housing starts. The recovery is more modest in real terms, but it nevertheless continues. Every day the number of households suffering from negative equity declines. There is still plenty of upside potential in the housing market.


The market capitalization of global equity markets is now at a new all-time high, having gained $38 trillion from the March 2009 low. These are huge numbers, considering that the total market cap of the U.S. equity market is currently almost $23 trillion according to Bloomberg.


Pessimists don't get excited by the above chart, which shows that the implied volatility of equity options is very close to its historic lows. They worry that because the market is not very worried these days about something going wrong, it is vulnerable to bad news. As an optimistic, I prefer to think that the market is "vulnerable" to unexpected good news. Long-time readers may remember my post from August 2012, in which I posed the question "What if something goes right?" In retrospect it was quite prescient. I still think that is the right question to ask today.


The above chart of the PE ratio of the S&P 500 shows that multiples are only slightly higher than their long-term average (according to Bloomberg calculations). That lends strong support to the view that the market is far from being overly optimistic. There is still plenty of room for multiples to expand.


Consumer confidence is at a post-recession high, but as the chart above shows, it is still far below levels associated with healthy growth and widespread prosperity, such as we had in the late 1990s. Indeed, confidence today is at levels that in the past have been associated with the onset of recessions. There is still lots of room for improvement.


As the chart above shows, Eurozone equities have been rising in line with the ongoing recovery in  U.S. equities for the past two years. In fact, Eurozone equities have recorded outsized gains over the past two years: the total return on the S&P 500 is 51%, while the Euro Stoxx 50 index has posted a total return of 77%. The Eurozone may be lagging, but it is definitely improving. 

As an aside, I couldn't help but notice the proliferation of construction cranes and road repairs as we drove through almost 2,000 miles and 5 countries' worth of European countryside earlier this month. Things are definitely improving in Europe.

There will undoubtedly be setbacks along the way, but I see little reason to doubt that things can continue to improve, albeit slowly. Onward and upward.