


Capital spending has grown at an impressive rate since the end of the recession, with no signs yet (assuming the July numbers contained a faulty seasonal adjustment, as I detailed in an earlier post today) of any slowdown. Strong capex reflects at least some positive degree of confidence on the part of businesses, and that is a leading indicator of future growth in the economy.

Industrial production is increasing at a very fast rate, with no signs of any slowdown. Most global economies also are experiencing a rapid recovery in industrial production. This is a good indication that the cutback in production that occurred in the wake of the financial crisis was sufficient to allow a substantial inventory drawdown. Now, with demand and confidence slowly returning, production must ramp up to avoid continued inventory drawdowns. Rising production supports increased confidence, leading to a virtuous cycle that all but guarantees further gains.

Commodity prices are up across the board. This likely reflects strong growth in global demand and/or accommodative monetary policies worldwide. Whatever the case, rising commodity prices all but preclude the deflation that so many are worried about, and rule out the existence of a double-dip recession.

Global trade is rebounding strongly. Rising exports are adding to U.S. GDP growth, while strongly rising imports reflect a healthy rebound in consumer demand, which in turn likely reflects a consumer that is in better shape than most give him/her credit for.


Credit spreads have been reliable leading indicators of recessions in the past. While it's true that spreads haven't tightened on balance over the course of this year, there is no sign of any rise in spreads that might foreshadow a return to recession. In any event, it's not unusual at all for several years to pass, following a recession, before spreads return to more normal levels. The behavior of spreads today—especially swap spreads, which are currently somewhat lower than what we typically see during periods of healthy growth—is fully consistent with an ongoing, albeit relatively sub-par, recovery.


The slope of the yield curve has been an excellent leading indicator of recessions and recoveries for many decades. The curve typically flattens or inverts in advance of recessions, but today it is still very far from being flat or inverted. The curve is strongly upward-sloping, which reflects easy money and expectations that monetary policy will eventually need to tighten as the economy improves. We've never seen a recession develop when the curve was this steep and monetary policy was this easy.

The fact that the demand for temporary and part-time workers is steadily increasing may not guarantee a continued recovery, but I think it argues strongly against a double-dip recession being underway.
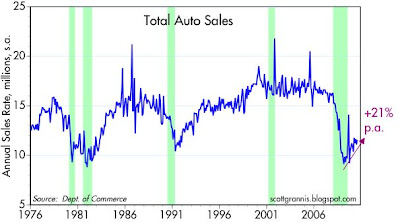
Car sales are up strongly over the past year, reflecting underlying improvement in confidence and in consumers' financial health. Car sales had fallen so much and for so long that this created pent-up demand that has the potential to be self-perpetuating. Bears focus on the fact that sales are still at abysmally low levels, but the correct way to see this is as very positive change on the margin.

Large corporate layoffs are essentially a thing of the past. It's very likely that corporations have done all or almost all of the cost-cutting that they need to do. A big decline in layoffs is almost a necessary precursor to a new wave of hiring, and that's what we're getting set up for.

China and almost all emerging market economies are growing like gangbusters, and global trade is recovering nicely. What's good for emerging market economies is good for everyone, since the more they produce the more they can buy from us.

Corporate profits typically decline in the years leading up to a recession, but for the past 18 months they have been growing strongly—which in turn is typical of the early years of a recovery. Strong profits are the fuel for future investments in new job creating ventures.

Although key indicators of financial health—most notably the Vix index, which at 27 is still significantly above its long-term average—are not in perfect shape, neither have they deteriorated enough to foreshadow any significant deterioration in the health of our financial markets.


Key indicators of shipping activity suggest that at the very least, there is no sign of any slowdown underway in global trade volumes or demand.


The Bloomberg index of the stocks of leading home builders hit a low almost 18 months ago and has more than doubled since. Prices of residential and commercial real estate have been flat to somewhat higher for more than a year. At the very least this tells us that the worst of the bad news from a housing and construction standpoint has passed. Residential construction is at an all-time low of about 2.5% of GDP, so even if things get worse, it would have only a modest impact on the overall economy.

It is arguable whether the Leading Indicators actually lead the economy, or whether they are just good coincident indicators of the economy. But in any case, they aren't even close to a level that would suggest that the economy has deteriorated to any meaningful extent. Indeed, they are at a level which strongly suggests continued growth.

Last but not least, I offer this chart which shows how the ISM manufacturing index has done a pretty good job of reflecting the underlying growth rate of the economy as a whole. Although the index doesn't match up exactly with each quarter's GDP growth rate, the recent level of the index strongly suggests that growth is still in positive territory, and that a 3-4% growth expectation for the current quarter is not unreasonable.
20 comments:
Grannis, you don't work for a Legg
Mason subsidiary anymore. You don't have to pretend to accept the coupier's cut which paid your salary since graduation from Claremont.
You don't have to be consensus anymore. Your livelihood doesn't depend on it.
If the facts change, your opinion changes. Right. Now I am certain that you are a wonderful grandfather and wish your progeny to do simple arithmetic before they enter the school system.
Here's the arithmetic:
GDP=C+I+G+(N-X)
As weighted in the economy, the arithmetic becomes
GDP =.7C + .1I + .15G - .05(N-X).
Solve the equation.
marmico: I don't work for anyone, and I contribute my considered opinions here for free. I would ask that your comments be of a constructive nature, like those of the vast majority of commenters here, otherwise I have no reason to put up with them further.
Scott, thanks again for your your efforts in putting together factual and insightful commentary for us to read and study. Very much appreciated.
Scott,
I can't agree more.
There is no requirement to put up with boorish comments.
Just because this is the internet, there is no reason to be anything but collegial and courteous.
Scott,
I'm finally getting around to reading "Panic". The authors do a fantastic job of pulling back the curtain, looking at the securities markets with a different lens. It's clarifying things I've intuitively sensed, but had not thought through as well. I appreciate the recommendation. I also very much appreciate the incredible amount of insight you share on this blog - I know you don't have to. I remain unconvinced on the bullish theme, and benefit greatly from hearing your arguments.
I may disagree with Scott Grannis, but I admire his efforts, his sincerity, his open-mindedness, and the gathering force of these 20 charts.
I hope SG is right.
I still think we need a more-aggressive Fed, but maybe we are on our way anyway.
I also admire SG's optimism--come good or bad times, a valuable trait.
randy you said:
It's clarifying things I've intuitively sensed, but had not thought through as well.
Can you share some examples of what you've learned?
Politics and economics should never get personal unless sitting at the Thanksgiving table amongst family and friends.
Otherwise, keep it civilized and on-topic.
SG has an opinion and is entitled to it. If you do not agree stick to the facts at hand.
86 the guy.
Scott, your record over the last 20 months speaks for itself. You've made excellent calls (I reference your year-end summary).
Many thanks for sharing your analysis and opinions. Very appreciated by -- mostly -- all.
I love your site. But GDP (monthly) is weak. Go here: http://www.consumerindexes.com/index.html
Does it reflect the peak of the inventory cycle?
Again, nice work.
George
Excellent presentation...
Non seasonally adjusted jobless claims...
Finally we break the May 1 NSA initial jobless claims low of 394.640....
NSA initial jobless claims....
8/20/2010 380,935
8/22/2009 457,269
8/23/2003 313,058
8/20/1983 356,900
another statistic...California is
running at a pace of 18% of Jobless
claims....the 20 year average has been around 16%....at the start of the recession this number was 12%.....
Bob:
The crux of the book is that Modern Portfolio Theory, which relies on Efficient Markets Theory – is a load of crap. Well, not entirely, but blind adherence by professionals, individuals, and government has caused major problems.
I’m sorry I don’t have time to be more thoughtful in how to respond, but here are some notes I’ve jotted down as I've been reading.
- investors (including professionals) use MPT as an excuse to not have knowledge and make judgments about what they are invested in, instead relying on MPT tenants such as diversification and risk management (such as derivatives) .
- The more investors invest by asset class rather than individual securities, the more the market will tend to move as one, intensifying herd behavior and the likelihood of panics.
- Diversification can also give a false sense of security, because investors believe they are diversified when in fact their investments are highly correlated.
- What really drives down prices is panic - investors not knowing what they have. Investors sell not because they know they have a loser, but because they cannot be sure they do not.
- The zero-sum game of the derivatives market rewards, and virtually guarantees, manipulation, deception, and illegality. Throw in the extreme leverage and the risks are compounded. Speculation replaces investment.
- MPT adherents believe higher risk always equates with higher return, in the long run. In reality, rather than embracing risk, the true entrepreneur roots out risk at every turn. But eliminating risk always has some cost. The notion that risk equates to reward is an institutional myth, a mass delusion.
- Further determination of value consists of knowledge and information. Knowledge can be somewhat embedded in capitalism - leading buyers and sellers to somewhat trust that prices are relatively in line without knowing exactly why. Information is that which is a surprise relative to knowledge. Information ( even if in error ) can overwhelm embedded knowledge. Good markets are those sufficiently ballasted with knowledge to resist panic from sudden information. Securities markets are thin on knowledge and overwhelmed by information. (Which is where I was when I saw Scott's 20 charts!)
That's about as far as I gotten. Maybe that will help and encourage reading the book!
Randy
Scott,
Excellent presentation! I am forwarding to many individuals on my email list. Your many years of experience and success is welcomed and much appreciated.
Scott,
nice presentation. Durst I ask if you're long U.S. stocks?
-DF
I've been bullish on stocks for a very long time, and remain very long stocks.
It was interesting what you said about the China's growing economy. I'm curious what your comments would be in response to these flaws predicting the burst of China's bubble. http://finance.yahoo.com/family-home/article/110393/seven-flaws-in-chinas-growth-model
The article you link to makes a number of good points that I would have difficulty disputing, and I agree with many or most of them. It does seem quite likely that China's growth will slow over time, but I doubt it will slow dramatically within the next several years. The main issue here is whether the Chinese economy will collapse within a relatively short time frame, since that would endanger the global recovery.
Post a Comment