


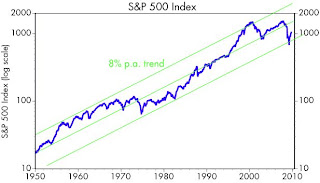
The rally that began just over six months ago has lifted the S&P 500 by a powerful 58%. Quite exciting, and I'm happy to have been bullish all the way. I thought it might be appropriate to put this rally into a long-term context with this chart. The trend lines (which represent 8% annualized growth) seem to make sense given the 6.8% annualized growth in nominal GDP over this same period. The only points I'm trying to make are 1) it doesn't seem like stocks are even close to being overvalued at these levels, and 2) there is a lot of upside potential from here.

2 comments:
I think 99% of your commentary is right on, but this chart is off. It is necessary to compare identical P/Es to correct for periods of inflation. The 50's peaked about 20 P/E and 2000 peaked at 35+P/E and these highs should not be connected. The SP500 grows in line with the eps which is an avg 6.1% since the 40's
You make a valid point, and you are basically describing the Fed Model of equity valuation. I have used a modification of that theory myself in prior posts, which in turn is a variation on Art Laffer's model. It appears to do a good job explaining variations in P/E ratios or many decades, but it has been way off the mark for several years now.
There is also a respectable theory that says that stock prices should not be affected by changes in inflation or interest rates. Interest rates are fundamentally determined by inflation. Higher inflation brings higher interest rates and higher discount factors, and that should depress P/E ratios. But higher inflation also brings faster growth in future cash flows, and over time the two should tend to offset each other.
It's also the case that stock prices should tend to rise over long periods by approximately the same rate as nominal GDP. If they didn't, then the world would be a very strange place.
Laffer's model is also interesting because it uses NIPA profits instead of the GAAP profits commonly used for P/E ratios. Again, no one has a lock on the correct way to do these things.
So I'm perhaps guilty of fudging things a bit, but not completely. There is no ironclad way of describing or predicting equity valuations, at least that I'm aware of.
Post a Comment