Showing posts sorted by relevance for query real Fed funds. Sort by date Show all posts

Wednesday, March 18, 2015

How to know if Fed policy is a threat to growth

There's a way to judge whether monetary policy is likely to pose a threat to economic growth, and I lay it out in this post. It involves looking at the real Federal funds rate (using the Interest on Reserves that the Fed pays as a proxy), the real yield on 5-yr TIPS, and the slope of the nominal and real yield curves. If overnight real yields are high (>3%), if they exceed the real yield on 5-yr TIPs, and if the nominal and real yield curves are flat or negatively sloped, then monetary policy poses a clear and present danger to the economy. By these standards, monetary policy currently poses little or no risk to the economy. The risk of recession is consequently very low for the foreseeable future. Today's market action suggests that the market has been excessively concerned about the threat of monetary policy. That reinforces my long-held belief that the market still has a healthy amount of risk aversion, and is therefore not over priced.


When judging the impact of monetary policy on the economy, it's important to remember that the level of nominal short-term interest rates is far less important than the level of real short-term interest rates. For example, 10% nominal interest rates are far less burdensome in a world of 10% inflation than in a world of 1% inflation. The FOMC in the past has stated clearly that although its main monetary tool/target is the overnight Fed funds rate, what it is really targeting is the real overnight Fed funds rate. When they want to slow the economy and/or bring inflation down, the FOMC raises real short-term rates; when they want to "stimulate" the economy the FOMC seeks to lower real short-term interest rates. 

As the chart above shows, the real Fed funds rate has been negative for the past seven years, and is currently about -1%: the difference between the 1.3% year over year rise in the PCE Core deflator, the Fed's preferred measure of inflation, and the interest rate paid on reserves of 0.25%. 


So the Fed's primary policy tool is the real Fed funds rate, and that determines the risk-free yield for the front end of the real yield curve. The market's assessment of the future path of the real Fed funds rate is what determines real yields across the maturity spectrum; that in turn is a function of Fed guidance and the market's view of the future strength of the economy and the direction of inflation. If the market expects the Fed to raise real short-term yields over time, the real yield curve will be upward sloping; if the market comes to believe that the Fed will begin to reduce short-term real yields, then the yield curve flattens and eventually inverts. Fortunately, the real yield on TIPS (which are default free and inflation-protected) is a handy, liquid, and market-based indicator of the expected future path of the real Fed funds rate. In my opinion, TIPS are one of the most under-appreciated of all economic and financial indicators.

As the chart above shows, it is the combination of the level of the real Fed funds rate and the market's perception of the future direction of real yields that can tell us volumes about the health of the economy. Every recession in the past 55 years has been preceded by a significant increase in the real Fed funds rate (blue line) and a flattening or inversion of the yield curve (red line). When the market begins to sense that the Fed will eventually need to reduce real short-term rates (i.e., when the yield curve flattens and/or inverts), that is the time when monetary policy has finally begun to weaken the economy, and that in turn will force the Fed to respond with a reduction in real interest rates. Today, the real overnight rate is very low and both the nominal and real yield curves are positively sloped, so the risk of recession or even an economic slowdown is minimal, according to this model.


The chart above compares the real Fed funds rate to the real yield on 5-yr TIPS. When the real yield on 5-yr TIPS is higher than the real overnight yield, as it is today, the real yield curve is by definition positively sloped, which means the market expects that the Fed will be raising rates for the foreseeable future. It's when the real yield curve becomes inverted (when short-term real yields equal or exceed 5-yr real yields) that monetary policy becomes a threat to the health of the economy, because a flat or negatively-sloped real yield curve tells us that the market senses that the Fed can no longer raise rates and will soon have to lower them in response to a weakening economy. That (an inverted real yield curve) happened prior to both of the last two recessions, and at a time when real yields in general were much higher than they are today. Once again, the conclusion is that monetary policy today is not even remotely a threat to growth, nor is there a significant likelihood of an economic slowdown or recession.

Using the past as a guide to the future, we ought to start worrying about Fed policy only when the real Fed funds rate rises significantly and starts to approach or exceed the real yield on 5-yr TIPS. Today, that means the Fed could raise the interest rate it pays on reserves by 50 or 75 bps without threatening the health of the economy. The Eurodollar futures market says the Fed won't raise its target rate by that much until about a year from now. If by that time the economy has gathered a bit more steam and/or real TIPS yields have increased, then even a 0.75% or 1% Fed funds rate a year from now (which would equate to a real Fed funds rate of -0.5% or -0.3%) shouldn't be a problem at all. Monetary policy would still be "easy."


For investors, this strongly suggests that cash and cash equivalents are an inferior asset class. Yields on almost all other asset classes are substantially higher, and likely to remain so for the foreseeable future because of the low risk of an economic slowdown or recession.

Friday, April 8, 2022

Better measures of the yield curve


The shape of the Treasury yield curve continues to be a subject of great interest to the market, due to the now-widespread belief that a flat or negatively-sloped yield curve is a sure-fire harbinger of recession. I've disagreed with this of late, because while a negatively-sloped yield curve has in fact preceded almost all of the recessions in the past 50 years (with the notable exception of the economic collapse brought on by Covid shutdowns), there are other indicators (e.g., real yields, swap spreads, credit spreads) which also must be observed if one is to reliably anticipate recessions.

So the shape of the yield curve can help, but it's not bullet-proof. And to complicate things further, there are a variety of ways to measure the shape of the yield curve, and they often give conflicting signals.

Most discussions of the shape of the yield curve revolve around the spread between 2- and 10-yr Treasuries (the 2-10 spread), but increasingly I'm seeing market pundits refer to the 2-5 spread, the 5-10 spread, and the 10-30 spread. Anyone attempting to follow these various spreads can become quickly confused. As I write this, the 5-10 spread is negative (-5 bps), while the 2-10 spread is positive (20 bps) and the 10-30 spread is almost flat (3 bps).

This begs the question: which measure of the slope of the yield curve is the most reliable guide to recessions?

The spread I have generally preferred is the 1-10 spread (shown in Chart #1), but there's one I think is even better: the spread between the real Fed funds rate and the real yield on 5-yr TIPS (Chart #2). Here I'm referring the real yield curve, not the commonly-used nominal curve. Real yields, after all, are far more important than nominal yields because they reflect the true cost of borrowing and the true returns to saving, and those are what create the most powerful incentives in the economy. The Fed is right when it says that it is not actually targeting the nominal Fed funds rate, but instead the real Fed funds rate; that is the best measure of the stance of monetary policy, and that is what a good yield curve analysis should focus on as its starting point (i.e., the overnight Fed funds rate after adjustment for inflation).

Chart #1

I have been featuring numerous updates of Chart #1 for as long as I can remember. It compares the real Fed funds rate (blue line), which is derived from the difference between the current funds rate and the most recent 12-mo. change in the Core Personal Consumption Deflator (the Fed's favorite measure of inflation), to the difference between the yield on 1- and 10-yr Treasuries (red line). Note that the red line is zero or less in advance of every recession and the blue line reaches at least 3-4%. I think it takes both conditions to equate to a high probability of an impending recession. Today, neither suggests an impending recession—not even close.

Chart #2

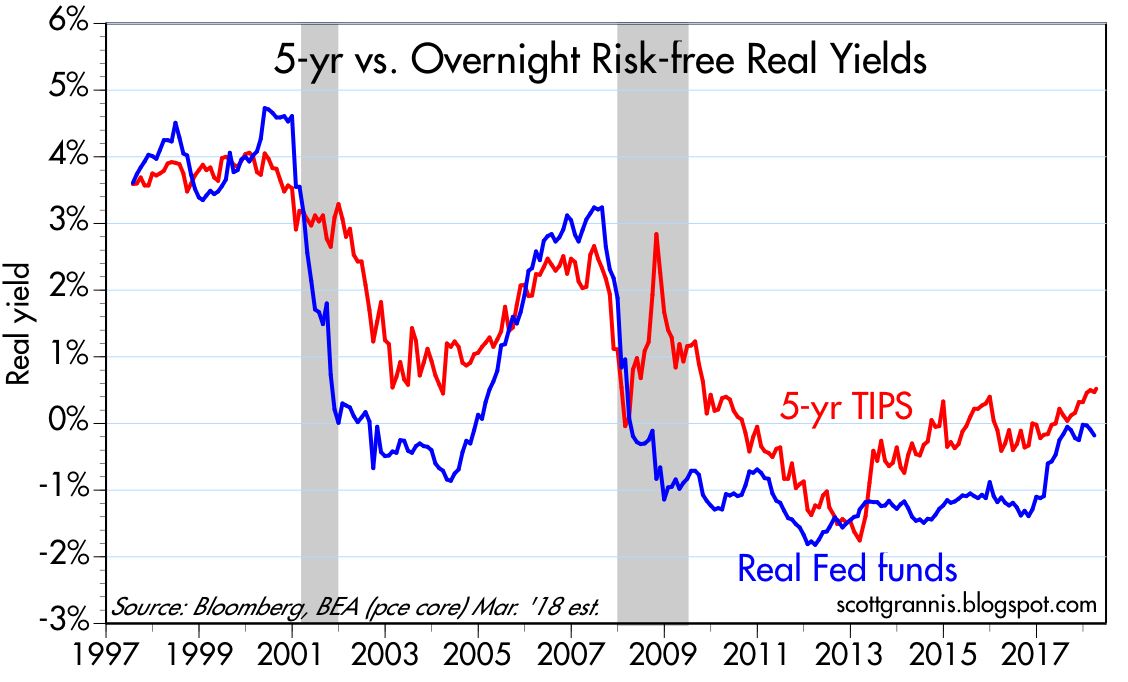
Chart #2 compares the real yield on 5-yr TIPS (red line) to the real Fed funds rate (blue line). (It only goes back to 1997 because that was the year the Treasury began issuing TIPS.) I would argue that this chart gives us a very accurate indication of the slope of the Treasury curve for several reasons: 1) it uses real yields, which are the best measure of how Treasury yields are perceived by the market and how they impact the economy, 2) the Fed itself prefers the real funds rate as the most accurate indicator of the effective stance of monetary policy, and 3) it uses 5-yr real yields on TIPS as the best measure of what the market expects Fed policy to do in coming years. (In bond market-speak, the real yield on 5-yr TIPS is equivalent to what the market expects the real Fed funds rate to average over the next 5 years.) According to this chart, the real yield curve is very positively sloped, with the difference between overnight real yields and 5-yr real yields being more than 5%.

So this chart shows us what the Fed is doing now and what it is expected to do in the future. Clearly, the Fed is "behind the curve" because it is going to have to be doing a lot of rate-hiking in coming years. That's what a very positively-sloped real yield curve tells us. The risk of recession will rise only as the real yield curve flattens. 

In other words, when the red line exceeds the blue line, the market is expecting the Fed to tighten policy in the future, whereas when the blue line exceeds the red line, the market is expecting the Fed to ease policy in the future. The former is consistent with the Fed being behind the inflation curve, and the latter consistent with being "tight." Note that each of the three recessions shown here were proceeded by a period in which the blue line exceeded the red line: those periods were witness to very tight Fed policy—so tight that the market became convinced that the Fed would inevitably ease policy because the economy would be negatively impacted. And the economy indeed subsequently collapsed.

Thursday, April 12, 2018

Reading the yield curve's message

If you haven't already heard that an inverted Treasury yield curve is a good predictor of recessions, then either you haven't been reading this blog for long or you haven't been reading much in the financial press of late. (For background, see some earlier posts of mine on the subject here and here.) The subject has become the focus of attention in recent months because the yield curve has been flattening, which in turn has sparked concerns that the risk of recession is rising. These concerns are misplaced, as I explain below.

Chart #1


The top portion of Chart #1 is the standard way to display the status of the Treasury yield curve. It represents the difference between the two lines on the bottom portion: the difference or "spread" between 10-yr and 2-yr Treasury yields. The spread is effectively a measure of the slope of the yield curve, which indeed is relatively flat compared to where it was several years ago. But it's not flat nor is it inverted; it is still positively-sloped, and that means the market believes the Fed is justified in saying it plans to increase rates modestly over the next year or so. The relative flatness of the yield curve is not saying that the Fed is tightening too much or threatening growth, it's best characterized as the market's way of saying that economic growth expectations are neither exciting nor worrisome. I explain this a bit more below.

Chart #2

Chart #2 is another way of looking at the yield curve—a better way, since it gives us some important additional information. The red line in Chart #2 is similar to the blue line in Chart #1, but the blue line in Chart #2 is the important addition: it shows the real, inflation-adjusted Fed funds rate, which is the overnight rate that the Fed targets. The Fed these days has absolute control over the nominal funds rate, while the rest of the nominal yield curve is essentially a projection of what the market thinks the funds rate will average over time. Any yield curve analysis worth its salt should measure not only the slope of the Treasury curve, but also consider the level of the real Fed funds rate.

The Fed doesn't just target the funds rate. What it really targets—but rarely talks about—is the real funds rate. Borrowing money at 5% when inflation is 1% is one thing, but borrowing money at 5% when inflation is 10% is quite another (the former means borrowing is expensive, the latter means borrowing money is a good way to make money). Real borrowing costs are what truly affect behavior. When money is very expensive—when real borrowing costs are high—people are discouraged from borrowing and spending and are encouraged to save money; eventually, if real rates are forced too high, economic activity suffers. That's been the proximate cause of every one of the recessions in the past 60 years.

One thing that stands out in Chart #2 is that the real funds rate has been negative for the past decade. Doomsayers think this means the Fed has been flooding the world with money, and the sky will soon be falling. Monetarists reason that, since we have seen neither a collapse of the dollar nor soaring inflation over the past decade, this can only mean one thing: the demand for short-term financial assets has been incredibly strong for many years (another way of saying that the market has been very risk averse for most of the past decade), and, moreover, the Fed hasn't artificially depressed interest rates, nor has it flooded the market with money no one wanted. The Fed has kept rates low because the demand for money has been strong. See this post (The Fed is not "printing money") from five years ago for more background.

Chart #2 actually has two messages: 1) an inverted yield curve is a good leading indicator of a recession, and 2) very high real short-term interest rates are also a good leading indicator of a recession. When both those conditions hold, that's when you need to worry about a recession. Today we're not even close to having to worry. Despite the Fed having raised its target funds rate six times in the past 18 months (from 0.25% to today's 1.75%), the real funds rate is still in negative territory (-0.18% as of March 31 by my calculations), because inflation over the past year has been almost 2%. The Fed has raised its target for the real funds rate because the market has grown less risk-averse and economic growth expectations have improved somewhat. The Fed hasn't "tightened" in the sense that it is trying to slow things down. The Fed is just following the market.

Chart #3

Chart #3 is important because it gives us information about the slope of the real, inflation-adjusted yield curve. Real yields are just as important, if not more so, than nominal yields. The blue line, the real funds rate, is ground zero for the real yield curve, while the red line, the real yield on 5-yr TIPS, is the market's estimate for what the real Fed funds rate will average over the next 5 years. Today, the front end of the real yield curve is positively sloped (i.e., the spread between the two lines is positive), and it has actually been steepening since last summer. The message: the market agrees with the Fed that short-term interest rates, in real terms, will need to rise in coming years. Not by a whole lot, but by enough to rule out the notion that the market and/or the Fed are nervous about the health of the economy. The time to worry is when the real yield curve becomes negatively-sloped, as happened before each of the past two recessions (i.e., when the blue line exceeds the red line, because that means the Fed has tightened too much).

Another reason the Fed needs to raise real rates is to boost the attractiveness of the $2 trillion of excess bank reserves held by the banking system. Failing to do so would decrease banks' desire to hold excess reserves, and that in turn would lead to excessive lending, too much money, a weaker dollar, and rising inflation.

Chart #4

Chart #5

Chart #4 uses real and nominal 5-yr yields to give us information about the market's inflation expectations. Despite the Fed having kept real short rates negative for 10 years, inflation expectations today are no different from what they have been in the past. As Chart #5 shows, the CPI ex-energy has been on a 2% growth path for the past 15 years, and inflation expectations today, based on 5-yr TIPS and Treasury yields, are about 2.1%. That is effectively proof that the Fed has not been printing money or distorting markets. In monetarist parlance, the Fed has managed to keep the supply of money pretty much in line with the demand for money, though not completely, because inflation has averaged about 1.6% per year for the past 10 years.

Chart #6

Chart #6 shows that real yields on TIPS also provide us with information about the market's GDP growth expectations. The level of real yields tends to track the level of real growth, and that is not surprising at all. A stronger economy implies higher real returns, and real yields should therefore rise in a faster-growing economy. Conversely, as economic growth weakens, as it did following 2000, real yields should fall. Currently, real yields of about 0.5% on 5-yr TIPS tell us that the market expects the economy is likely to grow about 2-2.5% per year, according to my reading of the bond market tea leaves.

If last year's tax reform results in a significant increase in economic growth, as I expect it will, then the Fed is going to have to guide real yields significantly higher as well. And that of course means significantly higher nominal yields, assuming inflation expectations remain "contained."

But for the time being, today's yield curve holds no threatening messages for the economy, and I think the market intuitively understands this.

What's worrisome today is not the yield curve, but the threat of a possible trade war with China and the ongoing tensions in the Middle East. The volatility that we are seeing is the result of the turbulence one would expect when headwinds (trade war risk, Middle East tensions) collide with tailwinds (last year's tax reform). For now, the market's judgment is that the two opposing forces effectively neutralize each other, with the result that growth is expected to be unimpressive, while inflation is expected to remain in the neighborhood of 2%.

Friday, January 18, 2019

Key financial indicators are healthy

Monday's post focused on key economic indicators. Today's post focuses on key financial indicators, which for the most part are market-driven and available in real-time. As such, they should carry more weight in one's assessment of the economy's fundamentals. They aren't subject to estimates or adjustments or revisions, and they are the net result of the fears, hopes, judgment and actions of countless millions of economic agents and investors. Right now, they paint a picture of a market and an economy that are fundamentally healthy, even though investors are still worried about the future.

Chart #1

If I were stranded on a desert island and could only access one chart to tell me what was going on in the world, Chart #1 is the one I would pick. There are many ways of thinking about swap spreads. (For a detailed explanation, see this post of mine from many years ago.) Swap spreads are excellent coincident and often leading indicators of financial market and economic health. When spreads are low, liquidity is generally abundant, risk aversion is low, systemic risk is low, and the economic outlook is generally healthy. 2-yr swap spreads today are unusually low, less than 20 bps. Among other things, this tells me the banking system is healthy and there is no shortage of liquidity. Morever, market participants are willing and able to manage risk in a variety of ways. That's an essential function of markets: to redistribute risk from those who don't want it to those that do. When markets are free to operate and those who worry are free to reduce their risk, panic is short-circuited, and there is no rush for the exits. Low swap spreads act like grease for the wheels of finance, and healthy financial markets are a necessary, if not sufficient, condition for a healthy economy. This is very positive.

Chart #2

After swap spreads, I'd want to know what the Fed was doing. For that, I'd pick Chart #2. Although they rarely mention it, the Fed's primary monetary lever is the real Fed funds rate (the nominal rate minus inflation according to the Core PCE deflator). That's the rate that really matters to the economy, not the nominal rate; 5% interest rates in a zero inflation world are much more onerous than 5% rates in a 4% inflation world. As Chart #2 shows, it turns out that every recession in the past 60 years has been preceded by a significant rise in the real Fed funds rate. What was the Fed doing to make real short-term rates rise? It was draining reserves from the banking system. Faced with a shortage of reserves, banks needed to bid in the Fed funds market for reserves (reserves are required to collateralize deposits), and that had the effect of pushing up overnight lending rates. Rising real rates made borrowing more expensive, and it made holding cash or cash equivalents more attractive: the net result was an increased demand for money. So, prior to every recession the Fed effectively starved the markets and the economy for money (because the demand for money exceeded the supply of money), until economic activity slowed down and a recession set in. Then the Fed began to ease, and the economy began to recover. Lather, rinse, and repeat.

It's going to be different this time, however, because since late 2008 the Fed has changed the way it operates. Bank reserves used to pay no interest, so banks always tried to minimize their holdings of reserves. Today the Fed does pay interest on reserves, so now reserves are a potentially attractive asset class, not a deadweight burden for banks. Reserves today are essentially T-bill substitutes that the Fed created by buying notes and bonds from banks: they pay a floating rate of interest and they are default-free. Not surprisingly, today the banking system is happy holding some $1.6 trillion of excess bank reserves. Banks have all the reserves they could possibly need to cover a potentially huge increase in lending activity, but they are content to hold excess reserves in lieu of making more loans. Bank lending is expanding today at a reasonable rate, and inflation is low.

The main reason the Fed has been trying to reduce its balance sheet is to minimize the risk that a huge amount of excess reserves might encourage banks to lend too much and to thus over-expand the money supply, which in turn could cause a lot of inflation. But so far, raising the interest rate it pays on reserves has been sufficient to induce the banks to view excess reserves as a valuable asset, not as a means to expand lending.

Chart #3

In the 5 years preceding the crash of 2008, Bank Credit grew at a 9.4% rate (see Chart #3). Since the economy began to recover in mid-2009, Bank Credit has expanded at a 4.1% annualized rate; over the past 5 years, Bank Credit has expanded at a 6% rate. Bank Credit growth has picked up a bit in the past few years, but it is clear that banks are not creating new money with abandon, as they seemingly did in the run-up to 2008. The Fed, in other words, has managed to find the interest rate that appears to balance the supply and demand for money. That helps explains why inflation has been low and relatively stable, and the dollar has been reasonably strong and relatively stable.

Chart #4

But the real Fed funds rate is only part of the story. The other part is how the Fed's actions affect interest rates across the maturity curve and across the risk spectrum. Chart #4 adds the shape of the yield curve (red line) to Chart #2. This gives us a more complete look at the impact of Fed policy on the economy. Now we see that every recession in the modern times has been preceded by a significant rise in real short-term rates AND a flat or inverted yield curve. Inverted yield curves are the bond market's way of saying "uncle." It's saying that money is so tight it's affecting the economy, and things are likely to get so ugly that the Fed is going to have to start lowering rates in the foreseeable future. (An inverted yield curve occurs when markets expect short-term rates to fall in the future.)

Chart #4

The yield curve today has become a lot less steep than it was not too long ago, but real short-term interest rates are still relatively low. All that tells us is that the market now expects the Fed to be on hold for the foreseeable future. Consider Chart #4, which shows the Dec. '19 Fed funds futures (i.e., the market's expectation for what Fed funds will trade at come December). Fed expectations a few months ago called for two more tightenings, but the economy's weakness and concerns over trade tensions, etc., have convinced the market (and also the Fed, which recently apologized for threatening to raise rates more) that this won't happen. Today's funds rate target is 2.4%, and the Dec. '19 Fed funds futures rate is trading at just under 2.5%. So the market expects the Fed to essentially be on hold for at least the rest of this year. This is an important variable to watch, since it is tied directly to the market's perception of whether the economy is gaining or losing strength; for example, any tendency towards a stronger economy would cause the market to raise its expectations for where the funds rate will be come December.

Chart #5

Chart #5 sheds further light on market expectations for Fed policy. The real Fed funds rate (blue) is the overnight real interest rate that sets the floor for all other rates (it's also the same rate that appears in Chart #2). The real yield on 5-yr TIPS (red) is a good proxy for what the market expects the real Fed funds rate to average over the next five years. The current real funds rate is about 0.6% (a 2.4% Fed funds target minus a core PCE inflation rate of 1.8%). The market expects the real funds rate to average about 0.9% over the next 5 years—a very modest tightening of policy, but certainly not an easing.

Note the relationship between these two variables. The real yield curve tends to invert prior to recessions (i.e., the blue line exceeds the red line). This happens because the bond market senses that the Fed is so tight that it is undermining the economy, and that in turn will lead to a recession and much easier Fed policy in the future. Currently the real yield curve is still positively sloped. The bond market is not signaling a recession, but neither is it signaling strong growth—real yields are still relatively low.

Chart #6

Chart #6 shows one popular measure of the slope of the nominal yield curve: the difference between 2- and 10-yr Treasury yields. By this measure the curve is pretty flat, but it's not inverted. It's been like this several times before in recent history without a recession immediately following.

Chart #7

Chart #7 is another measure of the slope of the yield curve, with the key difference in this case being that the market's expectation of where the funds rate is going to be in the near term does not play a role (as it does in Chart #6, since the 2-yr Treasury yield is effectively the market's expectation for what the Fed nominal funds rate will average over the next two years). The difference between 10- and 30-yr yields is a function of the market's long-term expectations for economic growth and inflation. A positive slope is the norm, and a negative/inverted spread is a sign of trouble. What we see today is fairly routine for an economy in mid-cycle. Indeed, there are lots of similarities between today and the mid- to late-1990s, when the economy was booming and the Fed was beginning to tighten. 

Now let's look at credit spreads, which are a measure of the market's confidence in corporate profits (the lower the better) and by inference the market's outlook for the health of the economy. (Credit spreads are the difference between the yield on a corporate bond and the yield on a Treasury bond of similar maturity.)

Chart #8

Chart #8 shows 5-yr Credit Default Swap Spreads. The market for CDS is highly liquid, much more so than for individual corporate bonds. Buying CDS contracts is equivalent to buying a basket of bonds, and selling CDS is equivalent to selling a basket of bonds. If you have a portfolio of corporate bonds and become nervous about a general weakening of the economy, you can hold on to the individual corporate bonds you like and sell CDS to cover your risk of a generic rise in credit spreads, for example. Currently, CDS spreads are relatively low, and down from their recent highs. As we'll see in Chart #10, one of the main drivers of wider corporate bond spreads is the recent, sharp decline in crude oil prices, similar—though to a much lesser extent—to what we saw in late 2015.

Chart #9

Chart #9 shows credit spreads for Investment Grade and High Yield corporate bonds, which tell a similar story to that told in Chart #8. Credit spreads are somewhat elevated, reflecting caution, but not signaling great risk. And they have declined meaningfully in the past week or so.

Chart #10

Chart #10 shows that the recent sharp decline in crude oil prices closely tracks the decline in expected inflation. Lower expected inflation is thus not the result of overly-tight Fed policy. 

Chart #11

Chart #11 compares 2-yr swap spreads to the spread on high-yield corporate bonds. Note how swap spreads tend to lead credit spreads. For the past several years swap spreads have been relatively low (a normal trading range would be 15-30 bps). Throughout that period swap spreads have correctly diagnosed the "problem" behind wider credit spreads to be due to nerves, not fundamentals (i.e., fears that lower oil prices would threaten the oil-related sectors).

Chart #12

Chart #12 shows that the level of real yields tends to correspond to the economy's real growth trend. When the economy was booming (4-5% GDP growth) in the late 1990s, real yields were 3-4%. More recently, the economy has been growing at a 2-2.5% pace, and real yields are about 1%. This reflects the market's belief that it is quite unlikely that the economy will pick up significantly from its recent pace. I happen to think the market is being too pessimistic on this score. I think there is a lot of untapped potential in the economy that could be realized if and when tariff wars recede and some today's pressing problems are gradually resolved. 

Chart #13

Chart #13 shows that there tends to be an inverse correlation between the value of the dollar and the level of industrial commodity prices. But not always. Currently, the dollar (blue line) is reasonably strong, and commodity prices are also relatively strong. I interpret this to mean that the global economy (and thus global demand for commodities) is relatively strong. This runs counter to the prevailing narrative which claims that the global economy, in particular the Eurozone and the Chinese economies are very weak. It also runs counter to the prevailing fears that a strong dollar will prove destructive to emerging market economies, since a strong dollar tends to push commodity prices down, and that in turn punishes those economies most dependent on commodity exports.

Chart #14

Chart #14 is another one of my favorites. What we see here is that the primary driver of equity selloffs in recent years has been FUD (fear, uncertainty, and doubt). As most of the charts above show, the economy's fundamentals remain sound. The Fed is not threatening, inflation is not too low nor too high, the economy appears to be gaining strength, the outlook for corporate profits is healthy, and financial markets enjoy plentiful liquidity. So far this theme seems to be holding for the latest selloff: as fears (as proxied by the ratio of the Vix index to the 10-yr Treasury yield) subside, prices are rising. The equity market has already recovered a bit more than half of what it lost since early October. 

Chart #15

Chart #15 compares Warren Buffet's favorite measure of equity valuation (blue line) to the inverse level of 10-yr Treasury yields (red). It suggests that equity prices had reached high levels relative to nominal GDP earlier this year, but that this has been "corrected" by the recent decline in equity prices combined with ongoing growth in the economy. The chart further suggests that the current valuation of the market is consistent with the level of interest rates (compare the current period to the late 1950s and early 1960s). That equity valuations using the Buffet measure tend to inversely track the level of interest rates over time is not surprising, since lower lower rates result in a higher discounted present value of future profits, and vice versa.

Chart #16

Finally, let's look at something interesting from China. Chart #16 compares the value of the Chinese yuan to the level of China's foreign exchange reserves. Here we see that the yuan has taken a beating in the past year or so (undoubtedly as a result of a significant reduction in the pace of China's real growth and a significant increase in uncertainty surrounding the Trump tariff wars). But it's very interesting to see that China's forex reserves have been holding fairly steady for the past two years. This tells me that China's central bank has been successfully stabilizing its holdings of reserves by allowing the yuan to fluctuate within reasonable limits. This further implies that the central bank is keeping the supply of and the demand for yuan in balance, which should keep China's inflation low, help stabilize the economy and in turn restore confidence in the currency. The recent upturn in the value of the yuan likely reflects the market's belief that a resolution to the US-China Trade War could be in the offing. I wouldn't be surprised at all, since Trump's ultimate objective is a reduction in tariffs and subsidies, and that in turn would be good news for both the US and Chinese economies.

Despite all the worries, there are reasonably strong signs in the financial market's entrails that things will work out well in the end.

Wednesday, March 3, 2010

TIPS point to very slow growth


This chart is not meant to be scientific, it is meant to be suggestive of what the TIPS market may be implying about the outlook for real growth in the U.S.

The blue line represents the rolling, 2-yr annualized rate of real GDP growth. I've used a rolling 2-yr figure to smooth out the ups and downs in yearly data, and I think it's reasonable to assume that the market's outlook for the future tends to be influenced by the experience of the recent past. The red line is simply the yield on 5-yr TIPS.

The rationale for comparing these two is that real yields that can be purchased via the TIPS market should not be greatly different from expectations for real growth in the economy. If you invest in the broad stock market, your expectation for real returns should not be greatly different from the real growth of the economy. In other words, it would be difficult to expect positive returns if the economy were to be in a protracted recession, just as it would be reasonable to expect positive returns if the economy were to enjoy healthy growth. If markets are at all efficient, the real yield on TIPS should be somewhat less than the expected real returns on the average company (since TIPS real yields are guaranteed by the U.S. government, but equity real yields are not), and average real returns in the stock market should not be greatly different from the economy's average real growth rate.

From this I conclude that since yields on 5-yr TIPS today are only about 0.2%, the market is implying that expectations for real growth in the economy are only about 1-2% or so. And that is one reason I think the stock market is priced to very conservative, and even fearful assumptions about future growth. If real growth were expected to be 4% or more, real yields would almost certainly be higher than they are today, because the market would expect the Fed to tighten policy significantly if that were the case. The next chart is my rationale for saying that.


This chart compares the yield on 5-yr TIPS with my calculation of the market's expectation of the real Fed funds rate one year from now. The latter is a good proxy for how tight the market expects the Fed to be in the future. The impressive correlation of real yields to Fed tightening expectations is clear from the chart, and it also makes a lot of sense, since the Fed traditionally regards tightening or easing to be a function of how the funds rate changes relative to inflation. In other words, when the Fed wants to tighten, it must raise the funds rate relative to inflation. Thus, if the market expects a tightening in the future, then the market should demand a higher real yield from TIPS today. (The foregoing is just another way of saying that the Fed controls the level of real short-term rates, and it is the expectation of the real rate on Fed funds that drives the shape of the rest of the real yield curve.)

Currently the market is expecting the Fed to tighten monetary policy only slightly over the next year (with the definition of tightening being the level of the funds rate relative to inflation). That expectation, in turn, is driven heavily by the outlook for real growth. Neither the Fed nor the market expects real growth to be very impressive over the next year. If the economy were to strengthen unexpectedly, the Fed would tighten sooner and by more than the market currently expects, would it not? That the market expects the real funds rate to be -0.5% a year from now can only mean that the market's outlook for real growth is rather dismal.

UPDATE/CLARIFICATION: The point of this post is not to say that my expectation of growth is dismal, it's to point out how pessimistic the market's assumptions are. This in turn implies that it is unlikely that the equity market is overpriced. Thus my expectations for 3-4% real growth justify a bullish outlook for equities.

Wednesday, March 15, 2017

Bonds pleased with Fed rate hike

Today the FOMC raised its target Fed funds rate to 1.0% as expected. However, Treasury yields fell 10-20 bps or so in the aftermath of the announcement, suggesting that the bond market had been nervous that the Fed would signal more aggressive rate hikes in the future—which it didn't. Once the dust had settled, we see that 5- and 10-yr Treasury yields are largely unchanged over the past three months, while 2-yr yields are up only 5-10 bps. This further suggests that the Fed and the bond market have been thinking along the same lines for the past several months; the bond market expects the Fed to continue deliver on its promise to raise short-term rates only gradually for the foreseeable future. Whether this expectation holds going forward is the real question at this point, and the answer will depend on the evolution of the economy and inflation. But for now, expectations and reality look to be in rough equilibrium. Not surprisingly, the stock market took heart from the relative calm, as prices firmed.

The charts below are updated versions of charts that I consider key to understanding the evolving stance of monetary policy:


One very important measure of the effective stance of monetary policy is the inflation-adjusted Fed funds target rate. By changing the real level of its funds rate target, the Fed attempts to influence the world's demand for money. Higher real yields are intended to increase the demand for money (while also making borrowing less attractive), whereas lower real rates do the opposite. Given the relative tranquility in the bond market and the economy in recent months, we can infer that the Fed's efforts to date have not made any significant change in the balance between the Fed's supply of money and the market's demand for it. In other words, the Fed's "tightening" actions to date have been largely offset by the market's decreased demand for money, a phenomenon which goes hand in hand with increased confidence and a modestly improved economic outlook. As the chart above shows, the real Fed funds rate (using the core PCE deflator—the Fed's preferred inflation gauge—to discount the nominal Fed funds target) has increased from -2% a few years ago to just above -1% today. That's not really a "tightening," and is better thought of as the Fed becoming "less easy."


The chart above compares the real funds rate (red) with the market's expectation of where the real funds rate will be in 5 years (blue). As long as the future expected rate is higher than the current rate, the bond market is expecting the Fed to continue to raise its target real rate. But when the red line exceeds the blue line—as it did prior to the last two recessions, this is an excellent sign that the market expects that the Fed will sooner or later be forced to lower its target rate because the economy is expected to weaken. An inverted real yield curve (when short-term real rates exceed longer-term real rates) is thus an excellent indicator of a coming recession, and the market's way of telling the Fed that monetary policy is too tight. Today the market is signaling "steady as she goes," which translates into continued moderate and measured increases in short-term rates—much as the Fed is promising.


The chart above gives us another way of measuring the effective stance of monetary policy, by comparing the level of real short rates to the slope of the Treasury curve. When real rates are very high and the yield curve is inverted (i.e., when short-term rates exceed long-term rates) monetary policy is very tight and the economy inevitably succumbs to recession (think of the economy being starved of liquidity and subsequently collapsing). We are likely years away from such a confluence, since real short-term rates are still very low and the yield curve is positively sloped.


The level of expected real short-term rates (blue line) also tells us about the market's willingness to pay up for "safety." As the chart above shows, gold prices and TIPS prices (using the inverse of their real yield as a proxy for their price) have been moving together for many years, and both have been slowly declining since 2012 (when fears of a Eurozone collapse triggering another global recession were intense). This suggests the market has slowly been regaining confidence and losing its risk aversion as the memory of the 2008 crisis fades, the economy proves resilient, and an era of improved fiscal policy approaches. So far, nothing dramatic has happened, and I would argue that both TIPS and gold prices still embody a good deal of caution with regards to the future.


As the chart above shows, the underlying trend of the consumer price index (ex-energy) has been about 2% per year for the past 14 years.


Over the past six months, the core CPI is up at a 2.2% annualized rate, which further suggests that the core PCE deflator is currently rising at just under 2%, which is close enough to the Fed's target to effectively rule out any risk of deflation or fear that the Fed has been raising rates too much or too fast.


The level of expected real short rates (blue) also tells us a lot about the market's expectations for economic growth. Here we see that the recent rise in real short rates is very modest, and that means that growth expectations have only firmed modestly in the past year or so. Conditions today are a far cry from where they were in 2000, when the market fully expected economic growth to average 4% a year or more for the foreseeable future.

Right now it looks like the market is priced to 2-2 ½% growth for the foreseeable future. That further suggests that if Trump manages to deliver decent supply-side policy changes (e.g., significantly reduced regulatory burdens and lower marginal tax rates), and if those policies result in growth of 3-4%, then we ought to expect interest rates to move substantially higher. So far the market is taking a wait-and-see, albeit modestly-optimistic attitude.

Tuesday, June 12, 2018

The Fed hasn't yet begun to tighten

Tomorrow we'll likely learn that the Fed is raising its target funds rate (and the rate it pays on excess reserves) by another 25 bps, to 2.0%. It won't be surprising, and it shouldn't pose any threat to financial markets. That's because this latest hike is necessary just to keep monetary policy "neutral." In fact, the Fed has been in neutral for the past year. How is that? Because the economy has been gradually picking up steam over the past year, and inflation is up as well. A modest pickup in growth and a modest rise in inflation fully justify a modest rise in rates. Indeed, it would be worrisome if the Fed doesn't raise rates tomorrow.

Chart #1

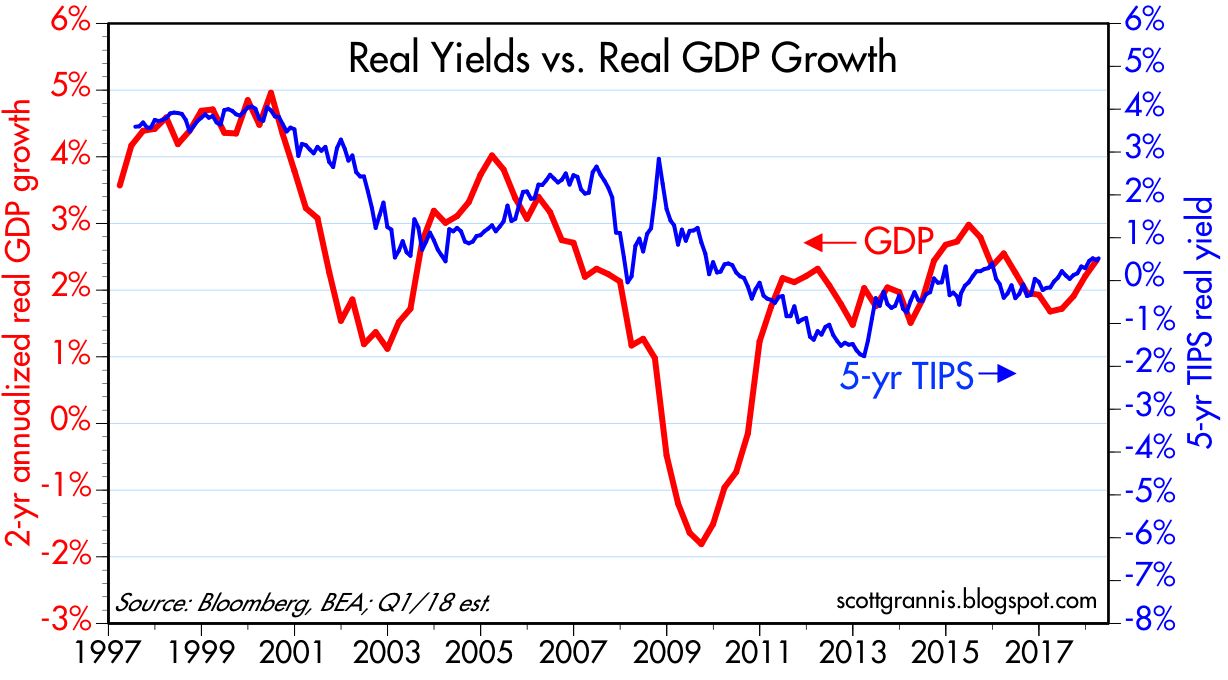
Chart #1 is an update of a chart I've been following for years. It shows that over time there is a correlation between the pace of real economic growth and real interest rates. Very strong growth (4-5%) in the late 1990s was matched by very high real yields (4%). Since then the economy has been downshifting, with growth in the current business cycle averaging a little over 2% and real 5-yr yields meandering around zero. Growth has picked up of late, however, and so have real yields. Current estimates for Q2 growth are roughly 4%, and if that proves to be the case, then real growth over the past year will have been about 3%. (The chart shows the 2-yr annualized growth rate, to better track the recent "trend" which I project will reach 2.6%.)

If growth continues to accelerate, as I expect it will (but the market is not yet convinced of this), then real yields could rise to the 2-3% range in a few years. That would of course imply a lot more Fed rate hikes than the market is currently expecting.

Chart #2

Chart #2 compares the real yield on 5-yr TIPS to the real, inflation-adjusted Fed funds target rate—which is the only rate that really matters to the markets and the economy. I've projected the real funds rate to rise to about 0.1% by the end of this month. Note that the real funds rate has been relatively stable for the past year; 3 rate hikes have been necessary simply to offset the rise in inflation.

Chart #3

Chart #3 compares the real yield on 5-yr TIPS with the "Natural Real Rate" as calculated by the Laubach-Williams method. This is "the rate interest rate consistent with output equaling potential and stable inflation." In short, it's one way of estimating what the real Fed funds rate should be if the economy is operating at or near its potential and inflation is stable. Note that 5-yr real yields (which can be thought of as the market's forecast for what the real fed funds rate will average over the next 5 years) are effectively projecting that the Fed will "tighten" monetary policy only moderately over the next several years, in a manner consistent with inflation remaining stable and the economy picking up a little speed. The Natural Rate should rise as the economy picks up speed.

Chart #4

Chart #4 compares the real funds rate with the Natural Real Rate. It's likely that the Fed keeps an eye on the natural rate, and manages the real funds rate accordingly. If they need to "tighten" policy they push the real funds rate above the natural rate, and if they need to "ease" (as they did for most of the current business cycle), then they push the real rate below the natural rate. The two lines converged in June of last year, which can be interpreted to mean the Fed decided in early 2017 that the economy no longer needed policy "stimulus," and therefore monetary policy should shift to neutral. (I'm not endorsing this way of thinking, merely commenting on how it might work.)

Chart #5

It's worth repeating Chart #5, to make the point that it takes very tight money policy to precipitate a recession. Tight monetary policy shows up in the form of very high real short-term rates and a flat or inverted yield curve. We're a long way from seeing those two conditions repeat. The current shape of the yield curve is still upward-sloping, which means only that the market expects the Fed to continue to raise short-term rates for the foreseeable future. That's not remarkable or in the least scary. Besides, real interest rates are still unusually low.

Chart #6

Chart #6 compares the nominal and real yields on 5-yr Treasuries, with the bottom line being the difference between the two, which is the market's implied forecast for what the CPI will average over the next 5 years. Happily, inflation expectations are only slightly above 2%, which is fully consistent with the Fed's objectives and fully consistent with stable inflation. If the Fed is going to hike rates significantly, we'd first have to see stronger growth and/or rising inflation expectations.

Chart #7

The CPI ex-energy, shown in Chart #7 has actually been very stable around 2% for the past 15 years. I justify taking out energy prices because they are by far the most volatile of all commodity prices, and it makes no sense for the Fed to try to control energy prices. And in the long run, there is not much difference between the full CPI and the ex-energy CPI.

Chart #8

Chart #8 shows the history of the CPI and the ex-energy CPI, using a 6-mo. annualized calculation to focus on recent trends. Note the huge amount of volatility imparted to the full CPI just by adding energy prices, even though energy represents less than 4% of personal consumption expenditures. Over the past 20 years, the full CPI has averaged 2.2% per year, while the ex-energy CPI has averaged 2.0%. 

Chart #9

One of the least-remarked developments on the inflation front is arguably the disappearance of deflation from computer prices. Chart #9 shows how prices for computers and peripherals were falling 30% per year about 20 years ago. So far this year, prices have been stable, for the first time ever.

Chart #10

One reason to expect stronger economic growth is shown in Chart #10. Small business optimism has never been higher than it is today. Entrepreneurs are excited about lower tax rates and a substantial reduction in regulatory burdens. This should translate into more investment, more jobs, and higher productivity (which has been sorely lacking during the current business cycle).

Chart #11

Chart #11, another perennial favorite, shows how every major increase in the market's level of concern and uncertainty has coincided with a sharp selloff in equity prices. Once fears subside, prices float back up. The same cycle has repeated a number of times in recent years, and we're at the tail end of the most recent.

Chart #12

Chart #12 compares the Core measure of consumer price inflation (ex-food & energy) with 5-yr Treasury yields. Normally the two should move together. That relationship broke down in 2011, however, when the market started worrying about the collapse of the Eurozone, the fiscal cliff, China, oil prices, Brexit, and the US election, successively. Risk aversion throughout most of the current business cycle drove strong demand for Treasury yields, keeping them unusually low relative to prevailing inflation. Now we're getting back to normal. Higher interest rates are not scary, they're to be expected.

I don't think the Fed is going to be a source of concern for the market for the near future. But if the economy heats up, the Fed governors are going to be wringing their hands and losing sleep at night. And if inflation expectations rise, well, then we'll all start to worry. But for now the main thing to watch is the economy, which should continue to show signs of faster growth. (See my last month's post "Waiting for GDP") If I'm right and GDP growth accelerates convincingly above 3-3.5%, then the Fed is going to have to raise short-term rates, and bond yields are going to have to rise as well, and both by much more than the market is currently expecting. Will higher interest rates kill the economy? No, because they will be the natural result of a stronger economy. Interest rates will only become a concern when the Fed thinks it needs to step on the brakes and raise real rates significantly.