First quarter GDP growth was miserable, barely distinguishable from zero. Weather played a role, but some of the more important contributors (the West coast port strikes, and a huge decline in oil drilling activity) are no longer with us. Winter is history, ports are open, drilling activity is unlikely to fall much more than it already has, weekly claims for unemployment are at multi-year lows, and oil prices are up over 30% since their mid-March lows. Moreover, financial markets show no signs of stress, and corporate profits are at record levels relative to GDP and growing. Commodity prices have bounced as the dollar has softened, interest rates are up, bank lending is growing at a healthy rate, and confidence is up. The economy is not suffering from any shortage of liquidity; in fact, money is in abundant supply, plenty enough to fuel stronger growth (and possibly higher inflation) going forward. It is far more likely that we will see stronger growth for the balance of the year rather than weaker growth.
What follows is a chart dump, in no particular order, along with brief comments regarding how each supports the above observations.
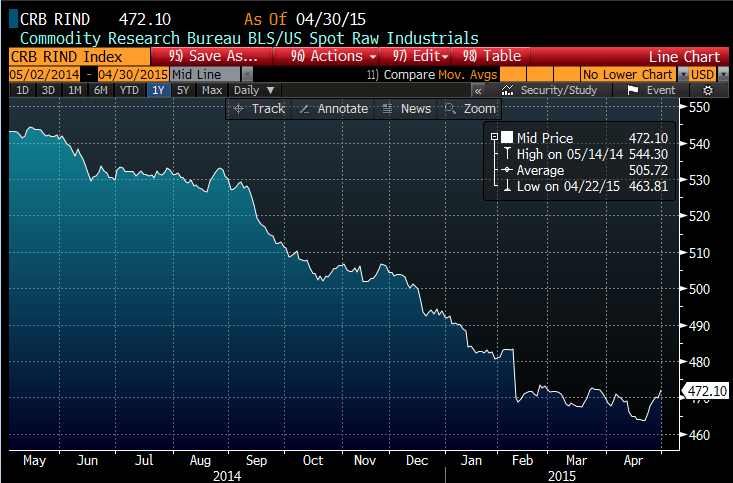
Commodity prices started falling about a year ago, but have been flat since mid-February and are up nicely on the margin. They are still twice as high today as they were in 2001. This does not reflect any serious economic weakness; rather, the recent stabilization of prices suggests the economy is doing better on the margin.
As the chart above shows, commodities tend to move inversely with the dollar. The dollar rose sharply beginning last June, but it has fallen almost 5% since its early-March high. A more-stable dollar suggests more-stable commodity prices, and both suggest better growth ahead.
Crude oil prices also tend to move inversely with the dollar, as the above chart shows. Oil prices bounced from the low 40s to the high 50s as the dollar slumped. The bounce in oil prices also suggests that oil supply and demand are coming back into alignment. That oil is still significantly cheaper than it was a year ago is good news for growth going forward, since oil is an important input to most economic activity.
The chart above shows the U.S. active rig count. It rose sharply beginning in late 2009 as new drilling technologies began to be exploited, and has since collapsed in a delayed response to sharply lower oil prices. The pace of decline is moderating of late, and, combined with the bounce in oil prices, this lends credence to the notion that oil supply and demand are coming back into balance—less supply, more demand.

With the U.S. rig count down by more than half in the past six months, it wouldn't have been surprising to see a meaningful rise in weekly unemployment claims as energy producers and suppliers to the drilling industry laid off workers. But as the chart above shows, claims have instead hit a new, multi-year low. Dramatic weakness in the oil patch is not proving to be very contagious, nor has it been a threat to overall growth. Lower oil prices are bad for energy producers, but good for energy consumers. The oil industry most likely does not face a meltdown, while the rest of the economy gets a break from cheaper energy.
Interest rates fell as the economy slumped, but now they are rising. Real yields on 5-yr TIPS (see chart above), which tend to track the market's optimism regarding future economic growth, are up 30 bps in just the past few weeks, and 10-yr Treasury yields are up 50 bps since their late-January low. Rising interest rates are strongly indicative of a strengthening economy.
The rise in yields also reflects increased inflation expectations: the 5-yr, 5-yr forward inflation rate has jumped from 1.8% earlier this year to over 2.2%, as the chart above shows. This suggests that the bond market senses a pickup in economic activity. I note that this year's pattern is very similar to what we saw in the first 3-4 months of last year, when first quarter growth proved to be negative but the second quarter rebounded strongly.

The dollar was exceedingly strong from last summer until last March, but now it appears to be consolidating. A strong dollar was a headwind for corporate profits coming from overseas, but now the negative pressure has lessened. The dollar had been very weak leading up to last summer, and in my book that was indicative of a host of problems that plagued the U.S. economy. Some of these problems have faded: I note that the federal budget deficit is now only 3% of GDP, when not too many years ago it was threatening to exceed 10%. A more normally-priced dollar is good news.

The burden of government spending (reminder: the public sector almost always spends money less efficiently than the private sector, so a growing public sector is bad news for productivity, economic growth, and prosperity) has declined significantly in recent years, as the chart above shows. When the public sector shrinks, the private sector—the only meaningful source of jobs and productivity—has more room to expand. This is very good news.
Confidence has improved significantly since oil prices started falling. With rising confidence and cheaper energy, we should expect to see more investment and more growth.
In another sign of rising confidence, the price of gold has been trending lower for the past four years. The chart above compares the price of gold to the inverse of the real yield on 5-yr TIPS (that being a proxy for their price). The world's demand for the safety of gold and TIPS has been slowly declining, which is the flip side of rising confidence. Confidence has been in short supply for most of the current recovery, so this is good news.
The Vix index (see chart above) is a classic measure of the market's fears, uncertainty and doubt. It's fallen to relatively low levels, a sign of improving economic and financial market fundamentals. Healthy financial markets are critically important for the future of the economy.
2-yr swap spreads, shown in the chart above, are trading at very normal levels, which is a good sign that both the U.S. and Eurozone economies are free of any significant degree of systemic risk. Normal swap spreads are symptomatic of abundant liquidity and healthy underlying fundamentals.

The chart above compares the S&P 500 index to the ratio of the Vix index to 10-yr Treasury yields. The Vix/10-yr ratio is still somewhat elevated, thanks mainly to very low Treasury yields which reflect the market's prevailing view that economic growth is likely to be disappointingly low for the foreseeable future. But stock prices continue to rise, as corporate profits rise and the yields on almost everything other than cash remain quite attractive. Risk assets still embody a healthy degree of skepticism about the future, but as long as the economy avoids a recession, the yields on non-cash investment is likely to continue to decline (i.e., prices are likely to continue to increase). Confidence is increasing on the margin, but risk aversion is still the norm, and this is fertile ground for further equity and property price gains.


Corporate profits are at record levels, both nominally and relative to GDP, and have been for several years running. Earnings per share of the S&P 500 were up 6.4% in the year ended April. Despite this superb news, PE ratios are in the 18s, only moderately higher than their 55-year average of 16.6. The market is still somewhat cautious, unwilling to accept that profits will continue to rise, and this is healthy.
Bank lending is growing nicely. After very weak growth in the years following the 2008 financial crisis, bank lending is now rising at a 8-9% pace. That reflects rising confidence: banks more willing to lend, businesses and consumers more willing to borrow. Good news.
For the past 20 years, the M2 measure of the money supply has been growing at just over 6% per year on average. The Fed's QE programs have not upset the monetary applecart, because inflation remains low and liquidity is abundant, so there is very little if any risk that the Fed will tighten policy in a manner which might jeopardize growth for the foreseeable future.

M2 growth has been above 6% per year for the past six years, but nominal GDP growth has been only 3.5% per year. That means that the demand for money has surged, as seen in the above chart which plots the ratio of M2 to nominal GDP. Today, the world wants to hold larger money balances relative to income than at any time in the past. Bank savings deposits, for example, have almost doubled since the end of 2008, from $4 trillion to just under $8 trillion, in spite of the fact that they yield almost nothing. The demand for money has been exceptionally strong since 2008, and that fully justifies the Fed's extraordinary efforts to supply more money via its QE programs.

As the chart above shows, there is a very impressive and long-lasting relationship between M2 and nominal GDP. Over time, they both grow by about the same amount, and nominal GDP has tended to be about 1.75 times M2. Based on that historical relationship, the current level of M2 could support a 17% expansion in nominal GDP (almost $3 trillion). If the world were to fully regain its confidence in the future, money demand would likely decline from its current lofty levels, "freeing up" trillions of cash that is currently being hoarded. As the world attempted to reduce its holdings of cash, some prices would likely rise, some new investments would likely be funded, and total output and employment would probably increase, though it's far from clear how a 17% nominal GDP expansion would be split between inflation and real growth. In any event, it's this growth-potential-in-waiting that is a strong reason to remain bullish and ignore the past quarter's slump.


 Posts
Posts