Showing posts sorted by date for query ppp. Sort by relevance Show all posts

Monday, July 14, 2025

Charts of interest


Some charts I find of interest to the general public, and which you're unlikely to find elsewhere:

Chart #1

Chart #1 sheds light on an important input to the dollar's value: real yields. The red line shows the level of real yields on 5-yr TIPS. These are true real yields, since TIPS are bonds whose principal is adjusted by the CPI, and whose coupon is a "real" yield. (Their return to the investor is equal to the rate of consumer price inflation plus a real yield.) Real yields on TIPS are determined by market forces, and are in turn influenced by the market's expectation of future Fed policy. TIPS are not only safe from default, but also safe from the ravages of inflation. 

The blue line is an index of the dollar's value vis a vis other major currencies. That the two tend to move together suggests that higher real yields enhance the value of the dollar, while lower real yields detract from the dollar's value. The situation today suggests that the dollar is trading on the weak side of where it would normally be given the current level of real yields. This further suggests that investors aren't entirely comfortable with the outlook for the U.S. economy (e.g., tariffs, deportations).

Chart #2

Chart #2 shows my model of the Purchasing Power Parity of the dollar vs. the euro. Currently, the model suggests that the dollar is just about equal to its PPP value against the euro. That further suggests that an American traveling in Europe is likely to find that the dollar price of goods and services there is roughly equal to prices in the U.S.

Chart #3

Chart #4

Chart #3 shows the level of credit spreads on Investment Grade and High-Yield corporate bonds—higher spreads reflecting greater credit risk, and lower spreads reflecting lower credit risk. Spreads today are just about as low as they have been for the past several decades. Chart #4 shows the difference between the two, which is a simple way of judging how nervous the bond market is. Taken together, these spreads are excellent barometers of the health of corporate profits, and by extension, the health of the economy. Conditions are looking pretty good according to corporate bond investors.

Charts #5 and #6

Chart #5 shows the ratio of federal transfer payments (social security, medicaid, unemployment insurance, subsidies, food stamps, etc.) to disposable income. Transfer payments represent money the government gives people money for reasons other than to compensate for their labor. Chart #6 shows the Labor Force Participation Rate, which is the ratio of people working or looking for work divided by the number of people of working age.

The dotted vertical lines mark periods of time when transfer payments ratcheted up rather sharply. That the participation rate ratcheted down each time suggests that people are less willing to work when they receive more money for not working. Funny how that works!

Note the more-than-doubling of transfer payments as a percent of disposable income from 1970 to today. Today, one of every five dollars spent by consumers comes from the government. Viewed from another angle, taxpayers are funding 20% of consumer spending. 

Chart #7

Chart #7 shows the breath-taking growth of federal government spending and tax receipts. Revenues today are more than 5 times what they were 35 years ago, and have increased at a 4.8% annualized rate. Spending today is more than 6 times what it was 35 years ago, and has increased at a 5.3% annualized rate. Our problem is runaway spending, not a lack of taxes.
  
Chart #8

Chart #8 shows the major components of federal revenues. Individual, corporate, and payroll taxes have all increased relentlessly with the passage of time. What stands out here is estate and gift taxes, which today represent a paltry 0.6% of total revenues (~$30 billion per year), and which have not increased at all over the past 25 years. The net worth of the private sector has quadrupled over the past quarter century, but estate and gift taxes haven't budged. This tax could be abolished and the impact on federal finances would be less than a rounding error. Yet this tax gives rise to an army of tax lawyers and accountants, while at the same time diverting trillions of dollars to sheltered investments. It undoubtedly costs the economy far more than the value the government collects. We would all be better off without it.

Wednesday, July 6, 2022

Market to Fed: no need to panic


There has been a significant improvement in the inflation fundamentals in recent weeks. Even though I expect reported inflation to remain uncomfortably high through at least the end of this year, it's becoming clear, on the margin, that the inflation dynamics are improving for the better.

It all began earlier this year when the M2 numbers began to show a significant slowdown, a development I have highlighted at length in previous posts. It's now pretty clear that the surge in M2 was a one-off phenomenon, fueled primarily by a monetization of multi-trillion-dollar-deficits which began in 2020 and continued through at least the third quarter of last year. Since then the federal deficit has plunged and M2 growth has gone flat. The thing that was driving inflation on the margin was money printing designed to enhance the "stimulus" of government handouts, and that has ground to a halt. That's great news, but the lags between money and inflation are "long and variable," according to Milton Friedman. 

There's still a lot of inflation in the pipeline which will be showing up in coming months and quarters, even though the source of rising inflation has been all but extinguished. Soaring housing prices in recent years are now boosting rents, and will do so for at least the rest of this year; rents comprise about 30% of the CPI. Wages and salaries are rising, but they are likely to keep ratcheting up until the economy eventually adjusts to a new, lower-inflation equilibrium, and wages invariably lag rising prices. Energy prices have turned down in a big way in the past month, but lots of other prices are still moving up to offset increased energy costs that were created months ago. Commodity prices are plunging of late, but it will take months before commodity-derived products begin to reflect those lower input costs. And don't forget monthly social security payments, which are due to increase by a significant amount early next year based on the recorded inflation this year, which could well be more than the 5.9% adjustment that was made to 2022 payments. Think of this as "inflation momentum" which will take time to dissipate.

The market is now beginning to look across the valley of still-high inflation this year to the other side, when inflation news will start improving. Markets are good at reading the inflation tea leaves; if only politicians were so smart.

So here are the inflation tea leaves that most impress me, and which can only be the result of a sharp moderation in the growth of M2 money. Taken together, these developments are the polar opposite of what you would expect to see if the Fed were making a too-loose mistake.

Chart #1

Chart #1 compares the level of the dollar (inverted) to an inflation-adjusted index of non-energy commodity prices. A strong dollar has almost always coincided with weak commodity prices, but we saw just the opposite in the past two years. Now, rather suddenly, commodity prices are diving, responding in more typical fashion to the fact that the dollar is quite strong these days. Copper prices are down 30% from their high earlier this month, reversing about half what it gained over the past two years. "Dr. Copper" is famous for reflecting changes in underlying economic and financial fundamentals.

Chart #2

I first created Chart #2 about 40 years ago, and I have been updating it ever since. It's done a pretty good job, over the years, of comparing actual currency values to their "fair value" which is otherwise called purchasing power parity. If my estimates are correct, a dollar spent in Europe at the exchange rate of $1.02 per euro buys roughly 15% more stuff than it does in the U.S. We leave soon for 2 weeks in Italy, and I'll have a chance to test whether my calculations of PPP are correct. 

The larger story is that a strong dollar means the world's demand for dollars is very strong, and that is helping to soak up all the extra M2 that was printed in prior years.

Chart #3

I commented frequently in the past year or so that gold was not moving higher on news that inflation was exceeding expectations because gold rose in anticipation of higher inflation today years ago. The recent weakness in gold is thus best interpreted as the gold market anticipating lower inflation in the years to come.

As the chart suggests, gold has been slow to respond to expectations for higher real interest rates (aka Fed tightening via higher real interest rates), but there is reason to think that gold has begun to catch on; Fed tightening today will result in lower inflation tomorrow.  

Chart #4

Thanks to the introduction of TIPS (Treasury Inflation Protected Securities) in 1997, we have a direct reading of the bond market's inflation expectations are for coming years. It's called the Breakeven Inflation rate, or the rate which will make you indifferent to holding nominal T-bonds or TIPS (and calculated simply by subtracting real rates from nominal rates). The bond market now expects the CPI to average 2.5% a year over the next 5 years, and that's down sharply from an all-time high of 3.6% registered in mid-June. Wow.

Consistent with the improvement in the outlook for inflation contained in these charts, the bond market has adjusted downwards, by a whopping 100 bps, its expectation of the Fed's target rate at the end of 2023 (was 4%, now 3%). 

All good news, of course, especially since it means the risk of recession (typically brought on by a punishingly tight Fed) is likely lower than the broader market thinks. And it's a clear message to the Fed that they needn't (and definitely shouldn't) panic and raise rates too much or too fast.

Friday, February 15, 2019

US vs Eurozone comparisons

Here are four charts that look at key aspects of the US and Eurozone economies: swap spreads, industrial production, equity prices, and exchange rates. By now everyone knows that the Eurozone has its problems, especially with the UK's bumbling attempt to exit the Eurozone trade agreement, France's violent protests, Germany's struggle to assimilate millions of muslim immigrants, and Italy's refusal to address its fiscal deficit. But if you think things are bad in the US, you've been reading too much fake news. 

Chart #1

Chart #1 compares 2-yr swap spreads—my all-time favorite financial indicator—in the US and Eurozone. Here we see that swap spreads have been extremely well-behaved in the US, trading within a normal range of 10-30 bps for most of the past 5 years. This is a clear sign that the financial fundamentals of the US economy are sound: systemic risk is low and liquidity is abundant. The Fed has not made any move that would disturb this. The Eurozone, in contrast, has been struggling with above-average systemic risk and liquidity shortages for the better part of the past 3 years, even as many Eurozone bond yields trade in negative territory; low interest rates are not necessarily stimulative. Eurozone yields are low because growth and opportunity are in very scarce supply.

Note in particular how Eurozone swap spreads began to surge in the first half of 2011, some 3-6 months before a recession hit, and how they began to decline well in advance of the end of the Eurozone recession. This is yet more proof that swap spreads can be excellent leading indicators of economic and financial market health. I have more background on swap spreads here, and numerous charts on swap spreads over the years here.

Chart #2

Chart #2 compares industrial production in the Eurozone and the US. Here we see how Eurozone industrial production declined throughout its 2011-2013 recession, whereas US industrial production kept rising and has now moved well ahead of the Eurozone. The recent decline in Eurozone industrial production hints strongly at a recession, but the Eurozone's relatively stable and only moderately elevated level of swap spreads argues against a Eurozone recession.

Chart #3

Chart #3 compares equity market performance in the US and Eurozone. Note how both markets suffered a setback in the run-up to the Eurozone's 2011-2013 recession, then proceeded to rally throughout the course of the recession. Equity markets can indeed be leading indicators of economic troubles, but not always. In any event, the industrial side of the US economy has zoomed far ahead of its Eurozone counterpart over the past decade. The US is, by this measure, the most dynamic of the advanced economies on the planet.

Chart #4

Chart #4 compares the value of the Euro/dollar exchange rate to my calculation of the Purchasing Power Parity of the Euro. (The PPP value of one currency versus another is driven by changes in relative inflation, and in theory it is the rate which would make prices in both economies roughly equal. In this case, since Eurozone inflation has been lower than US inflation since 1995, the PPP value of the Euro has been slowly rising since 1995.) Over the past decade, as Eurozone industrial production has lagged US industrial production (and by inference the US economy has outperformed), the nominal value of the Euro has been falling, from a high of 1.60 to now 1.13. This supports my view that the current strength of the dollar is largely driven not by tight money or higher interest rates, but by the fact that the US economy is simply a much more attractive place for capital.

Thursday, October 19, 2017

A Goldilocks dollar?

I've had a number of posts over the years that have looked at the value of the dollar vis a vis other currencies. One common thread in these posts has been a reference to each currency's Purchasing Power Parity (PPP), which in theory is the exchange rate which would make prices roughly comparable between two countries. Since the mid-1980s I've used the same methodology for estimating this value, and I've been continually impressed with how it's held up over time. Since I started this blog in late 2008, the dollar has been all over the map: plunging to its weakest level ever in 2011, then soaring over the subsequent five years to its late-2016 high. My PPP analysis says that today the dollar is pretty close to what could be called "fair value" against most of the major currencies, with the notable exception being the Australian dollar, which I estimate to be trading about 25% above my estimate of its PPP value vis a vis the dollar.

To calculate a currency's PPP value against the dollar, I first look for a period—a base year—when prices in that country were roughly comparable to prices in the US. I then adjust the value of the currency in the base year for the difference in inflation between that country and inflation in the US over time. If a country has lower inflation than the US, its PPP value will rise over time, and if a country has more inflation than the US, its PPP value will decline. I should add that I've had occasion to visit each country over the years, and have been able to validate my PPP estimate by subjectively comparing how prices for food, clothing, hotels, etc. compare to US prices (there's an element of judgment at work here, but I think most observers would agree that my estimate of PPP is not too far off—comments pro and con are welcome). As you can see in the charts below, a currency rarely trades at or near its PPP. Instead, most currencies tend to cycle up and down relative to their PPP value, becoming alternately strong and then weak. One important caveat: although divergences between a country's PPP rate and its actual exchange rate tend to close and even reverse over time, PPP should not be used to bet on a currency's future strength or weakness, since it can take years for conditions to change. This is not a trading tool, it's a way to judge how strong or weak a currency is at any one time.


I begin with the Fed's calculation of the dollar's inflation-adjusted value vis a vis a trade-weighted basket of currencies. This is arguably the single best measure of the dollar's overall strength or weakness. The blue line measures the dollar against a basket of more than 100 currencies, while the purple line compares it to a basket of about a dozen currencies. Against a broad basket of currencies the dollar is today is roughly equal to its average since 1973. Relative to the largest currencies, the dollar is about 5-10% above its long-term average. Call it a Goldilocks dollar: neither too strong nor too weak.


The chart above shows how the Euro has tracked its PPP over time. The Euro began in 1997, but I extended its value back in time using the DM as a proxy. Note that the Euro's PPP has trended upwards against the dollar over many decades, a reflection of the fact that Europe has had less inflation than the US. Today the Euro is trading at almost exactly my estimate for its PPP. US visitors to Europe should find that prices there are pretty similar to prices here. Similarly, European visitors to the US should not be surprised to find things cost about the same here as in Europe.


As the first chart above shows, Japan has had a lot less inflation than the US since the late 1970s, and the yen has been very strong throughout most of that period. Some would say the Bank of Japan has been too tight, keeping inflation too low and the yen to strong, and that in turn has curtailed economic growth by making Japanese exports expensive, among other things. In any event, the yen is no longer too strong. As the second chart shows, the yen may now be at a level that is allowing the economy to pick up. Note that the stock market has surged in the past year or so, even as the yen has strengthened a bit.


As the chart above shows, the UK has experienced a lot more inflation than the US in the past several decades; as a result the Pound has been in a long-term, declining trend vis a vis the dollar. Currently the Pound is trading very close to my estimate of PPP. Traveling to the UK in the mid-2000s, as I did frequently, was a painful experience since prices were very expensive. Today it's a much nicer experience.


As the first chart above shows, Canada's inflation has been very similar to US inflation for the past 30 years. However, the Canadian dollar has been all over the map—very weak in the early 2000s, and extremely strong in the late 2000s. The strength or weakness of the Canadian dollar has tended to be the mirror opposite of the dollar's strength or weakness, and both have been highly correlated—until recently—with commodity prices, as the second chart above shows. (Canada positively correlated, the US dollar negatively correlated)


Finally, we come to the Australian dollar, which by my calculations is trading about 25% above its PPP value vis a vis the dollar. Australia continues to benefit from strong commodity prices and from strong demand from China. But the loonie is no longer egregiously strong, as it was some 5 years ago.

At current levels, exchange rates paint a picture of a global economy that is rough equilibrium. No country, with the possible exception of Australia and a few others—is judged by the market to be inherently more attractive than others, on a risk-adjusted basis, and thus worthy of a relatively strong currency. Currency risk has ebbed, as a result, and this may contribute to a continuation of global growth (less risk tends to favor investment, which in turn is the engine of growth). Altogether, not a bad state of affairs.

Wednesday, October 12, 2016

Chart updates

The outlook hasn't changed much this month, and I've been doing some traveling (this week I'm in Park City to attend a Cato conference), so that explains the lack of posts. What follows are some updated charts and commentary:


The September payroll report was consistent with what I've been saying in recent months: jobs growth has downshifted, from a 2% annual pace to now 1.7% or so. That's not a huge deal, but I think it reflects the uncertainty surrounding the elections and the eventual policy outcome. Those with investment decisions to make on the margin are most likely to hold off until next year before deciding to move ahead with new investment/expansion/hiring plans. We therefore are unlikely to see any meaningful improvement in the economy this year.


Jobs growth is slowing, but the growth of the labor force is picking up. More and more people are deciding they would prefer to work than to sit on the sidelines. The gap between the two lines in the above chart suggests that there are as many as 10 million people potentially available to re-enter the workforce.


There is a similar gap between the current size of the economy and its potential size, as the chart above shows. That gap is now equivalent to about $3 trillion in "lost" income per year. In other words, there is tremendous untapped potential in the U.S. economy. That potential could be tapped if policies become more growth-friendly (e.g., lower tax rates, reduced regulatory burdens). That's what this election should be about, but the degree of acrimony that exists between the two parties and their candidates is an unfortunate distraction. I wish I knew how it will all play out.


The unemployment rate has stopped declining and looks set to increase a bit in coming months. Traditionally, a rising unemployment rate only happens as the economy slides into a recession. Things are very different this time around, however. The unemployment rate is moving higher not because more and more people are getting laid off, but because more and more people are deciding they'd rather work than sit on the sidelines. This is arguably the first time this has happened in modern times. Don't be worried, therefore, by a rising unemployment rate—it doesn't mean what it used to mean.


In the currency market, the big news is the abrupt decline of the pound. According to my PPP analysis, the pound is now "cheap" relative to the dollar, for the first time in more than a decade. Time to make plans to visit the U.K.! The most likely cause of the pound's weakness is the U.K.'s decision to exit the European Union. There are lots of things in play, and thus the outcome is fraught with uncertainty. In the long run I think a Brexit is good for the U.K. (since it will free up markets), but in the near term the uncertainty is not surprisingly bad for markets.


The U.S. stock market is more nervous these days, as indicated by the Vix index in recent months rising from a low of 11.3 to now about 16. But the Vix/10-yr ratio hasn't increased much at all, because 10-yr yields have risen from a low of 1.36% to now about 1.8%. Investors are more nervous, but yields are rising because there is less pessimism surrounding the outlook for growth. As a result, the stock market has been relatively stable.


The Fed is on the minds of nearly everyone these days, but I don't see major problems ahead. The chart above tells us that the market only expects a very modest rise in real short-term interest rates in coming years. (That's the message of the blue line in the chart above.) And that makes sense given the sluggish economy and the relatively low and stable rate of inflation. Things could change in the future, of course, but interest rates are likely to surprise on the upside only if the economy strengthens meaningfully and/or inflation rises. 

It's important to keep in mind that there are two ways the Fed can "tighten" monetary policy: 1) they can take steps that result in an increase in the nominal Fed funds rate, and/or 2) they can take steps that result in an increase in the real Fed funds rate. It's the change in the real Fed funds rate that is the most important, since that affects real borrowing costs (and real returns on savings) for everyone. Traditionally, the Fed has increased the nominal funds rate by draining bank reserves, which the Fed accomplishes by selling bonds that it owns. Prior to late 2008, any reduction in the supply of bank reserves would force banks to curtail their lending, since banks had a strong incentive to avoid holding excess reserves. With a shortage of reserves, banks were forced to pay up to borrow needed reserves (needed to collateralize their deposits), and that is what caused short-term interest rates to rise.

Since 2008 that has all changed, for the first time ever. Today there are over $2 trillion in excess reserves in the banking system. As a practical matter, the Fed can't possibly drain enough reserves on the margin to cause a shortage of reserves. Instead, in order to push short-term rates higher all the Fed has to do today is declare that it will pay more interest on the reserves held by the banking system. 

So as the current "tightening" cycle proceeds, the banking system will almost certainly not experience any shortage of reserves or any shortage of essential liquidity. Today, higher short-term rates will mean only that borrowing costs increase marginally and the rewards to savings increases marginally. It's more of a zero-sum game now, whereas "tightening" in prior cycles meant the banking system was being squeezed and money and liquidity were becoming scarce. Of course, we've never experienced a tightening cycle under the current IOER regime, so it's impossible to predict how things will play out. But it is safe to say that this time things will be different. The Fed won't really be tightening in the sense of limiting bank liquidity; rather, it will acting directly to raise the level of short-term interest rates. A quarter-point increase in short-term borrowing costs and a similar increase in the interest rate paid on bank savings deposits and money market funds is not likely to create more than a minor ripple in the U.S. economy. Lots of people (e.g. savers) will likely cheer, while few (borrowers) will grumble. As long as liquidity is plentiful, the banking system and the financial markets will be able to play the role of "financial shock-absorber," and that in turn will mitigate the risk of recession.


In the chart above we see that the prices of 5-yr TIPS and gold have been flat to down in recent months. This suggests that the market's demand for safe-have assets has stabilized or declined, and that further suggests that the general level of uncertainty has improved a bit. Nothing wrong here.

UPDATE: Here is a chart of excess reserves (reserves held by banks that are not needed to collateralize deposits). Excess reserves have declined in line with a decline in total reserves; apparently the Fed is slowly (and quietly) unwinding some of its QE efforts. But there are still plenty of reserves out there.


Friday, September 23, 2016

The view from Argentina

We're in Argentina this week and next, visiting friends and relatives and looking forward to a big wedding this weekend that will be attended by 500+ people. Spring has just arrived, and the people and food are fantastic as always. Food, wine, lodging and taxis are delightfully cheap for American visitors, and now you can easily pay for things with credit cards or withdraw pesos from an ATM (last year both methods were subject to an unfavorable exchange rate), since money is freely exchangeable at a single rate (currently about 15 pesos to the dollar).

There have been many welcome improvements since Macri took over the reins of government from Christina Kirchner late last year. Unfortunately, there are still many head-scratchers: Argentina has uniquely refused to allow Uber to operate within its borders (hint: the taxi cartel is very powerful); it's impossible for Argentines to buy books from Amazon (because customs officials must check each book mailed into the country to make sure there is not too much lead in the ink, and they have no budget to do that, thus "protecting" the domestic publishing industry but intellectually impoverishing everyone in the process); Apple can't sell iPhones in Argentina (because they aren't made in South America, which means that scads of tourists entering the country and Argentines returning to the country carry at least one new iPhone for a friend or for resale); and the great majority of Argentines refuse to acknowledge that the Falkland Islands are British (even though they have been a British Protectorate for over 100 years and unanimously voted to remain one not too long ago). Macri—a successful businessman, an advocate of free markets, and a decent person of the sort I wish Trump were—isn't a miracle worker, but he has accomplished more than most would have hoped for so far and he hasn't given up. He knows that Argentina must regain the trust of the world, the rule of law must be the law of the land, and inflation must be brought under control if capital is to return and businesses are to invest and the economy is to grow.

I've been following the markets throughout the past week, but can't come up with any new or informed observations about what's happening. However, there's nothing wrong with a recap of how I see the economy and the markets, so here goes:

The economy is likely continuing to grow at a disappointingly slow pace, but we might see some modestly stronger GDP numbers in the second half as compared to the first half of the year. There are several reasons for sluggish growth, but monetary policy is not one of them. Tax and regulatory burdens are excessively high; confidence is still lacking; and business investment is weak despite strong corporate profits. Risk aversion, a lack of confidence, and weak investment have sapped the economy's productivity. More recently, the tremendous uncertainty surrounding the November elections—which could give us even higher tax and regulatory burdens and four more years of sluggish growth under a Clinton presidency, or reduced tax and regulatory burdens and four years of stronger growth under a Trump presidency—is most likely convincing risk-takers that it is better to wait until next year before deciding to undertake new investments, and that in turn is contributing to keep growth weak, especially this year.

The Fed has not been "stimulative;" rather, the Fed has been accommodating the world's almost insatiable desire for money and safe assets with its Quantitative Easing program. Short-term interest rates are not artificially low, and thus they are not artificially inflating the prices of risk assets and/or bonds. Interest rates are low because the economy is sluggish, inflation is low, and the market holds out very little hope for improvement in the years ahead. Rates are low because the world's demand for safe assets is very strong. In particular, the very low level of real yields on TIPS, combined with relatively low implied inflation, strongly suggests that the market is very pessimistic about the long-run outlook for economic growth. The Fed is not too tight, because real yields are very low and the yield curve is positively sloped. Deflation exists primarily in the durable goods sector, and China has been one of the driving factors behind ever-cheaper prices for the electronics that have boosted our standard of living—there is nothing wrong with that.

Stocks are no longer cheap, but neither are they obviously expensive. The current PE ratio of the S&P 500 (~20) is above its long-term average, but not excessively high considering how low interest rates are on notes and bonds. Key indicators of systemic risk (particularly swap spreads) are relatively low and stable, and this—combined with the absence of tight money—suggests that the risk of recession is low for the foreseeable future. The unusually wide spread between the yield on cash and the yield on risk assets is a compelling reason to stay invested.

The dollar is reasonably valued against most other currencies, according to the Fed's Real Broad Dollar Index, and my analysis of the dollar's PPP value against other major currencies is largely in agreement with this. Raw industrial commodity prices are neither very high nor very low, but they have been trending higher this year and this suggests some firming in the global economic outlook—which, like that of the U.S., has been unimpressive of late, if not a bit troubling.

- - - - -

In the meantime, Trump's chances are improving daily and I think the election will soon be his to lose. On Monday I'll be scrambling to find a TV down here that will let me watch the first debate, or, failing that, an internet connection fast enough to live-stream the action.

Monday, June 27, 2016

Brexit Panic progress report

(I've posted a few updates on this report, which appear at the bottom of this post)

The UK's vote to leave the European Union has sent tremors throughout global financial markets. But keep in mind that the vote was not binding, and nothing has happened so far; it will likely take a year or so for the UK to hammer out new trade agreements, if indeed it does exit the EU. The UK is a huge net importer of goods, so the great majority of its trading partners will be loathe to lose access to its market. It's conceivable that the UK could eventually end up with better trade deals than it has currently. The EU made free trade deals with the US difficult, for example, so an independent UK might benefit from better US ties.

But anyway, who wants trade to grind to a halt? That's one of the great things about the age of globalization: the more trade there is among nations, the more incentive everyone has to coexist peacefully and prosperously. Trade barriers and tariffs exist only to protect favored interests; in an ideal world, all trade would be free, just as capital should be free to go wherever it wants. If the UK comes out of this stronger, other nations will follow (competition is a wonderful thing). In fact, that's one of the very good things that could come of a Brexit: shaking off the Eurosclerosis that has held back growth in the Eurozone for many years.

For example: once unencumbered by EU regulations, the UK could convince Apple to relocate to London under favorable tax terms that wouldn't be subject to EU rejection. Plus, with the pound so much cheaper, investment in the UK suddenly looks more attractive on the margin.

Unfortunately, we don't live in an ideal world. Global trade and prosperity are far from being maximized, thanks to politicians and special interests. The real issue surrounding Brexit is whether the gradual breakdown of the EU (others are sure to follow, especially if the UK comes out a winner) will result in trade that is freer or less free. We won't know the answer to that question for years, of course, but I suspect that competition among nations will drive better and freer trade relations, and that would be very good for growth from a long-term perspective.

In the meantime, life and trade goes on and the latter is quite unlikely to grind to halt or even slow down, for the next several months. Meanwhile, the world's productive assets are trading at a 5-10% discount all of a sudden. Absent some clear indication that global commerce is truly at risk, it will be hard for this discount to deepen much further or persist for long, especially when cash still yields almost zero.

For now, markets are actively exploring the possibilities, and risk-averse investors are getting out while others pick up assets on the cheap. To put things into perspective, I offer 10 charts which chronicle the progress as of today:


To begin with, I note that the volume of world trade, shown in the chart above, has more than tripled in the past 25 years, rising at an annualized rate of 5% from 1991 through last April. But the expansion of global trade has slowed down significantly since 2008, and it is up only 1.4% in the past year. I'd put some of the blame for the slowdown on trade barriers and eurosclerosis. The US has suffered from slow growth over the past decade or so, but the Eurozone has suffered much more; no wonder there's so much popular discontent.


In the past month, since the likelihood of a Brexit began to rise, the pound has lost about 10% of its value relative to the dollar and 9% relative to the Euro. Two years ago, at 1.70 to the dollar, the pound was expensive on a PPP basis. Now it's trading around fair value, according to my calculations. This ought to be enough to awaken interest in UK investments.


2-yr swap spreads are still relatively low, which suggests that liquidity is plentiful and systemic risk is relatively low. Spreads are quite a bit higher in the Eurozone than in the US, however, which is not surprising given all the concern over there. But spreads are much lower today than they were at the height of the PIIGS crisis back in 2011. The Eurozone is not on the verge of collapse, and no one is talking about abandoning the Euro.


Having plunged to 1.44% today, 10-yr Treasury yields are about as low, on a closing basis, as they have ever been (the all-time closing low was 1.39% in late July 2012). It's almost as if the world has lost all hope of ever enjoying decent growth or rising inflation again. Treasury yields are abysmally low not because the Fed is driving rates down artificially; rates are low because the market despairs of ever seeing stronger growth, meanwhile continuing to worry about slow growth devolving into deflation. This is one of the best barometers of pessimism that I know. Meanwhile, 10-yr government yields are -0.12% in Germany and -0.19% in Japan—both at all-time record lows. Abandon all hope, yee who live in the modern world today, the market seems to be saying. Pessimism is the order of the day.


Credit spreads have ticked up of late, but they are still far below levels that we would expect to see in a crisis.


Not surprisingly, the Brexit Panic has boosted the prices of the world's classic hedges against uncertainty: gold and TIPS. But we seen worse, as the chart above shows. Gold is up 25% so far this year, and it's up 10% in just the past month, but it is still down 30% from its 2011 high. Similarly, TIPS prices today (as proxied by the inverse of their real yield in the chart above) are up this year, but still much less than they were at their peak in 2012. Investors are crowding the exits, but we've survived worse.

'

The chart above is one I've shown repeatedly for a long time. One curious development of late is that the market's level of fear, uncertainty, and doubt is almost as high as it has been during other crises of recent years, but the decline in equity prices has been much less. In fact, the Vix index fell from 25.8 yesterday to 23.9 today, while stocks fell almost 2%. Typically, stocks and the Vix move in opposite directions. The chart below helps explain why:


The chart above compares the S&P 500 to its Eurozone counterpart. Using these two indices as representative of stocks in the US and in the Eurozone, US stocks have outperformed Eurozone stocks by a whopping 55% over the past six years. What's bad for the Eurozone has not been bad at all for the US. The world's two economic powerhouses are no longer moving in lockstep. All the more reason for the UK to abandon the leaky EU ship.

We may well see more pain and suffering as investors worry about all the unknowns that lie down the road over the next few years. But the end result doesn't have to be bad at all, and it could in fact be very positive. The UK has just opened the door to competition in Europe, and competition almost always results in things getting better. Only politicians and bureaucrats think otherwise.

UPDATE (6/28, 13:30 PT): Stocks had a nice bounce today, while the Vix/10-yr ratio fell sharply, due mainly to a plunge in the Vix Index; 10-yr yields barely budged from their all-time lows. Note the magnitude of the move and the recent reversal of the Vix/10-yr ratio in the chart below, compared to the relatively muted response of stocks. This suggests that Brexit fear is out of proportion to the realities on the ground:


UPDATE (6/29, 13:30 PT): Stocks had yet another bounce today. The Vix fell from 18.8 to 16.6, but the 10-yr Treasury yield only rose 4 bps, ending at a very low 1.51%. So the market is getting over its fear, but has yet to regain any confidence in the outlook for growth. The bond market doesn't see any meaningful chance of an increase in short-term interest rates until some time next year. Near-term inflation expectations remain low, at 1.4%, but gold prices rose to a 2-yr high of $1319/oz. 


Meanwhile, the SKEW index, shown in the chart above (a measure of how much the implied volatility of out-of-the-money equity options exceeds the implied volatility of in-the-money options—and thus a measure of how much more investors are willing to pay for protection against extreme moves, as opposed to moderate moves, in equity prices), has reached an all-time high. The market realizes that not much is going to happen in the near-term as a result of Brexit, but it is still very much concerned about the long-term consequences. HT: Zero Hedge


UPDATE (7/1, 2:30 pm): Equities have almost completely recovered the losses they sustained following last week's Brexit vote. The Vix index has declined significantly, but 10-yr Treasury yields remain at all-time lows. What this means: the market is not very nervous anymore, but optimism regarding the future is in very short supply.


Tuesday, December 1, 2015

Interest rate spreads drive the dollar

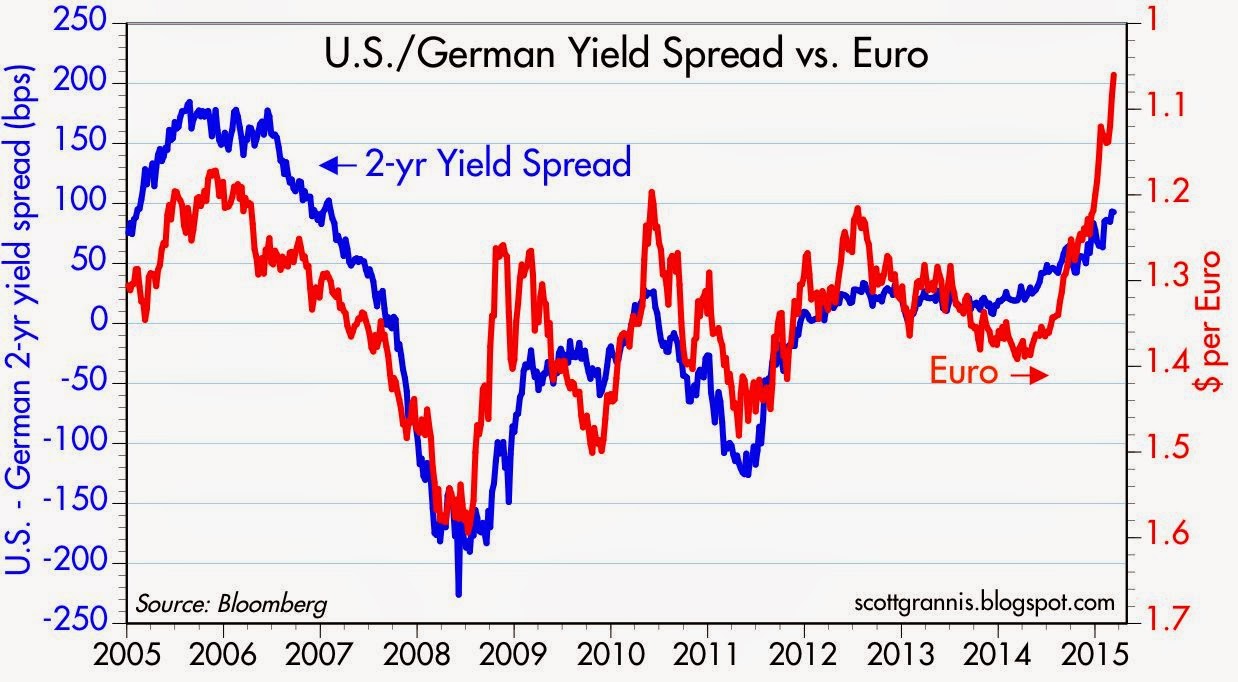
With U.S. short-term rates rising and Eurozone rates falling deep into negative territory it's not surprising that the dollar has been gaining against the Euro. Behind these moves is a U.S. economy that appears healthier than the Eurozone economy, and that in turn conditions markets to expect very different monetary policy conditions for the foreseeable future. The dollar's strength to date is salutary and not overdone, so it doesn't present a problem for the U.S. economy. (Question to those who worry about the strong dollar: If a stronger economy is what is driving a stronger dollar, why should a stronger dollar be bad for the economy?)


The chart above compares 2-yr Treasury yields with 2-yr German yields. They have diverging for almost two years now, driven by the growing perception that the Fed would raise rates sooner than the ECB, and more recently, by the ECB's professed willingness to actively pursue easier monetary policy for the foreseeable future.


The chart above makes it clear that interest rate differentials between the U.S. and the Eurozone (blue line) go hand in hand with changes in the Euro/dollar exchange rate (red line). The dollar has strengthened vis a vis the Euro in line with more attractive U.S. interest rates.


The chart above compares the dollar value of the Euro against my calculation of the dollar's Purchasing Power Parity against the Euro (green line), which can be thought of as the exchange rate that would result in prices in the Eurozone being generally comparable to prices in the U.S. By my calculations, the dollar is almost 10% above its PPP value against the Euro, which means that U.S. tourists to the Eurozone should find that things are a bit cheaper there. It's nice to have a strong dollar, and it's not strong enough at current levels to worry about.

Friday, March 13, 2015

Time for a European vacation


Today the Euro hit a 12-year low against the dollar. According to my calculation of the PPP value of the Euro, it is roughly 10% "undervalued" vis a vis the dollar. That means that Americans traveling to Europe should find that, on average, goods and services on the Continent are about 10% cheaper than they would be here. It's time to schedule that European vacation!

Note that the chart shows that the Euro has been much weaker in the past, at times, than it is today. So there is nothing terribly unusual going on. I think the dollar's strength is a function of the fact that the U.S. economy seems more dynamic than the Eurozone economy. That naturally tips the balance of monetary policy towards higher rates in the U.S. than in the Eurozone.


And as the chart above suggests, the interest rate differential does appear to be contributing to the Euro's weakness.