Friday, September 9, 2011
Inventory and other recoveries
It may seem like a minor milestone, but this chart of wholesaler inventories shows that there has been a complete recovery (some might even call it a V-shaped recovery) following the great recession of 2008-9. This is an important barometer of business confidence and of economic conditions in general. Things are getting back to normal.
Just for fun I'll include a variety of other charts that show some complete or near-complete recoveries in other areas:
Nominal GDP has fully recovered and then some. Of course, much of this recovery is due to inflation. Real GDP as of June '11 was still 0.5% below its Dec. '07 high, but it will very likely exceed that high before the end of this year.
U.S. exports of goods and services have fully recovered and then some. Exports are now at record levels both nominally and as a percent of GDP, continuing the many-decades trend toward increased globalization. The U.S. economy has never been so integrated into the rest of the world. The export sector has never been such an important part of the economy. We are recovering and adapting in ways we never imagined before.
Retail sales have fully recovered and then some. Real retail sales are only about 3% below their prior high. Both recoveries are impressive given that the total number of people working today is still almost 5% less than at the peak in early 2008. Those still working are therefore more productive than their former counterparts.
2-yr swap spreads have recovered to levels that are consistent with a normally growing economy and healthy financial markets. This is extremely important, since swap spreads (see primer here for more info) are excellent, forward-looking indicators of financial market health, systemic risk, and general liquidity conditions.
New orders for capital goods (a good proxy for business investment spending) are only 3% shy of reaching a new high. Businesses have almost completely recovered from the shock to confidence that occurred in 2008. Capital spending is the seed corn of future productivity gains, so this augurs well for future growth.
After-tax corporate profits have recovered in spectacular fashion, and are 30% higher today than their pre-recession high. Businesses have undergone tremendous restructuring efforts, and productivity is high. This gives businesses an important cushion against adversity, and it provides the fuel for new job-creating opportunities in the future.
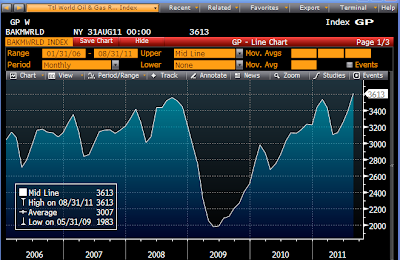
The first of the two charts above shows the total oil and gas rotary rig count in the U.S., which is within inches of recovering to its former highs. The second chart shows the global oil and gas rotary rig count which has already achieved that objective. The recovery in oil and gas exploration efforts is significant, considering that oil prices are still some 40% below their peak of 2008. This offers the promise that oil supplies will at least meet the world's growing demand for oil, thus keeping prices from returning to punishingly high levels. Meanwhile, huge new reserves of natural gas are now being exploited in the U.S., thanks to new drilling techniques, and this has brought natural gas prices down by over 80% from their 2008 peak. The energy outlook is bright.
What all of these charts show is that there has been important if not impressive progress on a number of economic and financial fronts. The financial and economic fundamentals of the U.S. economy have definitely improved and continue to improve in many areas. This contrasts acutely with a) the lowest Treasury yields in history, and b) $1850 gold, both of which are symptomatic of a market that is priced to nearly catastrophic conditions in the near future. Yes, conditions look bad in Europe, and yes, the Obama administration has done a piss-poor job of managing the economy, but are we really facing the end of the world as we know it?
Subscribe to:
Post Comments (Atom)


2 comments:
Another excellent collection of charts and explanations by Scott Grannis.
I just wish the market and employers would read these charts.
scott, your work provides good support for a contrarian point of view.
i have a question for you. i am looking for near term signposts that will indicate the market is about to get less focused on europe and visions of catastrophe than the types of factors illustrated by your recent posts.
as i see things, the end of september target date to fund the 400B euro fund is a crucial date. also important is the september fomc meeting. slightly farther out if the result of the supercommittee.
these are relatively near term events that might alleviate catastrophe sentiment (or exacerbate it). i am thinking this is a risky, but potentially rewarding, time to act on a contrarian impulse.
interested in your thoughts.
Post a Comment