


As we now face another source of concern with the political turmoil in the Middle East and rising oil prices, I thought it might be helpful to review those same charts plus a few others. As should be evident, the fundamentals of the U.S. economy remain strong, and this is good reason to expect that the economy will continue to push ahead in spite of the headwinds it faces.

Business investment rose 16% last year. Strong capex spending points to growing confidence on the part of business, and that is a leading indicator of future growth in the economy.

Industrial production is rising all over the world. Adverse weather resulted in a modest slowdown in U.S. production in recent months, but production was up 8% in the Eurozone last year, and 5% in Japan. There is still plenty of idle capacity in world manufacturing that can be put to work quickly and cheaply as demand rebounds.

Commodity prices continue to rise across the board, though agricultural commodities appear to have hit a speed bump the past few days. Rising prices reflect strong growth in global demand and/or accommodative monetary policies worldwide. Whatever the case, rising commodity prices all but preclude a bout of debilitating deflation, and rule out the existence of a double-dip recession.

Global trade continues to expand. U.S. exports surged at a 17.6% annualized pace in the second half of last year.

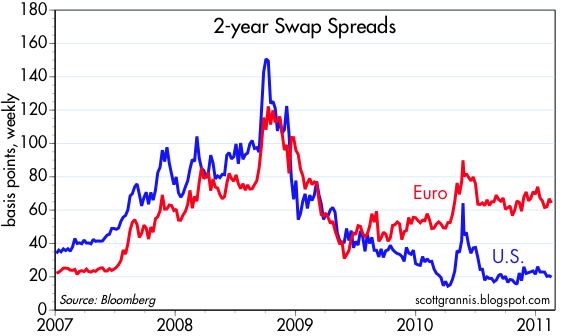
Credit spreads have been reliable leading indicators of recessions in the past, and tighter spreads usually signal improving economic conditions. U.S. credit spreads are now at their tightest levels since the end of the recent recession, confirming that economic fundamentals continue to improve. Swap spreads are good indicators of systemic risk and leading indicators of future economic and financial conditions. U.S. swap spreads have been quite low and stable for the past six months, an indication that U.S. financial fundamentals are about as healthy as they can get. Europe remains troubled, however, but Euro swap spreads are not high enough to signal anything more than the likelihood that there will be some form of sovereign debt default in Europe before this is all over, and even should that happen, it is not likely to bring down the Eurozone economy.


According to the ASA Staffing Index, demand for temporary and part-time workers is steadily increasing; compared to this time last year, temp hiring is up almost 14%. Gains of that magnitude are fully consistent with an improving economy.

Auto sales have surged at a 16.6% annualized pace since hitting bottom in Feb. '09. This strongly suggests further growth in the economy, and it reflects very favorably on consumers' confidence and financial health. Car sales have consistently exceeded expectations for at least the past year, and that means that manufacturers are continuing to ramp up production targets, and that in turn leads to ripple effects throughout the economy. What's good for Detroit is good for the country.

Large-scale corporate layoffs ended almost a year ago. That means corporations have done most or all the belt-tightening they are likely to do. Businesses are lean and mean, and profits are very strong. Further improvement in the economy is thus very likely to result in more hiring.


It's rare for the economy to stumble when corporate profits are rising. Profits are now at record levels, both nominally and relative to GDP, so it's very likely the economy will continue to grow. As a result of very strong profit performance, corporations are sitting on over $1 trillion in accumulated profits. That could provide a tremendous amount of fuel for future investment, economic growth, job gains, and income gains.

Although the Vix index (a proxy for the degree of fear and uncertainty that the market is pricing in) has jumped to 21 today, as of yesterday financial conditions were essentially "normal" according to the Bloomberg Financial Conditions Index. Normal financial market conditions are fully consistent with a healthy and growing economy.


A significant increase in new cargo ships has depressed shipping costs for bulk commodities (as reflected in the Baltic Dry Index), but the Harpex Index of shipping costs for N. Atlantic containerships continues to rise.


The equities of major home builders have been relative stable for the past year, suggesting that the housing market bust has run its course. With new construction far below what is needed to keep pace with a growing population, residential construction activity will sooner or later start picking up significantly as housing inventories are depleted and consumers return to the market. Meanwhile, prices for commercial and residential real estate have been roughly flat for almost two years. This is the sort of action you would expect to see as a market that has been severely overbuilt and distressed slowly consolidates.

This chart of commercial mortgage-backed security prices lends strong support to the notion that the real estate crisis has passed and underlying conditions are actually improving quite a bit. Distressed sales and fears of a deflation/depression pushed these AAA CMBS prices down as low as 55 at the peak of the crisis, but they have since rebounded to just over 97. Why? Because defaults have been far less than was once feared. This chart also points to significant unrealized gains on the books of banks and institutional investors who were forced to write off significant amounts as the prices of securities collapsed, but have yet to declare the subsequent gains in the securities they held on to (i.e., profits at many firms are likely understated).

The leading indicators continue to point to growth. Nothing here to suggest even a whiff of impending weakness.

Federal revenues have been rising at a 10% annual rate for the past year. This is an excellent sign of economic health, since it reflects rising incomes, rising capital gains, and rising corporate profits.

The M2 measure of money supply has been growing about 6% per year on average for a long time. That it continues to do so means that a) there is no shortage of money in the economy and b) the Fed's Quantitative Easing program has yet to result in any unusual increase in the amount of money circulating through the economy. In turn, the latter suggests that there is no reason yet to fear a burst of inflation or an unexpected tightening of monetary policy that could threaten the economy's ability to grow. Although I and many others continue to worry that QE2 will prove inflationary, the jury is still out. Meanwhile, the Fed has managed to expand the supply of money by enough to satisfy the increased, fear-related demands for it, thus avoiding any risk of deflation.


Last but not least, manufacturing conditions according to the Institute for Supply Management are very healthy, suggesting that GDP growth in the current quarter could easily be 4-5%. Moreover, since last August we see that conditions in the much larger Service Sector have improved significantly. To top things off, both the manufacturing and service sector surveys reflect substantial improvement in new hiring activity.
13 comments:
Scott,
Great post. The fundamentals for continued economic growth are clearly still present. We will experience corrections/pullbacks in the market prices of securities from time to time but it is still a bull market.
Quite a tour de force by Scott Grannis
BTW, plenty of spare capacity in OPEC right now. The oil price has me worried, but I suspect the trend is down from here and for a long time. Demand flatlines at more than $90 a barrel. In fact, global crude oil use has been flat for years, and has been falling in Europe and Japan for decades.
Corporate profits are fantastic, given that the recovery has just started.
Capital is everywhere and abundant. This can only be good for equities and property. I suspect we see capital gluts again soon.
All very hopeful comments but I suspect we just don't know how the unrest in the Middle East can ultimately affect all of Scott's charts. If Islamists take control in any significant oil producing country, I would say all bets are off. Remember Bin Laden's goal to get oil prices over $200/bbl.
Bill,
The goal for every E&P oil driller is $200 a bbl as well. It does not mean it will get there, and or stay there.
If you will recall, Brazil, (the Tupi, and later, Lula), will come online with absolute monster pools of new product this year from places that just a few years ago, no one thought would yield product in the first place.
Excellent as always....
There are a couple of problems with your analysis.
1. The fundamental weaknesses of the US economy are being covered up by the Fed printing money. People are confusing a recovery caused by printing money with a true genuine recovery. Money printing doesnt create long term economic growth it only creates the ILLUSION of growth.
2. All your analysis is BACKWARD looking, it cant predict the future. I used the same methodology you used for 2011 but simply looked at all your charts to up 2007 but not beyond and I can come to the same conclusion youre coming to right now. There is very little chance of a recession in 2008 based on economic charts from 2005-07. But of course we know that isnt the case.
By the time your charts flash recession, one is already well under way.
The UCLA Anderson School of Business had a study that essentially concluded that the recession from Dec 2007 to Aug 2008, before the crash, was caused by oil over $100.
Here the is the problem the US faces. An extremely large portion of the debt issued since 2008 has been bought by the Fed. Soon that will not only have to stop but the Fed will begin shrinking its balance sheet. Tell me who is going to buy anywhere from 1.5 trillion to over 2 trillion dollars in treasuries annually for the next 2-3 years???? Additionally, the Fed(which failed to see both the DOT.com and Housing bubbles0 has to remove all the excess liquidity in the exact amount at the exact moment in time. Too little too late = run away inflation. Too much too soon = downward spiraling deflation.
No the economic fundamentals are not good and no the crisis is not over. It lies ahead.
Several things definitely predicted and preceded the recession: rising swap spreads, a flattening of the yield curve, a significant increase in the real Fed funds rate, a rise in the Vix index, and yes, the rise in oil prices, though oil didn't peak until July '08, well after the recession was underway.
As I mention in this post, high oil prices become much more problematic when combined with tight money. That is not the case today.
great job scott.
i was wondering what would make this market correct a bit, and that it is the proliferation of unrest against middle east dictators is just fine with me...i would take this over a sovereign default in the eurozone any day of the week.
time to put some dry tinder to work
Nice charts. But your conclusions are dependent upon short time horizons. The earliest graph starts in 1960, hardly a long enough picture to produce confidence in a forecast. Charts from the Wars and Great Depression might tell a different story.
Excellent post. Your explanation of the Fed actions are clear and accurate.
QE as little to do with money supply and reserves are still high but a lot of profits are made from artificially low rates.
Lets face it savers have been punished to bailout bad business that should be close and others have and are benefiting from this fabulous spread that the 0% cost of money provides. How much of this growth is nothing but transfer of wealth and and how long can it be maintained.
Good stuff..I tell ya it's tough being the only guy in my county who thinks there IS a recovery :)
Post a Comment